Int. J. Electrochem. Sci., 14 (2019) 11065 – 11080, doi: 10.20964/2019.12.65
International Journal of
ELECTROCHEMICAL
SCIENCE
www.electrochemsci.org
The Behaviour of Tribocorrosion on EH47 High-Strength Ship
Hull Steel in a 3.5% NaCl Solution
Hongmei Zhang1,2,*, Yan Li2, Na Li1, Ling Yan2, Yangyang Zhu 1,Changshun Wang2,
Fangfang Ai2, Zhengyi Jiang 1,3*
1 School of Material and Metallurgy, University of Science and Technology Liaoning, Anshan 114051, China
2 State Key Laboratory of Metal Material for Marine Equipment and Application, Liaoning, Anshan, 114009
3 School of Mechanical, Materials and Mechatronic Engineering, University of Wollongong, Wollongong NSW 2522, Australia
*E-mail: zhanghm@ustl.edu.cn, jiang@uow.edu.au
Received: 6 August 2019 / Accepted: 29 September 2019 / Published: 29 October 2019
In this paper, the tribocorrosion behaviour of EH 47 high-strength ship hull steel in a 3.5% NaCl solution was investigated. The tribological and corrosion tests were carried out on a Si3N4 ball-on-EH47 high-strength ship hull steel disc tribometer under different sliding time conditions. The disks were continuously immersed in sandy 3.5% NaCl solution during the whole process of the tribological tests. After the tribological tests, electrochemical tests were carried out to obtain typical polarization curves and electrochemical impedance spectroscopy diagrams. The corrosion experiments were performed to investigate the effect of abrasion on corrosion behaviour by immersing the samples in a container with 3.5% NaCl solution and 5 wt.% silica sand at room temperature for 7, 14, and 49 days. The micrographs, compositions and corrosion products of the worn scars were evaluated by scanning electron microscopy (SEM) and energy dispersive spectroscopy (EDS) microanalyses.
Keywords: Corrosion; Abrasion; Marine environment; Wear mechanism; Tribological tests
1. INTRODUCTION
materials causes a large amount of the energy wasted by marine vehicles every year and has become one of the technical bottlenecks restricting the development of major marine engineering technologies and equipment. Therefore, the corrosion and failure mechanisms of materials have become an urgent problem to be solved in the field of marine engineering [5, 6].
Since the 1930s, a large number of studies on the corrosion of materials in natural seawater have been carried out by scholars of industrially developed countries such as the United States and Europe. The United States has published 16 years of corrosion data for 52 materials and 3 years of corrosion data for 475 materials [7]. Wang et al. [8, 9] proposed the off-site corrosion behaviour evaluation technique for evaluating environmental behaviour by electrochemical methods and databases of 5 kinds of ocean engineering steel that is used at depths of 5000 metres. Al-Muhanna et al. [10] investigated the influence of season and temperature change on the metal corrosion behaviour in the Kuwait channel using an electrochemical impedance technique. Quej-Aké et al. [11] reported the corrosion inhibition effect of non-ionic surfactant on X52 pipeline steel in NaCl solution. Gao et al. [12] studied the initial corrosion behaviour of X80 pipeline steel in yellow sea water. Melchers [13] presented long-term immersion corrosion on steel in seawater with a relatively high nutrient concentration in the seawater. Toloel et al. [14] investigated the synergistic effect of seawater parameters under the corrosion rate of carbon steel, including pH value, temperature and salinity in a turbulent state. Zhang et al. [15] studied the influence of tempering temperature on corrosion behaviour of R5 steel in artificial seawater. Zhou et al. [16] reported the corrosion behaviour of low-carbon micro-alloyed steel in a Cl-containing environment. Shen et al. [17] studied the corrosion behaviour of EH40 steel in a low-temperature NaCl solution. Melchers [18] proposed a detailed report of steel corrosion and models to explain the various corrosion mechanisms. Zayed et al. [19] and Panayotova et al. [20] described the main environmental factors that affect the main corrosion mechanisms.
In the corrosive medium of a harsh marine environment, a layer of surface film with properties different from the matrix will be formed on the metal surface [21]. This film will be thinned or broken or experience other complex changes due to friction or particle impact [22]. Wear can thin or damage the passivation film, exposing the surface to the solution. Agitation of the solution accelerates the diffusion of corrosion products (metal ions), and the surface shear force increases surface dislocations, vacancies and other defects; the above results increase the surface activity that leads to corrosion acceleration, and the corrosion rate of the metal is thus increased [23-26]. Analyses of corrosion and wear of 304SS stainless steel and the interaction between corrosion and wear show that the friction and wear process promote the occurrence of macroscopic electrical corrosion of materials and intensify the corrosion tendency of materials[27]. Papageorgiou et al. [28] presented his work on tribocorrosion mechanisms of a NiCrMo-625 alloy.
action of abrasion, resulting in the failure to form a complete protective film in the worn area, thus showing an interaction between corrosion and wear [31-33].
Due to outstanding low-temperature impact toughness, high strength, prominent weldability, and high-performance ship plate steel extensions, the high-strength EH47 grade ship steel exhibits great potential for polar expedition ships. To investigate the tribocorrosion behaviour of the EH47 high-strength ship hull steel in 3.5% NaCl solution, tribological and corrosion tests were carried out on a Si3N4 ball-on-EH47 high-strength ship hull steel disc tribometer for 240 min, 120 min, and 60 min at loads of 100 N. The disks were continuously immersed in sandy 3.5% NaCl solution during the whole process of the tribological tests. After the tribological tests, electrochemical tests were carried out by a CHI760E electrochemical workstation using a working electrode with corrosion samples under different wear conditions and an electrolyte with seawater at room temperature. The corrosion experiments were carried out by immersing the samples in a container at room temperature for 14 and 49 days after the wear test.
2. EXPERIMENTAL
2.1 Materials
EH47 was used as the disk material in this study and is a low-alloyed high-strength ship hull steel. The chemical composition of the disk material is (in wt.%) C: 0.07, Si: 0.20, Mn: 1.42, P: 0.006, S: 0.001, Cr: 0.07, Ni: 0.79, Mo: 0.22, Nb: 0.04, V: 0.006, Ti:0.013, Al: 0.03 and Fe balance.
2.2 Experimental tests
The wear tests were performed by an Rtec MFT-5000 Multi-functional Tribometer under different sliding time conditions. The disks were immersed in a 3.5% NaCl solution with 5% sand at 0 ℃ (salt water with ice).
2.3 Electrochemical measurement
polarization curve test was 0.5 mV/s, and the scanning range was -200~200 mV relative to the open circuit potential. The frequency range of the electrochemical ac impedance was 0.1 ~ 10 MHz, and the voltage amplitude was 10 mV.
2.4 Corrosion Experiment
After the wear experiments, the corrosion experiments were carried out for 7, 14, and 49 days by immersing the samples in a container at room temperature. The container was filled with 3.5% NaCl solution and 5 wt.% silica sand.
2.5 Characterization methods
The 3D profile of worn tracks on the disks was observed by a Keyence VK-5000 3D Laser Scanning Microscope. The micrographs and surface composition of the abrasion scar surfaces and the corrosion surface were performed by a scanning electron microscope (ZEISS-Sigma, SEM, German) and with energy dispersive spectroscopy (EDS) microanalyses.
3. RESULTS AND DISCUSSION
3.1 Wear test
Figure 1. SEM micrographs of worn scars on the disk surface under different sliding conditions (100 N loads, 200 rpm sliding rate, disks immersed in 3.5% salt water with ice and sand):(a) (b) sliding time of 240 min, (c) (d) sliding time of 120 min, and (e) (f) sliding time of 60 min. 3.2 Potentiodynamic polarization curve analysis
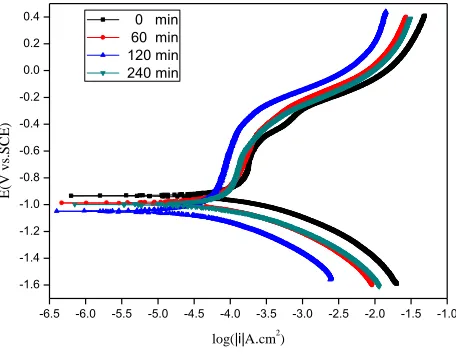
The electrochemical corrosion process can be analysed with polarization curve measurements. The electrochemical fitting parameters, i.e., corrosion current densities (Icorr), corrosion potential (Ecorr), polarization resistance (Rp), and anodic and cathodic Tafel constants (a, c), were obtained by extrapolation of Tafel lines[35, 36]. The typical polarization curves of the studied steel in salt water for 0 days after different sliding times of 240 min, 120 min, 60 min and 0 min are shown in Fig. 2. The fitting data are shown in Table 1. As shown in Table 1, the corrosion current density of the original sample is lower than that of samples of all sliding times, which indicates that the wear will accelerate the corrosion. Meanwhile, the corrosion current density of the 120 min sliding time is lower than that of the 60 min and 240 min sliding times, indicating that the corrosion rate does not increase with the sliding time. The smallest corrosion rate is observed at 120 min, and the largest corrosion rate is observed at 60 min. From the polarization curves, it can also be seen that the cathodic and anodic reaction rate shapes of the curves did not change greatly with increasing sliding time, which indicates that the wear process did not significantly affect the cathodic and anodic reaction processes. The change trends of the largest corrosion potential (Ecorr) and polarization resistance are the opposite of each other: the smallest corrosion potential (Ecorr) and largest polarization resistance appear at 120 min, and the largest corrosion potential and smallest polarization resistance are obtained at 60 min. The results show that the corrosion current densities obtained under tribocorrosion conditions are higher than those obtained under corrosion-only conditions. Friction obviously accelerates the corrosion of the samples.
Figure 2. Polarization curves of EH47 steel (the samples were obtained after the wear test under different sliding times of 0 min, 60 min, 120 min, and 240 min with 100 N loads and a 200 rpm sliding rate).
The typical polarization curves of the studied sample with different sliding times and immersion in salt water for 14 days are shown in Fig. 3. The fitting data are shown in Table 2. From the polarization curves, the cathodic and anodic reaction rate shapes of the curves show little change with sliding time and corrosion time, which indicated that the wear process had little effect on the cathodic and anodic reaction processes. The Tafel slope constants (βa and βc) do not change significantly
-7.0 -6.5 -6.0 -5.5 -5.0 -4.5 -4.0 -3.5 -3.0 -2.5 -2.0 -1.5 -1.0 -1.6 -1.4 -1.2 -1.0 -0.8 -0.6 -0.4 -0.2 0.0 0.2 0.4 0.6 E(V v s. SCE) log(|i|A.cm2 ) 0 min
[image:6.596.163.419.418.613.2]
in the inhibited system compared to the uninhibited system. This suggests that the inhibitor does not participate in the mechanism of corrosion [36,37]. The corrosion current density for the 0 min sliding
time is lower than that for all other sliding times, indicating that wear can accelerate corrosion, as shown in Table 2. Furthermore, the corrosion current density of the 120 min sliding time is also lower than that of the 60 min sliding time, which indicates that the corrosion rate does not increase with sliding time. The smallest corrosion rate is observed at 120 min, and the largest corrosion potential is observed at 240 min. The change trends of the largest corrosion potential (Ecorr) and polarization resistance are the opposite of each other, with the smallest corrosion potential (Ecorr) and largest polarization resistance appearing at 120 min and the largest corrosion potential (Ecorr) and smallest polarization resistance appearing at 0 min. The results show that the corrosion current densities obtained under tribocorrosion conditions after 14 days of corrosion are higher than those under corrosion-only conditions and under tribocorrosion conditions after 0 days of corrosion. The increasing corrosion time and friction can obviously accelerate the corrosion of the samples.
Table 1. Potentiodynamic polarization parameters from applying a curve-fitting approach to EH47 steel data (the samples were obtained after the wear test under different sliding times of 0 min, 60 min, 120 min, and 240 min with 100 N loads and a 200 rpm sliding rate).
Sliding time (min)
Ecorr (V.SCE-1)
Icorr (A.cm-2)
Rp (Ω.cm2)
0 -0.84 2.19×10⁻⁵ 1651
60 -0.89 5.93×10⁻⁵ 791
120 -1.02 2.36×10⁻⁵ 1772
240 -0.91 5.48×10⁻⁵ 819
Figure 3. Polarization curves of EH47 steel . The samples were obtained after the wear test under different sliding times of 0 min, 60 min, 120 min, and 240 min with 100 N loads, a 200 rpm sliding rate and immersion in 3.5% NaCl solution for 14 days.
-6.5 -6.0 -5.5 -5.0 -4.5 -4.0 -3.5 -3.0 -2.5 -2.0 -1.5 -1.0 -1.6 -1.4 -1.2 -1.0 -0.8 -0.6 -0.4 -0.2 0.0 0.2 0.4 E(V v s. SCE)
log(|i|A.cm2) 0 min
[image:7.596.55.531.368.485.2] [image:7.596.180.408.524.702.2]
Table 2. Potentiodynamic polarization parameters from a curve-fitting approach under different sliding times of 0 min, 60 min, 120 min, and 240 min (the samples were obtained after the wear test under different sliding times with 100 N loads, a 200 rpm sliding rate and immersion in 3.5% salt water for 14 days).
`Sliding time (min)
Ecorr (V.SCE-1)
Icorr (A.cm-2)
Rp (Ω.cm2)
0 -0.93 11.07 408
60 -0.98 6.55 677
120 -1.05 3.52 1286
240 -1.00 7.70 564
3.3 Electrochemical impedance spectroscopy
Figure 4. EIS of EH47 steel at different sliding times of 0 min, 60 min, 120 min, and 240 min (the samples were obtained after the wear test under different sliding times with 100 N loads and a 200 rpm sliding rate).
EIS has been employed frequently in determining the kinetics of metals and alloys for electron transfer reactions at the metal/solution interface [38,39]. The electrochemical impedance spectroscopy
(EIS) curves of the studied steel at different sliding times of 240 min, 120 min, 60 min and 0 min are shown in Fig. 4. In Fig. 4, each Nyquist plot shows a single capacitive loop in the measured range of applied frequency. The capacitive loops at high frequency reflect the electrochemical impedance characteristics of a film and the double electron layer on the metal surface [40], and the inductive loops at low frequency are attributed to the occurrence of pitting corrosion or the adsorption relaxation process of
some species. [41]. The impedance response behaviour of EH47 steel shows significant changes at
[image:8.596.56.544.294.511.2]
behaviour of a surface film and double electron layer on the surface of metals and alloys [22]. In the present study, the presence of a single capacitive loop is attributed to a surface passive film on EH47. As the radius of the capacitive reactance arc decreases, the transfer resistance on the surface of the alloy decreases, which reflects decreased corrosion resistance.
Figure 5. EIS of EH47 steel at different sliding times of 0 min, 60 min, 120 min, and 240 min (the samples were obtained after the wear test under different sliding times with 100 N loads, a 200 rpm sliding rate, and immersion in 3.5% NaCl solution for 14 days)
In previous studies, much research has been conducted on the synergistic effect of the erosion-corrosion effect[42]. Guo and Lu[43] investigated the interaction of mechanical and electrochemical factors in the corrosion process of A1045 carbon steel. Gao investigated the cavitation erosion-corrosion process of Q235 and ZG06Cr13Ni4Mo with various applied potentials [44].
[image:9.596.56.544.170.336.2][image:10.596.52.546.93.652.2]
3.4 Corrosion product analysis
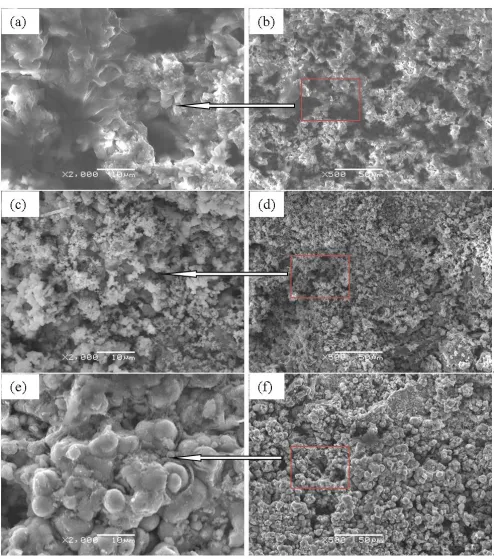
Figure 6. Disk surface corrosion layer morphology of the worn track: (a) (b) 60 min, (c) (d) 120 min, and (e) (f) 240 min (the samples were obtained after the wear test under different sliding times with 100 N loads, a 200 rpm sliding rate, and immersion in 3.5% NaCl solution for 7 days).
[image:11.596.51.545.126.696.2]
and has microcracks, as shown in Fig. 6. There are two types of micrographs for the corrosion product on the worn tracks of the disk.
[image:12.596.52.546.150.713.2]
The one type presents a block shape that gradually agglomerated, as shown in Fig. 6 (a), (b), (c), and (d). The other is a cluster structure of the corrosion product, as shown in Fig. 6 (e) and (f). Hence, at long sliding times, the corrosion product on the wear tracks of the disk is denser and has fewer microcracks than that at short sliding times.
Fig. 7 presents a micrograph of the corrosion layer on the worn tracks of the disk after 14 days of immersion in 3.5% NaCl solution. It can be clearly observed from Fig. 7 that the rust layer corrosion on the worn tracks of the disk has a needle cluster structure, and there are many microcracks.
The corrosion product layers have flower-like shapes with increasing sliding time, as shown in Fig. 7 (e)
and (f). The corrosion product on the worn tracks of the 14 day disk is denser than that of the 7 day sample and presents the needle cluster structure. This indicates that the layer is thick and cracked, which means that it may have pits underneath[45].
[image:13.596.168.425.333.530.2]Fig. 8 presents a micrograph of the corrosion layer on the worn tracks of the disk after 49 days of immersion in 3.5% NaCl solution. It can be seen that the corrosion product on the worn tracks of this disk is denser than that of the 7 day and 14 day samples and presents a fine needle cluster structure. Shen et al. [17] described the corrosion behaviour of modified EH40 steel in a low-temperature (0 ºC) 3.5 wt.% NaCl solution over a 56-day period. The compact and thick corrosion product film covered the steel surfaces that protected the steel from further corrosion, and a characteristic uniform corrosion was present in the steel.
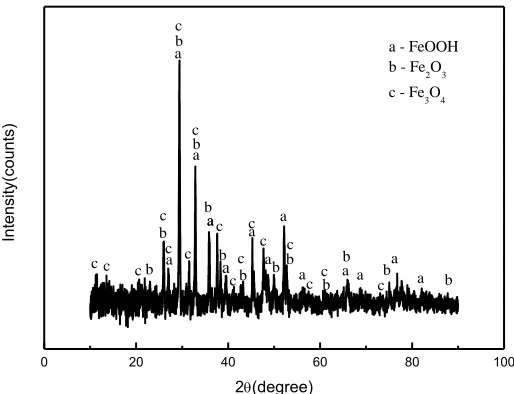
Figure 9. XRD of the disk surface corrosion layer of the worn track after 30 days immersion in 3.5% NaCl solution.
Fig. 9 presents the XRD results of the corrosion layer on the worn track immersed in 3.5% NaCl solution after 30 days. The corrosion products formed on the samples are a series of complex reaction products of FeOOH, Fe2O3, and Fe3O4, as shown in Fig. 9.
Fig. 10 shows that the corrosion product film is mainly composed of Fe, C and O elements. Among them, due to the loose and weak film structure of the corrosion products, part of the Fe matrix components are included in the scanning process, so a strong Fe peak appears in the EDS spectrum.
c c
c
c c
c c c c c c c c c c c c b b b b b b b b b b b b b a a a a a a a
a a a
a a
a a
a - FeOOH
b - Fe2O3
c - Fe3O4
0 20 40 60 80 100
In te nsi ty(co un ts)
Figure 10. EDS of the corrosion products on the worn track: (a) 60 min, (b) 120 min, and (c) 240 min(the samples were obtained after the wear test under different sliding times with 100 N loads, a 200 rpm sliding rate, and immersion in 3.5% NaCl solution for 14 days).
4. CONCLUSIONS
[image:14.596.49.544.71.590.2]
meanwhile, the micro-voids and isolated pits indicate that surface fatigue plays a great role in the wear of disks.
(2) It can be seen from the electrochemical test results of the corrosion that the corrosion product film of the experimental steel fails to better inhibit the corrosion of the matrix than the matrix itself. The results show that the corrosion of steel in a 3.5% NaCl solution is serious and that the protective effect of the corrosion product film is not obvious. At the same time, the interaction between wear and corrosion accelerates the corrosion and improves the electrochemical corrosion rate of the experimental steel.
(3) The results of the SEM, EDS and XRD analyses show that there are three main corrosion products of the experimental steel in 3.5% NaCl solution, namely, FeOOH, Fe2O3, and Fe3O4. With an extension of corrosion time, the film structure of the corrosion products changes from loose to dense.
ACKNOWLEDGEMENTS
The authors are very thankful for financial support from the Natural Science Foundation of China (NSFC; 1. No. 51474127: Influence of the size effect on the deformation behavior of profile and flexible rolling at the micro scale, 2. No. 51671100: Preparation of composite micro drill material and micro extrusion forming mechanism) and the State Key Laboratory of the Metal Material for Marine Equipment and Application-School of Material and Metallurgy, University of Science and Technology Liaoning co-project (No. SKLMEA-USTL 2017010 and SKLMEA-USTLN 201905).
References
1. G. D. Wang, Marine Engineering Steel Materials, Chemical Industry Press, (2017) Bei Jing, China. 2. L. Zhou, Strategic Advisory Report on the Development of Marine Engineering Materials in China,
Chemical Industry Press, (2014) Bei Jing, China.
3. P. Henry, J. Takadoum and P. Berçot, Corros. Sci., 51(2009)1308. 4. S. Mischler, Tribol. Int., 41(2008)573.
5. M. Morcillo, I. Díaz and B. Chico, Corros. Sci., 83(2014)6.
6. X. G. Li, Corrosion Behaviors and Mechanisms of Marine Engineering Materials, Chemical Industry Press, (2017) Bei Jing, China.
7. L. T. Xia, L. C. Wang and G. Q. Huang, Chinese China Foundry Machine & Technology, 2002(6)1. 8. J. Wang, J. Meng, X. Tang and W. Zhang, Chinese Journal of Chinese Soci. for Corros. and
Protection, 27(2007)1.
9. H. Y. Yang and G. Q. Huang, Chinese Corros. & Protection., 35(2014)576. 10.K. AL-Muhanna and K. Habib, Desalination, 250(2010)404.
11.L. Quej-Aké, A. Contreras and J. Aburto, Int. J. Electrochem. Sci., 10(2015) 1809. 12.Y. Gao, Y. H. Sun and L. J. Sun, Chinese Corrosion & Protection, 39(2018) 327. 13.R. E. Melchers, Corros. Sci., 81(2014)110.
14.A. Toloei, S. Atashin and M. Pakshir, Corrosion. Reviews, 31(2013)135.
15.S. Y. Zhang, X. Y. Cheng, L. C. Su and C. W. Jiang, Int. J. Electrochem. Sci., 12(2017)2453. 16.Y. Zou, J. Wang, Y. Y. Zheng, Corros. Sci., 53(2011)208.
17.Y. Y. Shen, Y. H. Dong, H. D. Li, X. T. Chang, D. S. Wang, Q. H. Li and Y. S. Yin, Int. J. Electrochem. Sci., 13(2018)6310.
18.R. E. Melchers and R. Jeffrey, Corros. Sci., 47(2005)1678.
Francis, 1(2015)589.
20.M. Panayotova, Y. Garbatov and C. Guedes Soares, Proceedings of the 7th International Conference on Marine Science and Technology (Black Sea 2004), Union of Scientists of Varna, (2014) Varna, Bulgaria.
21.S. Mischler, Tribol. Int., 41(2008)573.
22.A. Iwabuchi, J. W. Lee and M. Uchidate, Wear, 263(2007)492. 23.A. Iwabuchi, T. Tsukamoto and Y. Tatsuyanagi, Wear, 156(1992)301. 24.D. Lopez, N. A. Falleiros and A. P. Tschiptschin, Tribol. Int., 44(2011)610.
25.D. F. Moore, The Wear of Non-Metallic Materials Mechanical Engineering Publ., (1978) London, England.
26.S. W. Watson, F. J. Friedersdorf and B. W. Madsen, Wear, 181(1995)476. 27.S. Akonko, D. Y. Li and M. M. Ziomek, Tribol. Letter, 18(2005)405.
28.N. Papageorgiou, A. vonBonin and N. Espallargas, Tribol. Int., 73(2014)177. 29.I. Serre, N. Celati and R. M. Pradeilles Duval, Wear, 252(2002)711.
30.X. Zhang, S. W. Yang and W. H. Zhang, Corros. Sci., 82(2014)165. 31.M. R. Bateni, J. A. Szpunar, X .Wang and D.Y. Li, Wear, 260 (2006)116. 32.T. Balusamy and T. Nishimura, Electrochim. Acta, 199(2016)305.
33.J. H. Huang, Z. G. Li and Y. H. Qian, China Shanghai Metals, 28(2006)6.
34.34 H. Wu, J. W. Zhao, X. W. Cheng, W. Z. Xia, A. S. He, J. H. Yun, S. Q. Huang, L. Z. Wang, H. Huang, S. H. Jiao, Z. Y. Jiang, Tribol. Int., 117 (2018) 24.
35.L. C. Chen, P. Zhang, Q. Y. Xiong, P. Zhao, J. P. Xiong, Y. Zhou, Int. J. Electrochem. Sci., 14 (2019) 919.
36.M. A. Deyab, J. Taiwan. Inst. Chem. Eng., 58 (2015) 536.
37.S. S. Chen, Ambrish Singh, Yuanluqi Wang, W. Liu, K. H. Deng, Y. H. Lin, Int. J. Electrochem. Sci., 12 (2017) 782.
38.El-Sayed M. Sherif, Abdulhakim A. Almajid, Int. J. Electrochem. Sci., 10 (2015) 34. 39.Asiful H. Seikh and El-Sayed M. Sherif, Int. J. Electrochem. Sci., 10 (2015) 895. 40.Z. Y. Yong, J. Zhu, C. Qiu and Y.L. Liu, Applied Surface Science, 255 (2008) 1672. 41.Y. Zhou, Q. Y. Xiong, J. P. Xiong, Int. J. Electrochem. Sci., 10 (2015) 2812. 42.T. Nickchi, A. Alfantazi, Electrochim. Acta 58 (2011)743.
43.H. X. Guo, B.T. Lu, J.L. Luo, Electrochem. Acta 51 (2005) 315.
44.Z. M. Gao, Changye Wang, Yangyang Liu, Int. J. Electrochem. Sci., 10 (2015) 6487. 45.El-Sayed M. Sherif and Magdy M. El Rayes, Int. J. Electrochem. Sci., 10 (2015) 7493.