Int. J. Electrochem. Sci., 14 (2019) 10693 – 10706, doi: 10.20964/2019.11.04
International Journal of
ELECTROCHEMICAL
SCIENCE
www.electrochemsci.org
Corrosion Behavior of P110 Casing Steel in Concrete Exposed
to Simulated CO2-Containing Formation Water at 80 °C
Xingguo Zhang1,2, Bensong Wu1,3, Jiaji Zhang3, Jingxue Li3, Shuliang Wang1,3,4,*, Lijin Dong1,3, Li Liu1,3, Dinghan Xiang4
1 State Key Laboratory of Oil and Gas Reservoir Geology and Exploitation, Southwest Petroleum
University, Chengdu 610500, P.R. China
2 School of Petroleum Engineering, Southwest Petroleum University, Chengdu 610500, P.R. China 3 School of Materials Science and Engineering, Southwest Petroleum University, Chengdu 610500, P.R. China
4 Guangxi Key Laboratory of Information Materials, Guilin University of Electronic Technology, Guilin 541004, Guangxi, China
*E-mail: [email protected]
Received: 27 May 2019 / Accepted: 10 August 2019 / Published: 7 October 2019
Saturated brine cement slurry is widely used to solve the cementing problem in salt–gypsum layers, and the cement and its first interface play a key role in the integrity of oil wells. In this paper, the electrochemical properties, mechanical properties, and microstructure of a saturated brine cement/casing system were studied in simulated formation water containing saturated CO2 at 80 °C for 10–60 days. The results show that the cement and its first interface were affected by the cement hydration and corrosion due to the CO2 and Cl-, resulting in an initial increase and then a subsequent decrease in the performance of the cement matrix and interface transition zone. With an increase in the immersion time, the microstructure of the cement matrix first became dense and then gradually became loose and porous. The casing steel was corroded by Cl- and CO2. At the same time, the CO2 permeation was faster than the reaction step with the cement matrix, and the first interface was destabilized before the cement stone was severely corroded.
Keywords: Saturated brine cement; CO2 corrosion; Electrochemistry; Interface; Casing 1. INTRODUCTION
humidity greater than 50%) and pressure conditions, thereby leading to accidents, such as gas channeling and casing corrosion failure [3-5]. Compared with those of other cements, saturated brine cement stone contains higher contents of Cl- and other aggressive anions, thereby causing increased severe corrosion of the casing steel.
At present, some reports have been conducted on the CO2 corrosion of cement [6-10] and casing steel [11-15]. However, the problem of weakening and instability of the saturated brine cement/casing interface caused by corrosion is hardly involved in these reports. To better simulate the actual service state that is present underground, cement stone/casing steel was considered as a whole system under a CO2 environment in the present work because it can reveal the instability phenomena at the cement/casing interface.
2. EXPERIMENTAL METHODS
2.1 Sample preparation
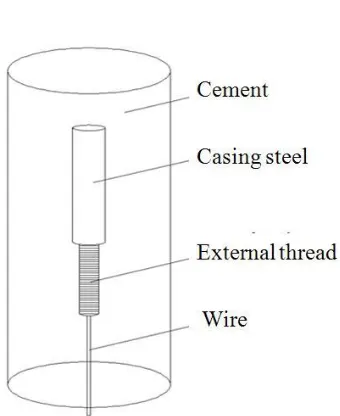
P110 casing steel and Aksu G-grade cement were used as raw materials. LunTai industrial salt, HX-21 dispersant, and a Flok-2 anti-gas channeling agent were also used. Table 1 shows the formulations of saturated brine cement slurry. The cement/casing system, in the form of a cement-coated casing steel, was prepared. The casing steel was 10 mm in diameter, the working end was 40 mm long, and the other end had an external thread. With the addition of an antifoaming agent, the cement slurry was poured into a mold after being stirred at high speed and then solidified at 80 °C for 24 hours. A cement column with a diameter of 50 mm and a height of 110 mm was prepared, and the P110 steel was kept in the center of the cement column. Fig. 1 shows a diagram of the sample.
Table 1. Formulation of saturated brine cement slurry (g).
Cement Water Salt Ganister sand Microsilicon Dispersant Anti-gas channeling agent
520 222 37.8 130 26 30.72 10.14
[image:2.596.209.379.538.746.2]2.2 Experimental conditions
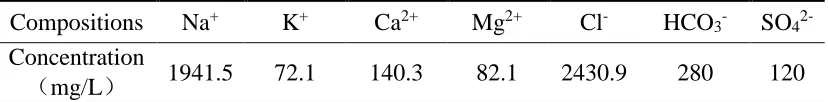
[image:3.596.93.507.239.290.2]The cement/casing samples were demolded after curing and immersed in simulated formation water containing saturated CO2 at 80 °C for 10–60 days. The corrosion mechanism of continuous immersion was adopted. The cylindrical side of the test piece was a corrosion surface, and the corrosion area on the side of the casing steel was 12.56 cm2. Table 2 shows the composition of the simulated formation aqueous solution.
Table 2. Formula of the simulated formation aqueous solution.
Compositions Na+ K+ Ca2+ Mg2+ Cl- HCO3- SO4 2-Concentration
(mg/L) 1941.5 72.1 140.3 82.1 2430.9 280 120
2.3 Electrochemical test
A three-electrode system composed of a working electrode (cement/casing sample), auxiliary electrode (platinum electrode), and reference electrode (saturated calomel electrode) was prepared to test the electrochemical behavior of the sample immersed in the simulated formation water at 80 °C. With the use of a PGSTAT302N Autolab electrochemical workstation, the impedance spectrum was measured using a frequency range of 10-2–105 kHz and a sine wave with a potential amplitude of 10 mV.
2.4 Mechanical property test
The threaded portion of the sample was exposed and connected by a special fixture, and the cement ring was connected by a sleeve. The shear stress of the interface between the cement and the casing was tested by a pull-out method on a material mechanical testing machine, and the maximum tensile stress was recorded. The tensile stress was converted into the interfacial shear strength to evaluate the cementation strength of the interface.
The cement stone was transversely cut and used after being ground and polished. With the use of a microscopic Vickers hardness tester, the microhardness of the cement ring matrix and the area near the interface (the interface transition zone) was measured with a test load of 300 gf and a load time of 10 s.
Compressive strength testing was conducted on the cement stone using a compression testing machine, and the maximum compressive stress before the cracking of the cement stone was recorded. Then, the compressive strength was calculated by measuring the cross-sectional area of the test sample. 2.5 Microscopic morphology test
degree of the casing steel and cement stone was evaluated with an acceleration voltage of 20 kV. Elemental analysis of the cement/casing system was conducted with energy-dispersive spectroscopy (EDS).
2.6 Analysis of the corrosion product
The composition of the corrosion product was measured by X-ray photoelectron spectroscopy (XPS) and Raman spectroscopy. The efficiency voltage and energy voltage during XPS analysis were both 12 kV, and the vacuum degree during sputtering was 2.0×10⁻⁷ mbar. The Raman spectrum was measured in the range of 200 cm-1 to 2000 cm-1, and the step size was 2 cm-1.
3. RESULTS AND DISCUSSION
3.1 Electrochemical impedance spectroscopy
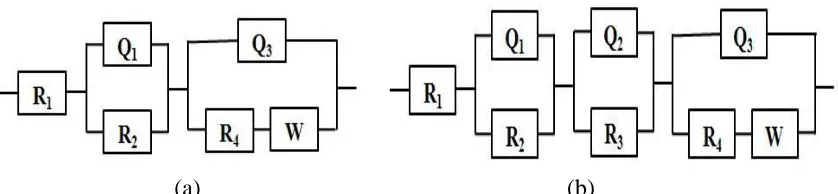
Fig. 2 shows the Nyquist plots and high-frequency region (HFR) enlargement of the cement/casing system with different immersion times. The low-frequency (LF) capacitive arc is generally considered to reveal the electrochemical characteristics of the passivation film on the steel-cement interface, while the high-frequency (HF) capacitive arc character indicates a change in the microstructure of the cement stone [16, 17]. Fig. 2 shows that the LF region of the Nyquist plots is a large arc close to a straight line when the sample was immersed for 10 days, thereby indicating that the casing steel is in a passivated state [18]. Starting at 20 days, the LF zone capacitive arc begins to shrink, and the HF zone capacitive arc diameter increases first and then decreases with an increase in the immersion time. Fig. 3 shows the equivalent circuit model [19-21] for the corrosion system, where R1 is the solution resistance, R2 is the cement layer resistance, R3 is the charge transfer resistance of the steel dissolution process caused by the etch pit, and R4 is the transfer resistance of the double electric layer on the surface of casing steel, which is equivalent to the polarization resistance during the DC measurement.
A straight line near 45° in the LF region is found in the Nyquist plots with an immersion time of 50 days, which shows diffusion characteristics of the Warburg impedance, thereby indicating that the corrosion control step of the casing steel changes to diffusion process control at the beginning of the 50th day. This phenomenon occurs because the fluidity and migration ability of the medium in the cement stone are far less than that in the solution. Therefore, the corrosion products generated on the casing steel cannot be transported to the external environment in time, which makes the diffusion and transmission of corrosion products on the casing surface the control step [24, 25].
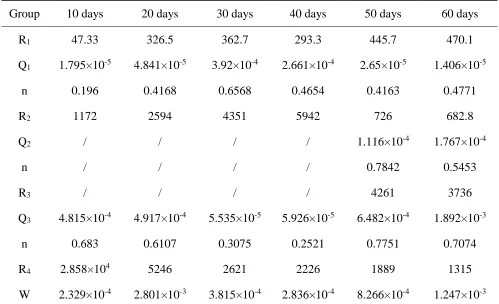
Table 3. Impedance spectrum parameters of saturated brine cement/casing system.
Group 10 days 20 days 30 days 40 days 50 days 60 days
R1 47.33 326.5 362.7 293.3 445.7 470.1
Q1 1.795×10⁻⁵ 4.841×10⁻⁵ 3.92×10⁻⁴ 2.661×10⁻⁴ 2.65×10⁻⁵ 1.406×10⁻⁵
n 0.196 0.4168 0.6568 0.4654 0.4163 0.4771
R2 1172 2594 4351 5942 726 682.8
Q2 / / / / 1.116×10⁻⁴ 1.767×10⁻⁴
n / / / / 0.7842 0.5453
R3 / / / / 4261 3736
Q3 4.815×10⁻⁴ 4.917×10⁻⁴ 5.535×10⁻⁵ 5.926×10⁻⁵ 6.482×10⁻⁴ 1.892×10⁻³
n 0.683 0.6107 0.3075 0.2521 0.7751 0.7074
R4 2.858×10⁴ 5246 2621 2226 1889 1315
W 2.329×10⁻⁴ 2.801×10⁻³ 3.815×10⁻⁴ 2.836×10⁻⁴ 8.266×10⁻⁴ 1.247×10⁻³ (Note units of R-Ω, Q-S·secn/cm2, and W-S·sec0.5/cm2)
Figure 2. Nyquist plots of the sample under different immersion corrosion times: (a) Nyquist plots and (b) HFR enlargement.
[image:5.596.49.548.235.539.2](a) (b)
Figure 3. Equivalent circuit used for fitting the impedance data: (a) uncorroded and (b) corroded to a certain extent.
3.2 Mechanical properties 3.2.1 Shear strength
Fig. 4 shows the change in the interfacial shear strength of the cement/casing samples after the development of immersion corrosion at different times in the simulated formation water containing saturated CO2. Fig. 4 shows that during the immersion process, the interfacial shear strength between the cement and casing gradually increases during the first 40 days, which indicates that the interface was not seriously damaged by aggressive substances, such as Cl- and CO2, during the 40-day immersion time, but the bonding force between the cement and casing gradually increases as the cement hydration progresses [26]. From the 50th day onwards, the interfacial shear strength values decrease, indicating that the corrosive substances Cl- and CO2 played a major role in the interface erosion, which weakens the cementation ability between the cement and casing. Electrochemical tests show that the interface is affected by corrosive media at the beginning of the 20th day of immersion time, and the erosion begins at the local pores and then gradually extends to the entire interface. After 40 days, the cementation strength of the interface begins to drop sharply.
Figure 4. Diagram of the cement/casing system shear strength change.
3.2.2 Cement microhardness
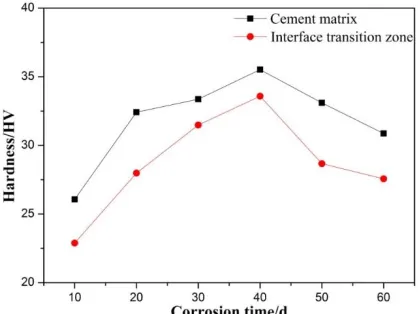
[image:6.596.193.404.500.660.2]present work analyzed the microhardness of the interface transition zone and the cement matrix area. Fig. 5 illustrates the microhardness with different immersion times. The microhardness of cement stone first increases and then decreases with increasing immersion time, and the hardness of the interface transition zone becomes lower than that of the cement matrix. According to the hydration characteristics of G-grade oil well cement, the hydration degree of the cement can be as high as 80% at 28 days of hydration, and then the hydration speed decreases, which has a weak influence on the hardness of the cement stone. Therefore, the microhardness of the cement stone increases rapidly in the first 30 days, and the hardness reaches its maximum at 40 days. Subsequently, the corrosion effect of CO2 is dominant. Thus, the hardness of cement stone begins to decrease on the 50th day. The microhardness of the interface transition zone is lower than that of the cement matrix because the hydration degree of the cement in the interface transition zone is lower than that of the matrix during the early stage. At the late stage of corrosion, owing to the CO2 penetrating into the interior of the cement and accumulating in the interface transition zone, the corrosion in the interface transition zone is more substantial than in the cement matrix, leading to a decreased hardness of the interface transition zone.
Figure 5. Variation of microhardness of cement stone with time.
3.2.3 Compressive strength
[image:7.596.193.402.326.483.2]Figure 6. Change in the compressive strength of the cement stone with time.
3.3 Microscopic morphology
[image:8.596.193.402.71.232.2]3.3.1 Micromorphology of cement stone
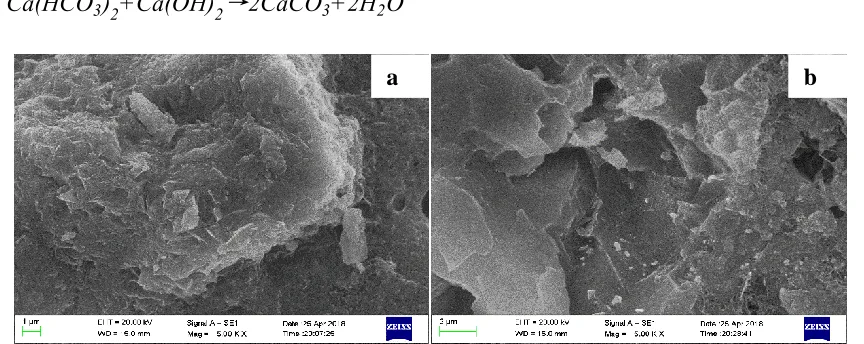
Fig. 7 illustrates the cross-sectional microstructure of cement stones with different immersion times. Given the low concentration of CO2 in the early stage, the bonded CaCO3 (as shown in Fig. 7[d]) is gradually formed, thereby preventing the diffusion of CO2. The chemical reaction mechanism is shown in Formula (1). As the infiltrated CO2 concentration increases, the pH value and the stability of C-S-H and ettringite decrease. The microstructure of the outer layer of the cement ring starts to produce pores on the 50th day, and the pores become evident on the 60th day. Reactions (2)-(4) proceed quickly and destroy the effectiveness of the cement [30].
Ca(OH)2+H++HCO3- CaCO3+2H2O (1)
CSH+H+ + HCO3- CaCO3+SiO2+ H2O (2)
CO2+ H2O + CaCO3 → Ca(HCO3)2 (3)
Ca(HCO3)2+Ca(OH)2→2CaCO3+2H2O (4)
[image:8.596.83.515.520.692.2]
Figure 7. Microstructure of different sites in the cement at different times: (a) 10 days, interface transition zone; (b) 10 days, cement exterior; (c) 30 days interface transition zone; (d) 30 days, cement exterior; (e) 50 days, interface transition zone; (f) 50 days, cement exterior; (g) 60 days, interface transition zone; and (h) 60 days, cement exterior.
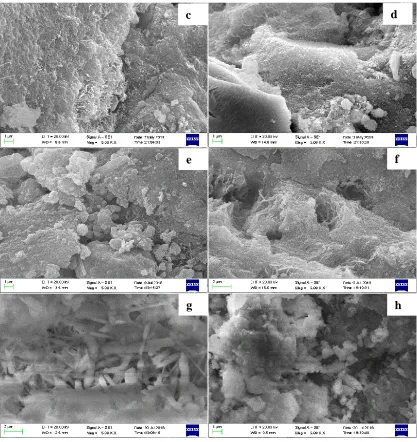
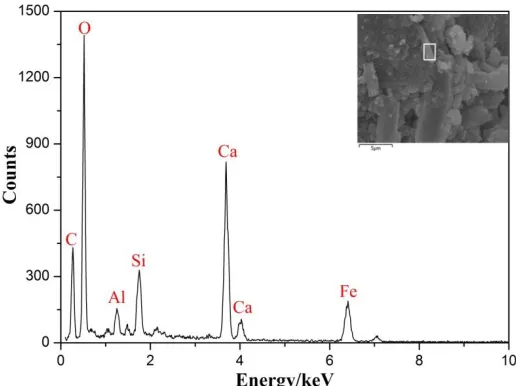
As shown in Fig. 7, a strip-like material begins to appear in the interfacial transition zone on the 50th day and was analyzed by EDS, and the composition data is shown in Fig. 8 and Table 4. Based on the atomic ratio calculation and the description of the literature [31], CaCO3 is considered to be main component of the material. The results indicate that CO2 penetrates into the interface and carbonizes with the cement in this microregion, which affects the overall performance of the interface, thereby causing the strength of the interface cementation to begin decreasing.
c d
g h
[image:9.596.90.507.68.510.2]Figure 8. EDS analysis of strip-like features in the interface transition zone.
Table 4. EDS results of cement internal strip material.
Element C O Ca Fe Si Al
wt. % 8.71 38.53 32.06 10.43 6.73 3.54 at. % 16.72 55.07 17.96 3.42 5.53 2.30
3.3.2 Micromorphology of casing steel
SEM was used to observe the casing steels removed from the cement/casing system with immersion times of 10 and 60 days, and the results are pictured in Fig. 9. A flat and crack-free passivation film appears on the surface of casing steel when the casing steel is uncorroded. The surface of the film has longitudinal scratches and a small amount of cement particles that remained after the drawing process. Fig. 9(b) shows that an uneven film layer containing a number of cracks exists on the surface of the casing steel after being corroded and has no protective effect on the casing steel.
Figure 9. SEM micrographs of casing steel after different immersion corrosion times: (a) 10 days and (b) 60 days.
[image:10.596.97.496.324.371.2] [image:10.596.99.501.571.718.2]3.4 Analysis of the corrosion products of the casing steel
Fig. 10 shows the EDS analysis of the corrosion products on the casing surface with immersion time of 60 days. Table 5 lists the element content of the corrosion products. The corrosion products mainly consist of Fe, C, and O and contain a small amount of Ca and Cl.
Table 5. Content of elements on the casing steel surface after corrosion.
Element Fe C O Ca Cl
wt. % 69.5 3.41 22.13 2.84 2.12 at. % 41.9 9.22 44.36 2.45 2.07
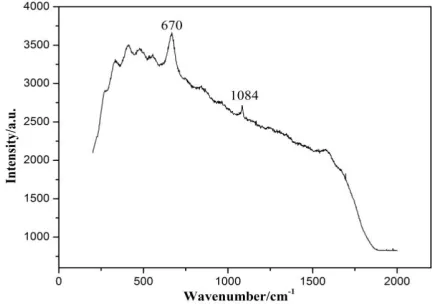
Fig. 11 illustrates the Raman spectrum of corrosion products on the casing surface. According to the analysis, the Raman characteristic peaks of 670 and 1084 cm-1 are obtained from the corrosion product, which correspond to Fe3O4 and Fe(CO3)2 [32,33], respectively, thereby indicating that Fe3O4 and Fe(CO3)2 forms during the corrosion process of the casing steel.
[image:11.596.95.501.193.241.2]Figure 10. EDS of casing steel at an immersion time of 60 days.
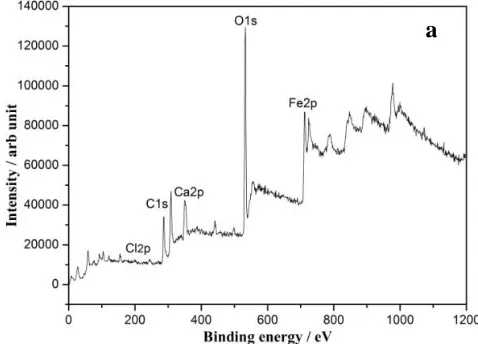
[image:11.596.185.410.357.528.2] [image:11.596.189.405.586.739.2]Fig. 12 presents the XPS analysis of the corrosion products on the casing steel, including the full spectrum and the fitting diagram of Fe and O peaks. The full spectrum clearly shows that the corrosion products are composed of five elements: O, Fe, C, Cl, and Ca. The XPS spectrum of O was divided by using partial peak fitting into three peaks of 530.6, 531.4, and 531.6 eV, which correspond to O2-, CO3 2-, and OH-, respectively [34]. The XPS spectrum of Fe was divided into three peaks with binding energies corresponding to 709.2, 710.2, and 711.0 eV. According to the literature [35, 36], 709.2 eV corresponds to Fe2+, 710.2 eV corresponds to FeCl2, and 711.0 eV corresponds to Fe3+.
Based on the above analysis, the surface corrosion products of casing steel can be speculated to be mainly composed of FeCO3, Fe3O4 and a small amount of Fe(OH)2. FeCl2 is an intermediate product that forms during the catalytic corrosion of steel by Cl-. In addition, a small amount of CaCO3 particles are observed on the surface of the casing steel. Therefore, the casing steel in the saturated brine cement/casing system is mainly corroded by Cl- and CO2 in the simulated formation water. The corrosion mechanism is shown in Formulas (5)-(14).
CO2 corrosion mechanism [37]:
(5)
(6)
H2CO3→ 2H++CO3 (7)
(8)
(9)
General equation: (10)
Corrosion mechanism of Cl- pair steel [38, 39]: Fe → Fe2++2e (11)
2Cl-+Fe2+ → FeCl2 (12)
FeCl2+2H2O → Fe(OH)2+2Cl-+2H+ (13)
6FeCl2+O2+6H2O → 2Fe3O4+12Cl-+12H+ (14) 2(g) 2(aq)
CO CO
2(aq) 2 2 3
CO H OH CO
2 2
2HFeFe H
2 2
3 3
Fe CO FeCO
2 2 3 2
CO H O Fe FeCO H
Figure 12. XPS spectrum of corrosion products on the casing steel: (a) full spectrum, (b) fitting diagram of O peaks, and (c) fitting diagram Fe of peaks.
4. CONCLUSION
The saturated brine cement/casing system was immersed and corroded in simulated formation water containing saturated with CO2 at 80 °C. The electrochemical properties, mechanical properties, corrosion products, and microstructure evolution were analyzed. The following conclusions were drawn: (1) The impedance results show that the protective effect of the cement stone on the casing steel first strengthens and then weakens it. The casing steel is in a passivated state on the 10th day, and then the passivation is gradually broken, leading to the corrosion of the casing steel. Both the cement matrix and the interface transition zone begin to degrade on the 50th day, thereby indicating that the CO2 penetrates faster than during the reaction step with the cement, and the interface starts to destabilize, while the cement stone is not seriously corroded.
(2) Based on the interface sheer strength, microhardness and compressive strength, the degradation rule of the cement matrix and the interface transition zone is concluded to be the same. Moreover, the corrosive medium first acts in the local area of the pores and then extends to most of the area, thereby causing the properties of the interface to begin to decrease.
(3) The saturated brine cement is affected by hydration and corrosion in the simulated formation water containing saturated CO2. As a result, the cement performance and interface stability first increase and then decrease. When the cement is corroded by CO2, its structure initially becomes dense. As the infiltration of CO2 accumulates, the pH decreases, and the corrosion reaction accelerates, thereby making the cement structure porous again.
(4) During the immersion corrosion process, the casing steel is corroded by Cl- and CO2, and the main corrosion products are FeCO3, Fe3O4, and a small amount of Fe(OH)2.
ACKNOWLEDGEMENTS
This work was supported by This work was financially supported by the China Scholarship Council (CSC), and Guangxi Key Laboratory of Information Materials (Guilin University of Electronic Technology), P.R. China (Project No. 191009-K).
References
1. C. T. Zhang, Drill. & Prod. Technol., 31 (2008) 146.
2. X. C. Li, K. Li, R. Liu, S. Hang, T. Gu, X. G. Zhang and X. Y. Guo, Nat. Gas. Ind., 36 (2016) 102. 3. N. B. Milestone, T. Sugama and L. E. Kukacka, Cem. Concr. Res., 17 (1987) 295.
4. M. Wigand, J. P. Kaszuba, J. W. Carey and W. K. Hollis, Chem. Geol., 256 (2009) 122.
5. B. G. Kutchko, B. R. Strazisar, D. A. Dzombak, G. V. Lowry and N. Thaulow, Environ. Sci. Technol., 41 (2007) 87.
6. J. Y Jiang, Q. Zheng, D. S. Hou, Y. R Yan and H. Chen, Phys. Chem. Chem. Phys., 20 (2018) 20. 7. V. Barlet-Gouédard, G. Rimmelé and B. Goffé, Oil & Gas Sci. Technol., 62 (2007) 325.
8. Z. G. Peng, J. Zhang, Q. Feng and Y. Zheng, Acta. Petrol. Sin.,39 (2018) 703. 9. J. F. Zhang, M. Xu, J. J. Zhu and G. L. Wang, J. Chin. Ceram. Soci., 35 (2007) 1651. 10. Y. H. Lin, D. J. Zhu, D. Z. Zeng and Y. G. Yang, Corros. Sci., 74 (2013) 13.
11. M. Hany, M. Vagif and I. Leylufer, Chem. J., 2 (2012) 12.
12. M. Mahlobo, K. Premlall, P. Olubambi, IOP Conf. Ser.: Mater. Sci. Eng., 272 (2017) 12032. 13. A. B. Forero, M. G. Núñez, I. S. Bott , Mater. Res., 17 (2014) 461.
14. S. L. Wang, L. Wang, X. G. Liu and L. Liu, Int. J. Electrochem. Sci., 12 (2017) 10317. 15. T. Xie, Surf. Technol., 46 (2017) 211.
16. J. Shi, W. Sun, J. Ming , Proc. Eng., 27 (2012) 412.
17. X. B. Zuo, L. F. Qiu, Y. J. Tang ang Y. X. Feng, J. Build. Mater., 20 (2017) 352. 18. G. Qiao and J. Ou, Electrochem. Acta., 52 (2007) 8008.
19. M. F. Montemor, M. P. Cunha and M. P. Ferreira, Cem. Concr. Compos., 24 (2002) 45. 20. M. Criadoa, I. Sobrados, J. M. Bastidas and J. Sanz, Prog. Org. Coat., 99 (2016) 11. 21. R. G. Hu, R. S. Huang and C. J. Lin, Acta. Phys-chim. Sin., 19 (2003) 46.
22. M. Otieno, H. Beushausen and M. Alexander, Cem. Concr. Compos., 46 (2014) 56. 23. C. Sun, J. Chen, J. Zhu, M. Zhang and J. Ye, Constr. Build. Mater., 39 (2013) 39.
24. J. X. Zhang, B. Yi, D. Y. Lin, Y. X. Chen and L. W. Dai, J. Build. Mater., 19 (2016) 390. 25. Y. H. Wu, S. X. Luo, Y. Y. Fu, Y. Xiao and C Sun, Surf. Technol., 40 (2011) 65.
26. C. Q. Ren, Y. Peng, B. Li, S. L. Wang and T. H. Shi, High Temp. Mater. Proc., 35 (2016) 821. 27. Z. J. Yang, P. Y. Luo, Oil. Drill & Prod. Technol., 24 (2002) 4.
28. Z. J. Yang, M. G. Li, J. H. Guo, P. Y. Yan and J. Qin, Oil. Drill & Prod. Technol., 2 (2002) 1. 29. J. W. Carey, W. Mareus and J. C. Steve, Int. J. Greenh. Gas. Con., 1 (2007) 75.
30. H. Abdoulghafour, L. Luquot and P. Gouze, Environ. Sci. Technol., 47 (2013) 10332. 31. J. F. Zhang, M. Xu and J. J. Zhu, J. Chin. Ceram. Soci., 35 (2007) 1651.
32. L. Wei, X. Pang, K. Gao, Corros. Sci., 103 (2016) 132.
33. A. Sumoondur, S. Shaw, I. Ahmed, Mineral. Mag., 72 (2008) 201.
34. G. F. Lin, M. S. Zhen, Z. Q. Bai and X. W. Zhao, Mater & Tes., 41 (2005) 1875. 35. X. Zhou , H. Yang, F. Wang. Corros. Sci., 54 (2012) 193.
36. T. Xie, H. Lin J. Xu, Surf. Technol., 46 (2007) 211.
37. J. Han, J. Zhang, J. W. Carey, Int. J. Greenh. Gas. Con., 5 (2011) 1680. 38. K. Thangavel, N. S. Rengaswamy, Cem. Concr. Compos., 20 (1998) 283.
39. R. D. Moser, P.M. Singh, L. F. Kahn and K. E. Kurtis, Corros. Sci., 57 (2012) 241.