White Rose Research Online URL for this paper:
http://eprints.whiterose.ac.uk/145438/
Version: Accepted Version
Proceedings Paper:
Ciravegna, F. orcid.org/0000-0001-5817-4810, Gao, J., Ireson, N. et al. (3 more authors)
(2019) Active 10: Brisk walking to support regular physical activity. In: Proceedings of 13th
EAI International Conference on Pervasive Computing Technologies for Healthcare.
PervasiveHealth 2019, 20-23 May 2019, Trento, Italy. ACM , pp. 11-20. ISBN
978-1-4503-6126-2
https://doi.org/10.1145/3329189.3329208
© 2019 The Authors. This is an author-produced version of a paper subsequently
published in Proceedings of the 13th EAI International Conference on Pervasive
Computing Technologies for Healthcare. Uploaded in accordance with the publisher's
self-archiving policy.
[email protected]
Reuse
Items deposited in White Rose Research Online are protected by copyright, with all rights reserved unless
indicated otherwise. They may be downloaded and/or printed for private study, or other acts as permitted by
national copyright laws. The publisher or other rights holders may allow further reproduction and re-use of
the full text version. This is indicated by the licence information on the White Rose Research Online record
for the item.
Takedown
If you consider content in White Rose Research Online to be in breach of UK law, please notify us by
Active 10: Brisk Walking to Support Regular
Physical Activity *
Fabio Ciravegna
University of Sheffield
Department of Computer Science
211 Portobello, Sheffield
United Kingdom
[email protected]
Jie Gao
University of Sheffield
Department of Computer Science
211 Portobello, Sheffield
United Kingdom
j.gao@sheffield.ac.uk
Neil Ireson
University of Sheffield
Department of Computer Science
211 Portobello, Sheffield
United Kingdom
n.ireson@sheffield.ac.uk
Robert Copeland
Sheffield Hallam University
Advanced Wellbeing Research Centre
and National Centre for Sport and
Exercise Medicine
Sheffield
[email protected]
Joe Walsh
Knowledge Now
Sheffield
United Kingdom
[email protected]
Vitaveska Lanfranchi
University of Sheffield
Department of Computer Science
211 Portobello, Sheffield
United Kingdom
v.lanfranchi@sheffield.ac.uk
ABSTRACT
This paper describes a methodology and a technology supporting an intervention carried out by Public Health England (PHE) to encourage people who are physically inactive (doing less than 30 minutesÕ physical activity per week) to initiate regular physical activity via 10 minutes of daily brisk walking. The main idea behind the intervention is to encourage the inclusion of short bouts of continuous brisk walking in everyday activities such as shopping or commuting. To this extent a behaviour change mobile application, Active 10, was developed and distributed freely on the Android and iOS app stores. The app has been downloaded over 620,000 times and the associated large scale server infrastructure has collected nearly a billion data points between March 2017 and January 2019. The paper describes the rationale for Active 10, the digital application supporting the intervention, the data architecture and the data collection approach. Then we discuss the complexity of developing a health tracking technology with a large number of users, producing a significant volume of data. Finally, we describe a preliminary data analysis, focussing on a cohort of 129,010 users who used the app for over 8 weeks: 73% of these users achieved less than ten minutes of brisk walking per day during the first week; by the end of the 8th week this subset of users showed, on average, a 10-fold increase in their brisk walking. The most inactive section of the cohort, the 54% of users who showed virtually no brisk walking activity during week 1, seems to achieve the greatest proportional increase, and by the end of week 8 they appear to meet, on average, the guideline of 10 minutes of continuous brisk walking per day. The increase is more evident within the 15% of the cohort who kept the app for over six
months: on average a 12% increase in average activity was observed in this group with no sign of decline.
CCS CONCEPTS
CCS → Information systems → Information systems applications → Mobile information processing systems CCS → Applied computing → Life and medical sciences → Consumer health
KEYWORDS
Wellbeing and lifestyle support, Digital interventions and health behaviour change
ACM Reference format:
F. Ciravegna, J. Gao, N. Ireson, R. Copeland, J. Walsh, and V. Lanfranchi. 2019. Proceedings Paper in PervasiveHealth2019. In Proceedings of 13th EAI International Conference on Pervasive Computing Technologies for Healthcare, May 2019 10 pages.DOI: 10.1145/123 4
1 INTRODUCTION
2
benefits of moderate intensity Regular Physical Activities (RPAs) in alleviating diseases such as cardiovascular conditions [3], risk of obesity, stroke, type 2 diabetes and mental health problems [4]. For these reasons, RPAs are considered a principal intervention by primary and secondary carers; national and international health organisations have put in place programmes for fostering widespread physical activity among the population. The World Health Organization (WHO) recommends that: (i) Adults aged 18Ð 64 should do at least 150 minutes of moderate-intensity aerobic physical activity throughout the week or do at least 75 minutes of vigorous-intensity aerobic physical activity (or an equivalent combination of moderate- and vigorous-intensity activity) (ii) Aerobic activity should be performed in bouts of at least 10 minutesÕ duration (iii) For additional health benefits, adults should increase their moderate-intensity aerobic physical activity to 300 minutes per week, or engage in 150 minutes of vigorous-intensity aerobic physical activity per week (or an equivalent combination of moderate- and vigorous-intensity activity) [2]. Among the different forms of RPAs, walking is the most common among adults. In England, changes in RPA can be observed from active sports training in the younger ages to mainly walking in older age groups. The 2012 Health Survey for England found that the RPA in younger adults was mostly done through sports (men: 53%, women: 43%), while walking was the most common source of activity at around 55 [5]. Recommendations for walking for health were initially popularised by the Japanese with the concept of achieving 10,000 steps/day via a marketing campaign for a pedometer linked to the 1964 Tokyo Olympic Games1; the target
was simple and tangible but did not include any requirement about either intensity or bout length. These are important components to meet the physical activity guidelines and achieve the required health outcomes [6]. The recommended 150 minutes a week, represents a challenging target for inactive individuals, i.e. the ones at higher risk. Public Health England identifies one in four adults in England as ÔinactiveÕ by virtue of doing less than 30 minutesÕ physical activity per week. For these individuals, evidence shows the following health benefits could be achieved from 10 minutes of brisk walking per day for 7 days: (i) increased physical fitness; (ii) greater ease of performance of everyday physical activities; (iii) improved mood; (iv) improved quality of life; (v) increased body leanness and healthier weight and (vi) 15% reduction in risk of early death. Conditions and risks factors where they expect benefits include: high blood pressure, diabetes, being over-weight or obese, mild to moderate depression or anxiety, musculoskeletal issues, such as lower back pain. To tackle inactivity at a population level, Public Health England, with support from some of the authors of this paper designed an intervention called Active 102. The goal of the programme is to
foster the adoption of the healthy habit of walking briskly for at least 10 minutes a day among the inactive population. Brisk walking is defined as 3 miles per hour (4.8km/h) [5]. The programme is supported by a self-monitoring app that helps users focus on achieving 10 minutes of brisk walking a day. The app
1
https://www.theguardian.com/lifeandstyle/2018/sep/03/watch-your-step-why-the-10000-daily-goal-is-built-on-bad-science
utilises a number of behaviour change techniques including goal setting, feedback and virtual rewards [17]. Active 10 is part of a wider public health campaign called ÔOne YouÕ, which intends to support individuals into healthier lifestyle choices, from moving more, to eating healthily; the tenet is that small, practical changes can be made that fit in with everyday life but have beneficial personal and societal impact. This paper describes the design, development and distribution of the Active 10 intervention, the server infrastructure collecting the data and the complexity of running a programme involving over 620,000 users in England over 1.5 years. It discusses the complexity of developing tracking for hundreds of thousands of users and presents a preliminary analysis of the data showing that indeed Active 10 helps users achieve the RPA target if used for 4-8 weeks. The goal of this paper is to present and discuss the concept developed for the intervention, the approach to tracking mobility and the complexity in developing such a large scale application. We will then present a preliminary data analysis performed on a cohort of 129,010 users who kept the app for 8 weeks. Finally we will discuss the results and present some future work.
2 DESIGNING ACTIVE 10
Several studies have addressed the use of apps for improving physical activity, with evidence suggesting that moderate to good improvements to physical activity can be achieved when using self-monitoring techniques [14]. Significant heterogeneity exits amongst study sample size and study design, including intervention length. For example, Schoeppe et al [13] describes 27 studies with sample size ranging from a few dozens to several hundred and length of intervention ranging from a couple of weeks to a few months. A meta-analysis of randomised-controlled trials showed how using computers, wearable or mobiles reduced sitting time by 41.28 min per day with the benefit reducing progressively over 3, 6 and 12 months; again sample sizes were in terms or dozens or hundreds [15]. Testing apps in the real world is useful but observations are extremely difficult, as samples tend to be small and not statistically valid over the full population [16]. We believe that additional evidence from a large sample is critical to provide insights in the actual usefulness of app-based interventions. Active 10 was designed as a 24/7 intervention tracking a userÕs lifestyle in terms of brisk and conventional walking. It was designed for large-scale usage to support (and collect detailed data from) a population of hundreds of thousands of people; it was based on the concept of achieving daily goals in terms of bouts of 10 minutes of brisk walking. Several studies have used pedometers to track physical activities [7]. Tracking bouts of brisk walking however, requires a complex strategy beyond simply counting steps. Specialised trackers (e.g. Fitbits) and smart watches (e.g. Apple Watch or GarminÕs) can potentially provide such information if the data is further processed [8]. However, access to such devices is challenging at a population level, particularly amongst the least active who also tend to be amongst the least affluent parts of society [18]. Therefore, the Active 10
Active 10: Brisk Walking to Support Regular Physical Activity PervasiveHealth 2019, May 2019, Trento, ,
3
intervention started with the development of a custom self-monitoring app, especially designed to track the achievement of daily bouts of 10 minutes of brisk walking via mobile phone. The intervention was designed cooperatively by a group of experts and stakeholders (including input from potential users and refers via the National Centre for Sport and Exercise Medicine in Sheffield), designers, data analysists and software developers to ensure: 1) that the app would be user friendly; 2) that all the
3
https://www.statista.com/statistics/262179/market-share-held-by-mobile-operating- systems-in-the-united-kingdom/
[image:4.612.75.538.178.659.2]relevant variables of the intervention could be captured, to help inform future interventions and strengthen their impact. The main requirements derived from the consultations for the behaviour change app were: (i) compatibility with a wide range of consumer phones so to address digital exclusion: Android 4.4+ and iOS9+ were identified as targets, as currently covering over 95% of the UK market of Android and iOS which in turn account for over 99% of the devices3; (ii) 24/7 working - no need to
4
start/stop the tracker before attempting a 10-minute brisk walk; (iii) low battery impact to avoid limiting the device availability to the user; (iv) goal setting in terms of number of daily active 10s (1, 2, 3 daily corresponding to a maximum of 70, 140, 210 brisk minutes a week); (v) rewards and badges for achieving personal goals; (vi) motivational messages to keep the user engaged in the target behaviour; (vii) regular reminders and feedback about performance. To achieve maximum adoption, the main message of the Active 10 intervention (including the behaviour change app) and of the associated media campaign was to include brisk walking as part of an individualÕs normal everyday activity (e.g. commuting, shopping, etc.), rather than planning specific sessions dedicated to exercise.
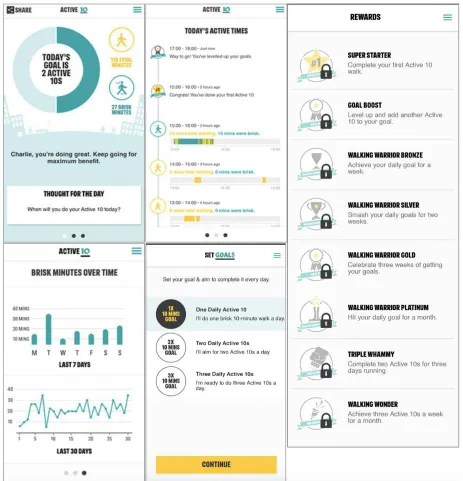
2.1 The App
To reflect the requirements of the campaign (i.e. to increase RPA), a mobile app was designed, called Active 10, divided into three main pages (See Figure 1). The first page presents an overview of the userÕs daily activity, showing the achievement of goals and the number of Active 10s (i.e. bouts of continuous brisk walking that lasted for at least 10 minutes) in a day (0, 1, 2, 3), the total number of brisk minutes and the total number of walked minutes, both on a daily basis. Moreover, the app included daily motivational message selected from a pool of 28 intended to support engagement and adherence to the target behaviour. The second page showed a userÕs daily timeline in a graphical form with normal walking shown in yellow and brisk walking shown in teal. The activities are divided on an hourly basis. Finally, the third page was dedicated to visualise summary activity over the past 7 and 30 days of app usage in terms of brisk walking. To enhance user self-efficacy, individual goals could be set (within a predefined range) supported by a system of rewards designed to reinforce changes in behaviour through the achievement of targets. Users could also set goals in terms of daily Active 10s (1, 2 or 3 daily) and receive 8 types of rewards for achieving the goals (the rewards are listed in Figure 1). 1 Active 10 a day means 70 minutes of brisk walking a week, 2 means 140 and 3 210 minutes. The process of sign-up and initial engagement in the app was intentionally kept simple to reduce user drop out: it required inputting a name for customising the messages and to accept various terms and conditions on the data management. No personal details were taken from the user, not even data which could potentially benefit follow-up analysis, such as postcode or age/height/weight.
2.2 The Tracker
The physical activity behaviour of individuals is monitored via a 'tracker' that works 24/7. It utilises the mobile phoneÕs internal sensors to compute type of activity (e.g. walking), intensity (e.g. cadence) to identify geo-located bouts of movement. The tracker operates in the background and senses mobility features through a range of sensors (e.g. step counters, activity recognition, accelerometer, gyro, etc.) as well as from location services (GPS, network, etc.). The tracker fuses the data to create geo-located quantified multimodal mobility segments (user trips), which are
Active 10: Brisk Walking to Support Regular Physical Activity PervasiveHealth 2019, May 2019, Trento, ,
5
situations and are not considered in the following description). The main types correspond to physical or logical sensors in the phones: the step counter (returning the number of steps taken), the Activity Recognition sensor (A/R, returning the activity type being carried out momentarily: e.g. walking, cycling, running, in vehicle) and the location services (returning GPS coordinates with associated precision). These are sensor readings, they are highly noisy and their data needs aggregation and cleaning. The data is stored in the local database as received. No other operation is attempted in real time to reduce battery usage. The tracker employs a set of strategies to understand when the user is static: e.g. no new data is inserted by the step counter, the A/R returns still and no significant location variation is detected. In this case, all data collection modules are stopped and geo-fencing and significant motion detection are started. The data collection modules use different strategies to retrieve data from the sensors. We currently employ three strategies for step counting, two for A/R and three for location detection. At initialisation time, the tracker selects the strategies for each module. The decision is due to the intrinsic features of the phone (i.e. due to manufacturer specific limitations) or Ð in some cases Ð real time detection of the best strategy (if the phone is from an unknown manufacturer or there is no known consistent behaviour on the specific phoneÕs model). The data aggregation module is activated depending on the specific application: in the case of Active 10 it is activated either when the user opens the app to access the results or when the data is to be sent to the server. Other applications may do so regularly, depending on their specific requirements. The data in the local database is extracted and activity segments are determined. The algorithms interpreting the sensor data are based on a cascade of weak classifiers fusing and cleaning sensor data to create aggregates of coherent single mode activities (e.g. vehicular segments) that are then combined into multimodal segments (e.g. walking, followed by vehicle, followed by walking). Methods used are low and high pass filters to clean sensor data, maximum entropy modelling and weighted moving average for aggregation, as well as Kalman filters for trajectories. When the segments have been created, classified, qualified (e.g. in terms of speed, cadence, etc.), and geo-located, application specific actions are implemented: from further classification and filtering (e.g. some applications specialised in cycling have specific strategies for further specialising and qualifying cycling) and/or to determine goal reaching and eventually rewards (as in the case of Active 10). In other cases, the app may raise alarms, e.g. if the person tracked is an emergency responder in a dangerous zone and has not been moving for a while [19]. Data sending is a major source of power drain in mobile phones. This is optimised by the tracker: sending of large chunks of data is preferred over frequent sending of small packets; so during normal periods, data is sent infrequently (e.g. every six hours or once a day according to requirements), hence reducing considerably power usage. During specific periods or for specific applications (e.g. emergency management) or when moving through dynamically defined geofences, data can be sent in real time, if network is available. Data is sent every time the phone is charging and network is available. The tracker has a local database where data is stored when communication to base is
impossible, which is a frequent event in everyday life, especially in rural areas. Network availability polling is performed strategically to avoid sending data (and using both power and data allowance) when connection is unavailable or unreliable. Active 10 is defined as an implementation of the generic library, specialised in active mobility (i.e. tracking walking and running) with added application specific strategies in order to compute the number of achieved Active 10s and the matching of the goals/awarding of rewards. In order to do that, it needs to qualify walking bouts based on intensity (brisk walking) and length (10 minutes of continuous walking). These are discussed below.
2.3 Determining Speed
Brisk walking is defined in literature as walking at a speed of 3 miles per hour (4.8 km/h) [4]. However, computing speed of a walking person using a mobile phone is more complex and prone to errors: strategies based on gait tracking can be used but they require specialised equipment. Strategies based on step counting and step length require precise body measurement in order to work appropriately. Both strategies would reduce the possibility to reach out a large number of users, as they would create impediments to quick adoption which is critical for large programmes like Active10. Strategies based on GPS tracking are expensive battery-wise (as they require high frequency and high precision polling, and hence are incompatible with 24/7 tracking), prone to error (as location services are imprecise, especially in and around the built environment) and not working indoors, e.g. when using a treadmill or gym equipment. Moreover, a very short person will struggle to reach 3m/h while a very tall person with long legs will find it easier. Therefore, Active 10 works with cadence. Walking cadence (steps/minute) places emphasis on the speed of the steps, and hence on heart rate increase; it is used as a method to estimate intensity of walking. Slaght et al. showed how a general prescription of 100 steps/minute is sufficient for most of the adult population to reach moderate intensity [9]. We therefore adopted 100 steps a minute as measure of brisk walking.
2.4 Defining an Active 10
6
centre; (ii) Sit for 5 minutes; (iii) Walk for 2 minutes, stop for one minute, walk for another 2 minutes, stop for one minute, walk for 4 minutes. This was in order to study the effect of natural pauses on the initial burst, and to compare them to the following alternate activity. Impact was calculated using the effect on heart rate; (iv) Walk for 10 minutes trying to maximise effectiveness in terms of frequency of steps and stride length. This was undertaken to identify the benefits of providing information about how to perform brisk walking. As expected the experiment showed that 10 minutes of continuous brisk walking were largely unfeasible in city centres. By checking the feasibility and the heart monitoring results, it was therefore decided to adopt the following definition:
An Active 10 is a bout of 10 minutes of walking where at least 8 minutes are brisk and no break in brisk walking lasts for more than 2 minutes. As for providing the users with a clear definition of brisk walking in terms of cadence, the experiments showed a benefit in giving precise instructions (perform 100 steps a minute) but it was decided not to implement it in the final application to avoid overburdening users with explanations.
2.5 Computing an Active 10
Once chunks of consecutive brisk activity were determined, it was necessary to award one or more Active 10s to each bout. This is not as simple a task as it may seem due to the complexity of real world walking in a built or crowded environment which requires constant starts and stops. To determine if an Active 10 is achieved, a mathematical model using a bidirectional grammar was devised: it defines a non-terminal symbol BT as chunks of continuous brisk walking. Adjacent bouts are aggregated bidirectionally using rules in an augmented context free grammar. Given a BT and an NT (a chunk of non-brisk activity or inactivity), rules like the following were implemented:
��0> ��1 (��x ��2)∗
IF duration(��x)< 120s
AND nonBriskWalking(BT1+ BT2)+ duration(NTx)< 120s
THEN duration (BT0) = duration(BT1 + BT2+ NTx)
In order to identify an Active10:
�100>��
IF Duration(��)> 600s
THEN numberOfActive10(A10)= duration(BT)/600
For all the potential solutions for the achievement for the day: D10> A101((NT|BT)* A102)*
THEN numberOfActive10(D10)=∑ ��������������10(�107 i)
The resulting D10 with the highest number of Active 10 is selected. We adopted a bidirectional context free grammar as opposed to other methods such as a left-to-right finite state transducers or probabilistic processors because it was noted experimentally that greedy/left to right recognisers missed some Active 10s in complex walking patterns. A bidirectional mechanism explores all possibilities and therefore is guaranteed mathematically to return the most accurate result [10].
4 developers.google.com/fit/
3 DATA COLLECTION
The app regularly sends the collected data in batches to a central server. Data uploading is not considered a time-sensitive job in Active 10 and thus is scheduled asynchronously in the background and intelligently in order to improve the app's performance, along with aspects of system health such as battery life. As collecting movement data from hundreds of thousands of users a few times a minute generates huge amount of data, the data collection architecture is organized for scalability, efficiency and flexibility adopting a flexible on-demand delivery model. Because the user mobility data are geographically distributed and produce multidimensional data at high rates, the infrastructure is distributed to reduce bandwidth requirements and enable parallel processing. Cloud computing technologies play a pivotal role in the infrastructure. The continuous stream of raw data is collected and immediately stored into a queue component without further processing so to minimise data collection latency and transmission errors. The collected data is then extracted, validated, analysed and filtered asynchronously by a set of I/O and computation intensive extract-transform-load (ETL) tools (parallelized with multiple Òprocessing nodesÓ) in order to allow data mining and pattern recognition. The solution of separating data collection and data ingestion splits two problems: 1) processing high velocity data; 2) handling, noise filtering and validity of data. The former concerns the speed of handling data streams and the latter focuses on the usefulness, quality and accessibility of the data. The data server is write-intensive, high volume, and becomes time critical particularly when a new physical activity campaign is launched by PHE. The design of architecture supports low-latency continuous processing of data streams from geographically distributed sources. For architecture details see [19].
5 COMPLEXITY IN DEVELOPING FOR
HUNDREDS OF THOUSANDS OF USERS
Developing an intervention like Active 10 is technically complex for a number of reasons. First and foremost, it requires running a robust software engineering infrastructure with a team of developers and a team of independent testers. The size of the user base meant having to cope with around 10,000 different Android models running 6 major versions of Android with dozens of manufacturer specific implementations, 8 different iOS devices with 5 OS versions. While iOS allows collecting data using the Core Motion framework, which is highly standardised across all supported devices, Android provides a far more challenging environment. It does not provide a shared mechanism to access the sensors, especially for what concerns the older versions of the Operating System (OS). Google Fit4 provides an infrastructure to
Active 10: Brisk Walking to Support Regular Physical Activity PervasiveHealth 2019, May 2019, Trento, ,
7
methods to access the step counter are working on any Samsung device with Android <6.0). All this is largely undocumented in the official documentation. Moreover, largely undocumented manufacturer specific battery management requires the identification of strategies for background processing (e.g. some manufacturers require the user to explicitly enable an app to work in the background, i.e. when the screen is off; in others, the step counter sensor is killed every few minutes, when started in the background via the standard Android methods, etc.). Some manufacturers stop any application that has been running without any user interaction after a few hours or days. Even within a single manufacturer there can be some very different model behaviour with for example a Samsung J5 behaving quite differently from an S5 or an A5. Similarly, Android has changed radically its approach to background processes, becoming more strict after Android 6. Android 8 and 9 dispose of these processes for good. Therefore, it is necessary to implement foreground processes for tracking (i.e. processes similar to an MP3 player app - they leave a permanent notification on the lock screen which irritates several users of an app working 24/7) but even those are not guaranteed to be safe from manufacturer specific battery strategies. Finally, any new version of the Android operating system is initially published for a restricted set of brands (typically Pixel phones) and then the other manufacturers will introduce it within 6-8 months; Android often present manufacturer specific restrictions and interpretations of the official specs which are largely undocumented. This requires continuous testing on a wide range of devices from different manufacturers. To overcome this, every new version of Active 10 is developed and tested using 10 representative device models running 4 versions of OS by the developer and it is then tested by an external testing company on another 14 devices. Around 100 users are enlisted in the Beta programme. The app was initially tested with the beta testers, then soft launched with a few tens of thousands of users and then finally released to the general public over 6 months. The tracker is under continuous development to ensure compatibility with evolutions of operating system and device. The adoption in other applications allows creating a critical mass of users, testers and developers around it. Despite this, each major version may take up to 30 days of testing and debugging before being released. Once on the market, any user feedback needs quick reaction. We answered a few thousands of user reviews over 1.5 years. The complexity of data collection over large scale is discussed in a previous section.
6 DATA ANALYSIS
Active 10 was soft launched in March 2017 through an Internet only campaign. It was downloaded around 30,000 times by May 2017. It was then fully launched with TV and street billboard campaigns and articles on major news outlets. A BBC prime time programme on the concept of brisk walking and the use of Active 10 was also aired in March 2018. The number of downloads has topped 620,000 as per January 2019 (iOS 53%, Android 47%). This
5
https://andrewchen.co/new-data-shows-why-losing-80-of-your-mobile-users-is-normal-and-that-the-best-apps-do-much-better
has generated a wealth of usage data. We performed a preliminary data analysis using a sample of 250,000 users who had used the app for at least one full day after installation. We identified the subset of 129,010 (52%) of users who used it for more than 56 days (8 weeks). Any missing data about specific days was replaced with the userÕs average of the preceding and following day. Missing days may be caused by several factors, e.g. users forgetting their phone at home for the day. Any daily results above 24 active 10s (240 minutes of brisk walking) was capped to 24 to avoid outliers. A week is defined as 7 consecutive days starting from the first full day of usage. The app retention rate compares favourably to reported averages for e.g. Android apps, where daily active users fall to around 20% after 3 days and 10% after 30 days5. Descriptive
and summary statistics were used to analyse the study population and compare the findings at baseline with those at 8 weeks. The user sample was chosen according to the following criteria: (i) the users have all completed the 4 weeks of intervention supported by the weekly rewards; (ii) the time is long enough to evaluate any improvement in exercise ability (iii) we can evaluate what happens in the medium term, i.e. is any gain in terms of active mobility sustained in time or do the users fall back to their standard habits?
8
active. We then further divided those who had achieved less than one active 10 in the first week; to better understand how they achieved their average Active 10 in week 8. We considered 5 groups: 0-0.25, 0.25-0.5, 0.5-0.75, 0.75-1, and 1-1.25. The latter group is not technically inactive but we included it to check if the performance of borderline users (those who achieved an Active 10 in the first week) decreases during the following weeks. Table 4 shows the achievements of these groups over the 8 weeks. The means of all groups increased and even those who initially managed just a few minutes of brisk walking a day over the first
week went on getting very close to an average of one Active 10 over the 8 weeks period.
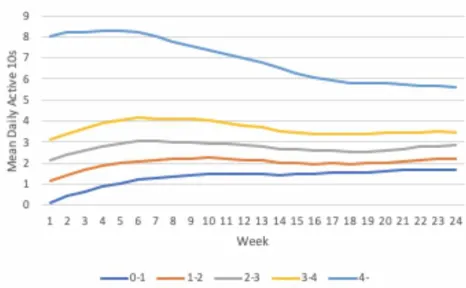
[image:9.612.72.305.222.488.2]We finally analysed the 18,323 users who had kept the app for at least 24 weeks (Figure 5). Although these users only include 15% of those who kept the app for 8 weeks or more, the basic behaviour patterns remained consistent with those previously outlined in Figure 3, with higher activity users at baseline decreasing towards 3 Active 10s at week 24, while baseline low activity users increasing their activity, with the 11,794 most inactive users in week 1 reaching an average of 1.7 active 10s by the end of 24 weeks (against 1.38 at week 8).
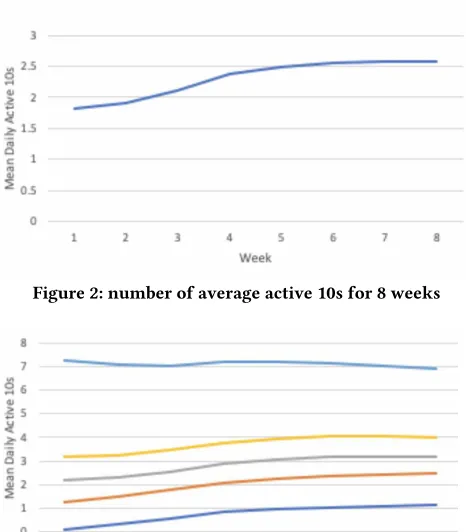
Figure 2: number of average active 10s for 8 weeks
Table 1: Distribution of users according to Active 10s achieved during week 1
[image:9.612.324.566.333.532.2]Active10s 0 1 2 3 4+ % users 55.42 13.08 8.98 6.07 16.45 Number of users 75,093 17,720 12,169 8,228 22,292
Table 2: Distribution of users inactive in week 1
Active10s 0.25 0.5 0.75 1 1.25 % users 37.13 4.19 3.80 1.76 6.25 Number of users 59,111 6,669 6,051 2,799 9,947
Figure 3: Average active 10s achieved over 8 weeks by the users who at end of week one achieved an average of 0, 1, 2, 3, 4+ active 10s a day
Figure 4: Progression of number of active 10s achieved by users who at the end of week 1 achieved 0-.25, .25-.5. .5-.75, .75-1 and 1-1.25 Active 10s a day.
[image:9.612.323.556.627.682.2]Table 3: Average active 10s achieved over 8 weeks by the users who at end of week one achieved an average of 0-1, 1-2, 2-3, 3-4, 4+ Active 10s a day(standard deviation in parentheses).
Table 4: Average active 10s achieved over 8 weeks by the users who at the end of week 1 achieved an average of 0-0.25, 0.25-0.5. 0.5-0.75, 0.75-1 and 1-1.25 Active 10s a day (standard deviation in parentheses).
Active 10s 0-1 1-2 2-3 3-4 4+ Week 1 0.12
(0.2)
1.25 (0.28)
2.21 (0.28)
3.19 (0.27)
7.24 (3.54) Week 8 1.13
(1.95)
2.46 (2.70)
3.16 (2.84)
4.02 (3.11)
6.88 (4.11)
Active 10s 0-.25 .25-.5 .5-.75 .75-1 1-1.25 Week 1 0.01
(0.04)
0.34 (0.07)
0.61 (0.08)
0.84 (0.03)
1.03 (0.06) Week 8 0.9
(1.70) 1.8 (2.30)
2.19 (2.68)
2.39 (2.65)
1.96 (2.31)
Active 10: Brisk Walking to Support Regular Physical Activity PervasiveHealth 2019, May 2019, Trento, ,
[image:10.612.57.290.86.230.2]9
Figure 5: Progression of number of achieved active 10s over 24 weeks - six months (18,323 users)
7 DISCUSSION AND CONCLUSIONS
In this paper we have described Active 10, a behaviour change app and associated data collection infrastructure developed with the intention of increasing physical activity via brisk walking amongst inactive individuals. The behaviour change app has had considerable success with over 620,000 downloads and exhibits a low churn rate for a mobile app. The app is designed for people who are physically inactive (less than 30 brisk walking minutes a week) and aimed to move these users towards 150 minutes of brisk walking a week as per WHO and UK Chief Medical OfficersÕ recommendations. We have described the way the app and the infrastructure were designed, the concept of Active 10 was developed, as well as the complexity of developing a tracking app working over very large scale. A preliminary data analysis suggests a shift towards increased physical activity for users who kept the app for over 8 weeks. The majority of users (73%) who achieved an average of less than one daily Active 10 at baseline; achieved an average of over one Active 10 by the end of week 8, with the most initially inactive users showing the greatest proportional increase. The interface set a maximum goal of 3 Active 10s per day, and the number of users achieving this goal doubled during the first 4 weeks (from 8% to 15%). A high standard deviation was observed, that suggest great variations in individual experiences - this can be related to the varied and naturalistic composition of our study population. Further analysis is required to understand the actual behaviour of the population in this respect.
As we aimed to reach the greatest amount of users. we relied on individually owned devices, i.e. their mobile phones. This introduces questions related to the precision of such devices in counting brisk walking. On the one hand, phones have a high variability in terms of quality of sensors and ability to process data in real time as required by brisk walking monitoring. Several studies have shown how even when using specialised trackers such as Fitbits and Garmins, there can be a great variability of results. For example, Hansen et al. [20] showed how the systematic error found with a Fitbit Charge HR was of 26.8% steps too many on a 2 km/h walking test. To count steps and cadence we relied on the phoneÕs internal step counter sensor. As phones
are not specialised fitness devices, their movement sensors can be of lower quality than those mounted on dedicated devices; the results may therefore be affected. No data is available on accuracy of mobile phones in tracking steps. With over 10,000 different types of devices from dozens of manufacturers with multiple different variants, it is even possible to argue that no exhaustive representative study for a large population is possible. Even if the most representative models were tested and compared to a baseline (e.g. Samsung and Apple have over 75% of the UK market with around 25 devices), single devices could still deviate from the standard. Our experiments showed for example how two Moto G1 Android Phones identical in model and operating system version reported a discrepancy of 18% in step counting. There was no apparent reason for that except for the quality or calibration of the sensors. Moreover, the status of a device can potentially influence the results. While in specialised devices the processor is dedicated to tracking, different processes can run at the same time on a phone and this can affect the tracking results. For example we noticed how running multiple trackers (e.g. Strava) in parallel to Active 10 on underpowered devices brought to different results from using Active 10 alone for the same level of physical activity. This is because some dedicated tracker apps consist of high intensity foreground processes absorbing relevant amount of resources, leaving 24/7 background processes like Active 10 with limited computational resources. Are these factors affecting the validity of the results of our study? It is impossible to guarantee that all users that achieved (or not achieved) an Active 10 effectively achieved brisk walking in absolute terms. More work is needed to evaluate the ability of phones to consistently track brisk walking. As for this paper, it is important to stress that the aim of the campaign was to support people in achieving a healthier lifestyle by adopting brisk walking as part of their everyday routine, to achieve daily goals and to keep going (and increase their physical activity) over time. In this sense the campaign seems to have been successful.
10
to be an achievable level for inactive users, however the data seem to show that the 8% of users who are initially far more active than this threshold tend to reduce their activity to this level. Whether it is possible to incentivize the more active users without disincentivize inactive users remains a point of debate. We will have to consider if to change the limitation in goal setting. In general, results would suggest to revise the design of the app and of the intervention. For example, data seems to suggest that at the end of week 4 Ð when the rewards end, the performance of users drops for a few days, although users seem to pick up their brisk walking later. Is a longer reward system needed, especially considering that the less active users tend to achieve the best results over 8 weeks? One aspect of interest is the relationship between the increase in the number of Active 10s and the time walked/steps taken. A preliminary analysis shows that none of the groups increased their daily walking time or their number of steps over the 8 weeks. If this was confirmed, it would mean that Active 10 does not make users walk more (as it is often impossible given a personÕs everyday commitments); but rather it encourages users to walk faster while they still go on with their usual life, as the appÕs marketing promised. Another aspect to consider is the userÕs behavioural interaction with the app, e.g. the performance of users who infrequently or regularly open the app and the relationship between user goal settings and achievements. This is one of the research questions set initially from the stakeholders and we plan to evaluate this in the near future.
ACKNOWLEDGMENTS
he concept of Active 10 and the associated campaign was developed by Public Health England. he science and the tracking technology behind the application, the tracker and the server infrastructure was developed by he University of Sheffield. he development of the technology was partially funded by the SETA European project funded as part of the European Horizon 2020 programme under contract 688082. hanks to James and Paul Ridgway for support in data analysis.
REFERENCES
[1] J. Larry Durstine, Benjamin Gordon, Zhengzhen Wang, Xijuan Luo: Chronic disease and the link to physical activity, Journal of Sport and Health Science Volume 2, Issue 1, March 2013, Pages 3-11
[2] World Health Organization (WHO), Global Recommendations on Physical Activity for Health, 2012.
[3] Kristen J.uell BS John P.Porcari Barry A.Franklin CarlFoster Richard A.Andreuzzi Ryan M.Anthony: Is Brisk Walking an Adequate Aerobic Training Stimulus for Cardiac Patients?
in Chest, Volume 122, Issue 5, November 2002, Pages 1852-1856. [4] Praet, S.F.E., van Rooij, E.S.J., Wijtvliet, A. et al. Brisk walking compared
with an individualised medical fitness programme for patients with type 2 diabetes: a randomised controlled trial in Diabetologia (2008) 51: 736. htps://doi.org/10.1007/s00125-008-0950-y.
[5] Public Health England: 10 minutes brisk walking each day in mid-life for health benefits and towards achieving physical activity recommendations - Evidence summary, available at htps://www.dors.it/dl.php?idalleg=3241 [6] G. C. Le Masurier, C. L. Sidman, and C. B. Corbin, ÒAccumulating 10,000
steps: does this meet current physical activity guidelines?Ó Research
uarterly for Exercise and Sport, vol. 74, no. 4, pp. 389Ð394, 2003. [7] Suliman Mansi, Stephan Milosavljevic, G David Baxter, Steve Tumilty, and
Paul Hendrick. 2014. A systematic review of studies using pedometers as an intervention for musculoskeletal diseases. BMC Musculoskeletal Disorders 15, 1 (dec 2014), 231. htps://doi.org/10.1186/1471-2474-15-231
[8] Ankit Gupta, Tim Heng, Chris Shaw, Linda Li, and Lynne Feehan. 2018. Designing pervasive technology for physical activity self-management in
arthritis patients. In Proceedings of the 12th EAI International Conference on Pervasive Computing Technologies for Healthcare (PervasiveHealth '18). ACM, New York, NY, USA, 1-10.
[9] J. Slaght, M. SŽnŽchal, T. J. Hrubeniuk, A. Mayo, and D. R. Bouchard Walking Cadence to Exercise at Moderate Intensity for Adults: A Systematic Review, in Journal of Sports Medicine, Volume 2017, Article ID 4641203, 12 pages, htps://doi.org/10.1155/2017/4641203
[10] O. Stock, R. Falcone, P. Insinnamo: Bidirectional charts: a potential technique for parsing spoken natural language sentences, in Computer Speech & Language, Volume 3, Issue 3, July 1989, Pages 219-237, htps://doi.org/10.1016/0885-2308(89)90019-3
[11] S. Pongpaichet, V.K. Singh, R. Jain. and A. Pentland: ÒSituation Fencing.Ó Proceedings of the 1st ACM International Workshop on Personal Data Meets Distributed Multimedia - PDM Õ13, 2013, Barcelona, ACM. [12] D., Ding, K. D. Lawson, T. L. Kolbe-Alexander, E. A. Finkelstein, P. T.
Katzmarzyk, W. Van Mechelen, M. Prat: Lancet Physical Activity Series 2 Executive Commitee. "he economic burden of physical inactivity: a global analysis of major non-communicable diseases." he Lancet 388, no. 10051 (2016): 1311-1324.
[13] Schoeppe, S., Alley, S., Van Lippevelde, W., Bray, N. A., Williams, S. L., Duncan, M. J., and Vandelanote, C. (2016). Efficacy of interventions that use apps to improve diet, physical activity and sedentary behaviour: a systematic review. International Journal of Behavioral Nutrition and Physical Activity, 13(1):127
[14] Higgins, J. P. (2016). Smartphone applications for patientsÕ health and
fitness. he American Journal of Medicine, 129(1):11Ð19.
[15] Stephenson, A., McDonough, S. M., Murphy, M. H., Nugent, C. D., and Mair, J. L. (2017). Using computer, mobile and wearable technology enhanced interventions to reduce sedentary be- haviour: a systematic review and meta-analysis. International Journal of Behavioral Nutrition and Physical Activity, 14(1):105.
[16] D. E. Jake-Schoffman, V. J. Silfee, , M. E. Waring, E. D. Boudreaux, R. S. Sadasivam, S. P. Mullen, J. L. Carey, R. B. , E. Y. Ding, G. G. Bennet, and S. L. Pagoto: "Methods for Evaluating the Content, Usability, and Efficacy of Commercial Mobile Health Apps" (2017). Emergency Medicine Publications and Presentations. 108
[17] Michie, S., et al., he behavior change technique taxonomy (v1) of 93 hierarchically clustered techniques: building an international consensus for the reporting of behavior change interventions. Ann Behav Med, 2013.
46(1): p. 81-95.
[18] OÕDonoghue G. et al.: Socio-economic determinants of physical activity across the life course: A "DEterminants of DIet and Physical ACtivity" (DEDIPAC) umbrella literature review. In PLoS One. 2018; 13(1): e0190737. [19] F. Ciravegna; J. Gao; C. Ingram; N. Ireson; V. Lanfranchi; H. Simanjuntak: Mapping Mobility to Support Crisis Management In: Proceedings of the 15th Annual Conference for Information Systems for Crisis Response and Management, 20-23 May 2018, Rochester NY, USA [20] Leth S, Hansen J, Nielsen OW, Dinesen B.: Evaluation of commercial