White Rose Research Online URL for this paper:
http://eprints.whiterose.ac.uk/147589/
Version: Published Version
Article:
Charnley, F., Tiwari, D., Hutabarat, W. et al. (3 more authors) (2019) Simulation to enable a
data-driven circular economy. Sustainability, 11 (12). 3379. ISSN 2071-1050
https://doi.org/10.3390/su11123379
[email protected] https://eprints.whiterose.ac.uk/
Reuse
This article is distributed under the terms of the Creative Commons Attribution (CC BY) licence. This licence allows you to distribute, remix, tweak, and build upon the work, even commercially, as long as you credit the authors for the original work. More information and the full terms of the licence here:
https://creativecommons.org/licenses/
Takedown
If you consider content in White Rose Research Online to be in breach of UK law, please notify us by
Article
Simulation to Enable a Data-Driven Circular Economy
Fiona Charnley1, Divya Tiwari2,*, Windo Hutabarat2, Mariale Moreno3, Okechukwu Okorie1 and Ashutosh Tiwari2
1 Exeter Centre for the Circular Economy, University of Exeter, Rennes Drive, Exeter EX4 4PU, UK;
[email protected] (F.C.); [email protected] (O.O.)
2 Department of Automatic Control and Systems Engineering, University of Sheffield, Sheffield S1 3JD, UK;
[email protected] (W.H.); [email protected] (A.T.)
3 Centre for Competitive Creative Design, Cranfield University, Bedfordshire MK43 0AL, UK;
* Correspondence: [email protected]
Received: 1 May 2019; Accepted: 12 June 2019; Published: 19 June 2019
Abstract:This paper presents an investigation on how simulation informed by the latest advances in digital technologies such as the 4th Industrial Revolution (I4.0) and the Internet of Things (IoT) can provide digital intelligence to accelerate the implementation of more circular approaches in UK manufacturing. Through this research, a remanufacturing process was mapped and simulated using discrete event simulation (DES) to depict the decision-making process at the shop-floor level of a remanufacturing facility. To understand the challenge of using data in remanufacturing, a series of interviews were conducted finding that there was a significant variability in the condition of the returned product. To address this gap, the concept of certainty of product quality (CPQ) was developed and tested through a system dynamics (SD) and DES model to better understand the effects of CPQ on products awaiting remanufacture, including inspection, cleaning and disassembly times. The wider application of CPQ could be used to forecast remanufacturing and production processes, resulting in reduced costs by using an automatised process for inspection, thus allowing more detailed distinction between “go” or “no go” for remanufacture. Within the context of a circular economy, CPQ could be replicated to assess interventions in the product lifecycle, and therefore the identification of the optimal CE strategy and the time of intervention for the current life of a product—that is, when to upgrade, refurbish, remanufacture or recycle. The novelty of this research lies in investigating the application of simulation through the lens of a restorative circular economic model focusing on product life extension and its suitability at a particular point in a product’s life cycle.
Keywords: circular economy; circular 4.0; remanufacturing; discrete event simulation (DES); system dynamics (SD)
1. Introduction
The circular economy model offers an alternative to the traditional linear economy (take, make, use and dispose), decoupling economic value creation from resource consumption by keeping resources in use for as long as possible, extracting the maximum value from them whilst in use and then recovering and regenerating products at the end of each service life [1]. Three circular economy strategies for enhancing asset and resource productivity within a manufacturing environment have been identified in literature: (i) increasing the utilisation of an asset or resource (product as a service, sharing platforms, greater resource productivity), (ii) extending the life of an asset (durable design, predictive maintenance, reuse, remanufacture), and (iii) cascading an asset through additional use cycles (component harvesting, recycling) [2]. However, the implementation of circular economy strategies in manufacturing environments is subject to several risks, including the mismatch between
fluctuating demand, supply and value of used components, causing uncertainty regarding costs and return on investment [3]. Another issue is the lack of information concerning the condition, availability and location of in-service assets [4]. The emergence and increasing uptake of technologies based on the principles of Industry 4.0 present a way to overcome some of these barriers to fully implementing circular economy principles in the manufacturing sector [3].
Data-driven intelligence is rapidly becoming a pervasive feature of our economy, where data generated through social, mobile, machine and product networks are being leveraged through data analytics to create new forms of value. In manufacturing industries, through emerging concepts such as Industry 4.0 and the Internet of Things (IoT), data-driven intelligence is transforming how products are manufactured, sold and used across the value chain [2]. Despite a wealth of research into technological advances in manufacturing, much of it has focused on productivity, flexibility and responsiveness [5]. Pairing the digital revolution with the principles of a circular economy model has the potential to radically transform the industrial landscape and its relationship to materials and finite resources, thus unlocking additional value for the manufacturing sector [6].
Data-driven approaches for a circular economy in manufacturing are strongly related to the concept of Industry 4.0, also known as “smart manufacturing” or the 4th Industrial Revolution [3,7]. Industry 4.0 is based on a manufacturing system driven by information technologies such as cyber-physical systems, cloud manufacturing, IoT, additive manufacturing and big data [8]. It involves a combination of smart factories and product-enabled communication through the aforementioned technologies [9]. Industry 4.0 allows decision making through real-time information on production, machines and flow components, as well as constant monitoring of performance and tracking parts and products [9]. Industry 4.0 technologies have the potential to unlock a circular economy through the tracking of in-use products by embedded sensors in order to monitor maintenance requirements [3]; products can be monitored while in use to extend their lifetime by the recovery of components for reuse or remanufacture or to inform end-of-life strategies such as disassembly and recycling [10]. A “product passport” is required that can display information about the materials contained in the product to facilitate reverse logistics and therefore circular economy strategies [8]. In addition, information technologies could be used to monitor and control operational performance to assess real-time efficiency to predict the maintenance or refurbishment of components/products [11]; to provide services alongside the physical product (e.g., to customise products using 3D printing [12]); or remove the provision of physical products by replacing them with virtual ones [3].
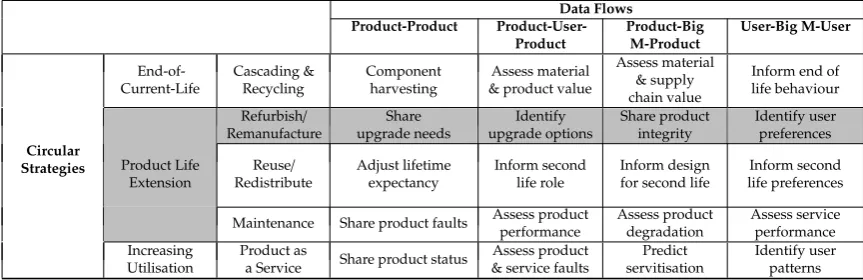
There has been growing interest in exploring the relationship between a circular economy and Industry 4.0 [3,12,13]. However, a deeper knowledge and understanding is required on how data acquired from digital technologies can actually unlock the potential of a circular economy. Table1
Table 1.Data flows and circular strategies. Data Flows Product-Product Product-User-Product Product-Big M-Product User-Big M-User End-of-Current-Life Cascading & Recycling Component harvesting Assess material & product value
Assess material & supply chain value
Inform end of life behaviour Refurbish/ Remanufacture Share upgrade needs Identify upgrade options Share product integrity Identify user preferences Circular
Strategies Product Life
Extension Reuse/ Redistribute Adjust lifetime expectancy Inform second life role Inform design for second life
Inform second life preferences
Maintenance Share product faults Assess product performance Assess product degradation Assess service performance Increasing Utilisation Product as
a Service Share product status
Assess product & service faults
Predict servitisation
Identify user patterns
This research focused on investigating the value of capturing and analysing data streams to inform decision-making processes in the remanufacturing of automotive components (darkest shaded) using simulation techniques such as discrete event simulation (DES) and system dynamics (SD). The remanufacturing process for an electric motor was the focus of this study, as the automotive sector reveals that the sustainability benefits of digitisation could be substantial, arising from 20–30% machine downtime reduction, 12–20% inventory reduction, 30–50% cost of quality reduction and up to 80% improvement in forecasting accuracy [18]. In addition, this sector has succeeded in using data-driven intelligence to enable sustainable practices. However, studies have focused on only one circular economy strategy (e.g., predictive maintenance) and such risks have prevented successful implementation of other aspects of remanufacture such as the assessment of the stochastic nature of returned products [19], highlighted as one of the key challenges facing remanufacturing.
Digital modelling and simulation could be useful in supporting decision making in remanufacturing operations. Simulation techniques such as SD and DES have been used to predict the behaviour of complex remanufacturing systems [20,21], but very few adopt a data-driven approach. Although data-driven simulations have been developed for manufacturing applications in automotive [22,23] and semiconductor sectors [24], assembly logistics [25] and the construction industry [26], there has been very little research in data-driven simulation for remanufacturing operations. Previous work by the authors investigated an SD-based approach for the data-driven remanufacturing of fuel cells [27]. This work identified the key parameters/variables needed for fuel cell remanufacturing by means of interviews, ranked the variables by Pareto analysis, developed a causal loop diagram for the identified parameters/variables to visualise their impact on remanufacturing and modelled a simple stock and flow diagram to simulate and understand data and information-driven schemes in remanufacturing. Recently, Goodall et al. [28] reported a data-driven simulation approach to support the remanufacturing operations of an electric and electronic remanufacturer where they investigated the utilisation of data from digital manufacturing systems to predict material flow behaviour within remanufacturing operations by updating and automatically modifying the simulation model to reflect the real system. To address the research gap in data-driven simulation for remanufacturing, this paper aims to investigate the value of simulation techniques to inform decision-making processes in remanufacturing, considering the stochastic nature of returned products.
influence decisions surrounding remanufacture and can lead to significant cost, material and resource savings by reducing the uncertainty in the condition of components returned for remanufacture.
2. Methodology
2.1. Qualitative Data Collection
A state-of-the-art literature review on the circular economy, remanufacturing, and electric and hybrid vehicles was conducted to understand the differences, meaning and impact on the remanufacturing process. In addition to this, the taxonomies of manufacturing data for the automotive industry and the potential influence of data from digital technologies on decision-making processes in remanufacturing were identified from the review.
A series of visits and interviews were conducted with industrial organisations involved in remanufacture. A qualitative semi-structured interview protocol was developed and deployed with participants from five companies (referred to here as 1, 2, 3, 4 and 5). Companies 1 and 2 were automobile mechanical and electrical parts independent remanufacturers, Company 3 was an automobile manufacturer, Company 4 was a hybrid automobile manufacturer and Company 5 was a research company involved in remanufacturing. Further details are provided in [27]. Data were also collected via on-site observations, and several parameters were recorded: production volume, expected life, attrition rates, time taken in various remanufacturing operations etc. This enabled an informed understanding of remanufacturing and the investigation of data acquisition and interaction in the remanufacturing process. As a result, a key component was identified as a use case, and its remanufacturing process was mapped.
2.2. Use Case
The remanufacturing process for an independent remanufacturer processing an electric motor was selected as a use case, focussing on the remanufacture of two major components of the electric motor: a rotor (an electrical component) and a shaft (a mechanical component).
2.3. Simulation
Discrete event simulation (DES) was suitable for this study because it allowed the system under analysis to be described as a sequence of operations focusing on the processes in a system at a medium level of abstraction. This approach the enabled modelling and visualisation of a multi-unit manufacturing system without restrictions on the number of units. A system dynamics approach provided the methodology to study the dynamic behaviour of the system at a systems level and allowed long-term decision making.
The SD and DES models were developed in AnyLogic simulation software (provided by The AnyLogic Company). The models were based on data gathered from the shop floor and the information obtained from industry interviews. The two simulation models are detailed as follows:
2.3.1. Discrete Event Simulation Model
2.3.2. System Dynamics Model
The SD model had a closed-loop structure with feedback loops and consisted of stocks and flows. The model was developed on the basis of remanufacturing data for fuel cells, provided by an industry partner. Stocks were accumulations and were the sources of disequilibrium. Flows were the rate at which the system states changed. Key stocks included collected products, reusable products, remanufacturing capacity, redistributed products, products in use, new products, products for controlled disposal and disposed products. Key flows included collection rate, reuse rate, remanufacturing rate, disposal rate, redistribution rate, delay in redistribution, production rate. Key outputs included products awaiting to be remanufactured and effect of CPQ on remanufacturing rate. This model allowed better understanding of the effects of CPQ in the remanufacturing process of fuel cells.
2.4. Validation
Separate remanufacturing organisations were involved in the development of the simulation models and their validation to keep the two independent of each other. The simulation models were presented to these organisations, and their feedback was recorded using a questionnaire. Further details are discussed in Section4.3.
3. Development of Simulation Models
3.1. Data in Manufacturing and the Notion of CPQ
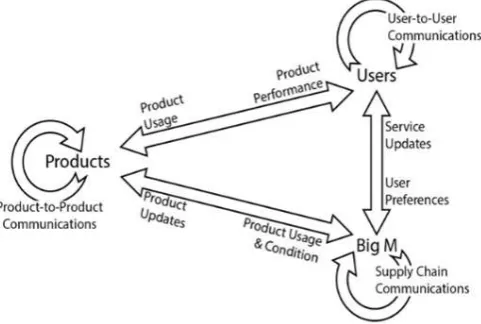
[image:6.595.178.419.434.596.2]The involvement of industrial partners, detailed in Section 2.1, enabled a more informed understanding of remanufacturing and investigation of data acquisition and interaction in the remanufacturing process between the product, the user and the Big M (manufacturer and supply chain partners), as depicted in Figure1.
Figure 1.Data flows enabling circular strategies.
amount of data that is available to provide information about the returned product. Some important features of CPQ are:
• CPQ is a function of physical condition (PC), part remanufacturing history (PRM), part replacement
history (PRH) and data from sensors (DS), as shown in Equation (1) and defined in Table2. In Equation (1),w1,w2,w3,w4are individual weights that are dependent on a number of factors including the nature of the product, nature of the industry, etc. For example, for a mechanical component such as a shaft of an electric motor,w1would be higher as compared tow2,w3orw4
as the physical condition of the returned mechanical component is a clear indicator of its actual condition. Another example is if a battery has always been used in a protected configuration, excellent external physical condition is not a good indicator of its quality and hencew1would be
lower as compared tow2,w3orw4.
CPQ= (w1∗PC) + (w2∗PRM) + (w3∗PRH) + (w4∗DS) (1)
where sum of weights (w1,w2,w3,w4) is equal to 1 and PC, PRM, PRH and DS are normalised.
• CPQ has an impact on the time spent in a remanufacturing process and associated costs (details in
Section3.2).
• The nature of the product determines the CPQ and the level of disassembly to which a component
[image:7.595.85.517.381.645.2]might go. Data from sensors could help to determine the uncertainty and CPQ.
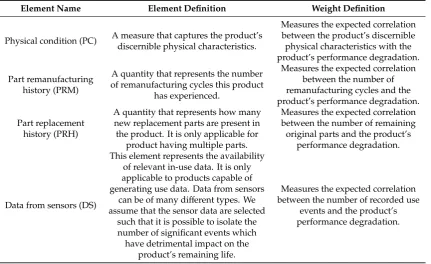
Table 2.Definition of the certainty of product quality (CPQ) elements.
Element Name Element Definition Weight Definition
Physical condition (PC) A measure that captures the product’s discernible physical characteristics.
Measures the expected correlation between the product’s discernible physical characteristics with the product’s performance degradation.
Part remanufacturing history (PRM)
A quantity that represents the number of remanufacturing cycles this product
has experienced.
Measures the expected correlation between the number of remanufacturing cycles and the product’s performance degradation.
Part replacement history (PRH)
A quantity that represents how many new replacement parts are present in the product. It is only applicable for
product having multiple parts.
Measures the expected correlation between the number of remaining original parts and the product’s
performance degradation.
Data from sensors (DS)
This element represents the availability of relevant in-use data. It is only applicable to products capable of generating use data. Data from sensors
can be of many different types. We assume that the sensor data are selected
such that it is possible to isolate the number of significant events which have detrimental impact on the
product’s remaining life.
Measures the expected correlation between the number of recorded use
events and the product’s performance degradation.
3.2. Discrete Event Simulation Model
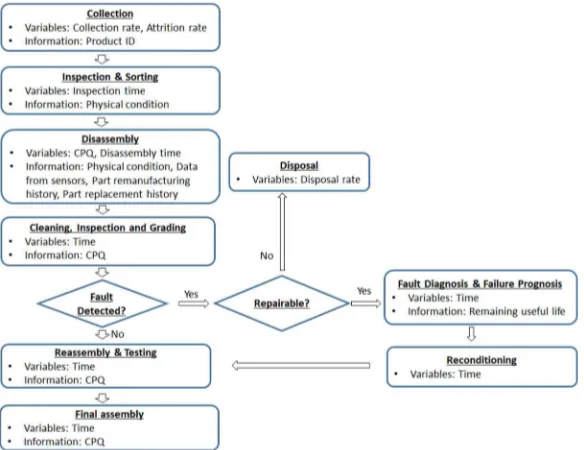
Figure2demonstrates the DES model and the sequence of remanufacturing processes of a rotor and a shaft. The key remanufacturing operations are: Inspection & Sorting, Disassembly, Cleaning, Inspection & Grading, Fault Diagnosis & Prognosis, Reconditioning, Reassembly, Testing and Final Assembly. The top and bottom halves of Figure2illustrate the remanufacturing processes for the rotor and shaft, respectively. A process flow chart for the DES model depicting key parameters at each stage is also provided in Figure3.
[image:8.595.85.513.202.400.2] [image:8.595.153.445.443.668.2]•
Figure 2.Discrete event simulation (DES) model of two components of an electric motor. The top half and the bottom half depict the sequence of remanufacturing processes for a rotor and shaft, respectively.
•
Figure 3.A flowchart depicting the DES process, key variables and information required at each stage in remanufacturing.
• Collection (returned products): The remanufacturing process starts with the collection of returned
products. As suggested in the literature, the attrition rate for electrical products was kept at 3% [30]. The number of total products currently in use was assumed as 1000. The rate of collection of returned products is given in Equation (2):
Collection rate=Total products∗Attrition rate (2)
• Inspection and sorting: After collection, the products are inspected based on their physical
condition (PC) and the product identification number (ID). Approximately 10% of the products are rejected and sent for disposal at this stage. The electric motor is then disassembled and sorted into electrical components (rotor) and mechanical components (shaft). Inspection and sorting time per component was a triangular distribution (0.5, 1, 1.5) hours, with a minimum, maximum and mode of 0.5, 1.5 and 1 h, respectively.
• Disassembly: The actual disassembly of a return is not necessarily an exact reversal of its assembly
sequence, due to various factors: degradation of components, damage to components during use, missing components, product upgrade during maintenance and remanufacturing tasks. Some components of an electric motor (e.g., rotor) can be reused directly without the need for full disassembly, whereas other components (e.g., shaft) require proper reconditioning and disassembly so that they can be reused in a remanufactured product [31]. At this stage, the CPQ of the returned product is determined and given a value between 0.1 and 1.
• Time spent in disassembly, cleaning and inspection: The CPQ of the returned product would
affect the disassembly time, cleaning time and inspection time in the remanufacturing process. For example, if the CPQ for the product is very high, then in most cases you can directly inspect/disassemble/replace the faulty part and may not need to go down to the lowest level of disassembly. Equations (3)–(5) demonstrate that time spent in disassembly, cleaning and inspection operations (for both the rotor and the shaft) is inversely proportional to the value of the CPQ. The time spent in the above-mentioned remanufacturing processes is directly proportional to the associated labour costs and the costs associated with the repair/replacement of parts. Hence, the CPQ of a product could be useful for predicting the remanufacturing time and costs.
Disassemly time= triangularCPQ(0.5,1,1.5)Equation3
Cleaning time= triangularCPQ(0.5,1,1.5)Equation4
Inspection time= triangularCPQ(0.5,1,1.5)Equation5
• Inspection and grading: Inspection is required to measure and detect the current condition of a
component. Generally, the components are graded into three categories [32]: (a) directly reusable, (b) reusable after proper repair or reconditioning and (c) cannot be repaired or reconditioned. Components that fall in the category of “directly usable” can be sent for reuse directly. Components in the category of “reusable after proper repair or reconditioning” are sent for fault diagnosis and prognosis, whereas components classified as “cannot be repaired or reconditioned” are considered as not remanufacturable and are sent for disposal.
• Fault Diagnosis and prognosis: Diagnosis detects the failure that has occurred in a component,
and isolates and identifies the root of the failure based on the data collected by the embedded sensors. Prognosis estimates the time at which a component will fail to operate at its stated specifications based on its current condition as well as the future load and environmental exposure (i.e., the prediction of the remaining useful life (RUL) of the component).
• Reconditioning and repair: The reconditioning strategies are dependent on the current condition
remanufactured versions of a component, will provide insight into the effectiveness of the reconditioning methods.
• Reassembly and testing: Generally, the reassembly sequence is the same as for the original new
product, but may differ if there has been a significant upgrade during remanufacturing.
• Final assembly: This step involves the final assembly of electrical components (rotor) and
mechanical components (shaft) before they are finally sent to the market for sale. The simulation used first-in, first-out (FIFO) logic to control the order in which products were processed.
• Disposal: The products that are not remanufacturable are sent for controlled disposal. The disposal
time per component was a triangular distribution (1, 1.5, 2) hours.
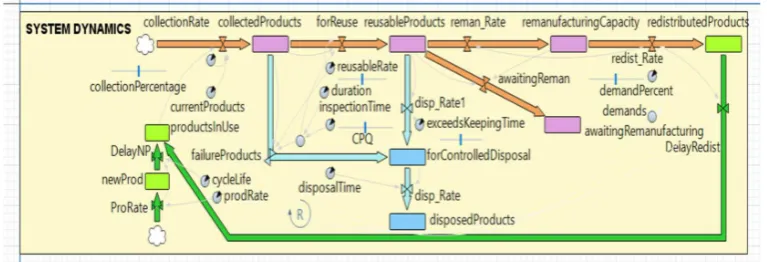
3.3. System Dynamics Model
A system dynamics model was developed to better understand the effects of CPQ on the product awaiting remanufacture, including inspection, cleaning and disassembly times for the remanufacturing process of a fuel cell at one of the industry partners, as shown in Table3. This model was used to understand the remanufacturing operation and decision-making process at a systems level. Table3
lists the main stocks and flows included in the model. The stock-flow diagram in Figure4can be translated to a system of differential equations (as shown in Table3), which were then solved via simulation. The key features of the model described below were obtained from direct conversations with industry partners:
• Collection (returned products): The remanufacturing process starts with the collection of returned
products. The attrition rate for fuel cells, as suggested in the literature, was kept at 3% [30].
• Reusable products: 80% of products going through the inspection process were expected to be
remanufactured into reusable products; the remaining 20% were sent for disposal.
• Inspection time: Inspection time of the product would be inversely proportional to the CPQ of the
returned product. Inspection time per component was a triangular distribution (0.5, 1, 1.5) hours over the CPQ of that product (Table3).
• Controlled disposal: 20% of products went through the inspection process for controlled disposal.
They were disposed of with respect to disposal time and rate. Some products (valid in the case of batteries, etc.) that exceeded the keeping time were also sent for disposal. The number that exceeded the keeping time was 1%.
• Demand: This element controls the remanufacturing rate and redistribution rate.
• Awaiting remanufacturing: Products that passed the inspection and are awaiting remanufacture. • Redistributed products: Given a product life time of 5 years. After 5 years, they automatically join
the collected products (returned products).
• New products: Given a production rate and cycle life time of 5 years and after that they
automatically join the collected products.
•
•
•
•
•
• • •
[image:10.595.106.490.609.740.2]•
Table 3.Equations for main stocks and flows from the SD model.
Stock/Flow Equation
Collection rate (currentProducts * collectionPercentage)+productsInUse
Inspection time (triangular (0.5, 1, 1.5))/CPQ
Failed products (collectedProducts * (1−reuseRate))/inspectionTime
Reuse rate max(0, (collectedProducts * reuseRate)/inspectionTime)
Failed products (collectedProducts * (1−reuseRate))/inspectionTime
Delay in redistribution delay(redist_Rate, cycleLife)
Delay in new products delay(proRate, cycleLife)
4. Summary of Results: The Value of Data
4.1. DES Model
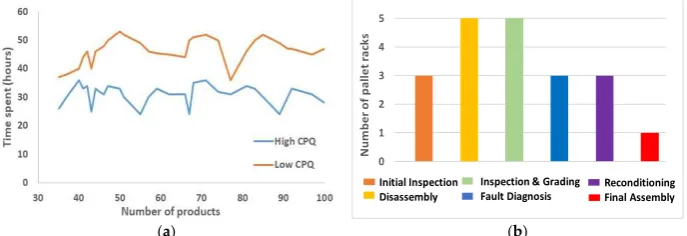
The DES Model helped to understand that the data obtained from embedded sensors in the product were critical in determining the CPQ of that product. The model in Figure2demonstrates the effect of CPQ on the time spent in disassembly, cleaning and inspection. For example, during remanufacturing of 100 products with high CPQ (ranging between 0.8 and 1), 75% of the products spent 31–35 h in disassembly, cleaning and inspection, with a mean of 31 h, as shown in Figure5a. However, during the remanufacturing of 100 products with low CPQ (ranging between 0.1 and 0.3), 75% of the products spent 46–52 h in disassembly, cleaning and inspection, with a mean of 47 h, as shown in Figure5b. Vertical bars correspond to time spent in the system, with heights proportional to the density of products. The solid blue line represents the mean time spent in the system. Figure6a depicts the variations in the time spent in disassembly, cleaning and inspection for batches of high and low CPQ.
[image:11.595.138.460.443.575.2] [image:11.595.126.470.621.739.2](a) (b)
Figure 5.Distribution of time spent in disassembly, cleaning and inspection for products with (a) high CPQ and (b) low CPQ.
(a) (b)
N
I I
D IF D G RF A
In addition, the DES model showed that storage/work space was allocated for each station in the form of pallet racks. Figure6b demonstrates a bar graph showing the maximum utilisation of pallet racks in each section of the remanufacturing plant. This feature is useful to determine the optimum resources required to meet the product demand, such as the number of workstations being used.
4.2. SD Model
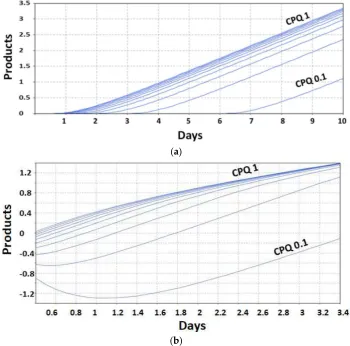
The SD model demonstrated the effect of CPQ on the products awaiting remanufacture in the system. For example, if a batch of CPQ 0.1 was received for remanufacturing, then after 10 days only 1 product would complete the disassembly and inspection stage and would reach the “awaiting remanufacture” stage. Whereas, if a batch of CPQ 1 was received for remanufacturing, the number of products at the “awaiting remanufacture” stage would be three times higher, as depicted in Figure7(top).
(a)
[image:12.595.123.474.269.615.2](b)
Figure 7. (a) Time spent for remanufacture depending on the CPQ value. (b) Effect of CPQ on reusable products.
In addition, Figure7(bottom) demonstrates the effect of CPQ on the reusable products. For example, if a batch of CPQ 0.1 was received for remanufacturing, then after 3 days there would not be any product in remanufacturing.
4.3. Interview Analysis
years of experience, remanufacturing knowledge, etc. are provided in AppendixA. A questionnaire was presented to them and their feedback recorded. Key elements from the questionnaire were:
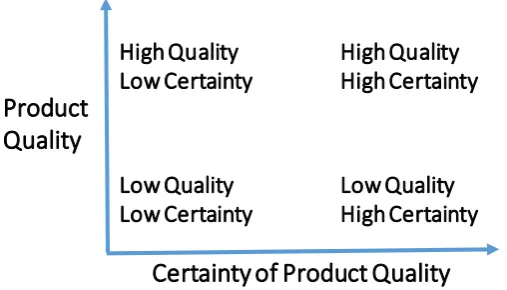
• Discussion of the most prevalent scenario in their company in terms of the actual quality and the
certainty of product quality (CPQ) of returned products, as shown in Figure8.
• How would they rate the four elements of the CPQ in Equation (1) in the order of their importance
and impact on the decision to remanufacture and impact on remanufacturing?
• How would the intrinsic knowledge play a role if the CPQ was low (quality is uncertain)?
What would the company’s strategies be to reduce costs when assessing a component?
• Would CPQ be able to substitute the intrinsic knowledge of remanufacture, or could they
be complementary?
• What if CPQ could be made into a standard according to the type of component being assessed?
[image:13.595.171.425.276.421.2]Would this increase/decrease the certainty and decision to remanufacture a component?
Figure 8.Scenarios of returned products in in terms of the actual quality of returned product and the certainty of product quality (CPQ).
The respondents were in agreement on the importance of CPQ, as it combines a function of key variables crucial for remanufacturing. However, it was noted that for the CPQ to be widely accepted by remanufacturers, the definition must be agreed upon by the global remanufacturing community. As quoted by respondent A, “it is important that an accepted definition of remanufacturing be agreed in order to link remanufacturing to CPQ and fully engage with remanufacturers.”
“Data from sensors will be hugely important, but will be product dependent. Depending on the availability and how valuable the data is, it will be hugely important”
All respondents agreed that the intrinsic knowledge of experienced inspectors/remanufacturers will be important in determining the CPQ of a component. However, while respondents agree that this will improve remanufacturing, they suggest that this faces the challenge of identifying the most appropriate transfer mechanism. Benefits such as reduced costs from a better assessment of the component were highlighted, as this should encourage the transfer of intrinsic knowledge. Thus, the short-to-medium-term estimation is that intrinsic knowledge from experienced inspectors and CPQ will be complementary in purpose. However, respondents acknowledged that CPQ will be important for some phases of remanufacture, such as disassembly.
Finally, respondents recommended to have a generic standard for CPQ. Respondents pointed out that remanufacturing already is complicated by the absence of a single globally accepted definition. Standardisation of the CPQ is ideal and should be guided by quality and be product-specific. The potential to link the CPQ to the larger fields of circular economy and product design should support the CPQ and increase the certainty and decision to remanufacture.
4.4. CPQ and Wider Applications
This study demonstrated that the capture of CPQ rates could be used to predict not just the time but also the number of products that could be remanufactured, enabling a forecast that can be used to plan remanufacture and production processes. In addition, adding a degree of automation in inspection would be key for the aforementioned forecasting. However, there is a need for a system that can process and analyse historical data based on the PRM and PRH. Experienced inspectors would be key to gather as much information as possible in order to develop and calibrate this system. The challenge is to find a mechanism to do so that could also help to standardise the data for each product. If this challenge is overcome, data sets could then be used to differentiate one product from another to make the remanufacturing process as efficient as possible. Another challenge would be to replace manual with automated inspections for components that pass a quality threshold. This could be overcome by assessing the CPQ when disassembling a part, as this information could be captured by the CPQ to increase its certainty. Therefore, there will be a point where the product does not need to be further inspected, and the decision would be automated based on the CPQ value.
CPQ has the benefit of reducing costs by using an automated process for inspection, as it allows a more detailed distinction between “go” or “no go” for remanufacture. To scale its impact, CPQ would need to be product specific and, in the long term, it should be considered when designing a product or component. In the future, considering new technologies such as block chain would be imperative to secure how data are gathered and analysed, as well as allowing interconnectivity between the product to be remanufactured and the wider operation system.
Within the wider context of a circular economy, CPQ could be replicated to assess interventions in the product lifecycle, and therefore the identification of the optimal circular economy strategy and the time of intervention for the current life of a product. As demonstrated, data streams would be imperative to understand the factors of influence that affect the product integrity, condition and reliability, and as such developing mechanisms to capture and analyse this data could help to uncover exciting opportunities for creating and quantifying new forms of value within manufacturing.
5. Conclusions and Future Work
first step in using simulation to investigate the concept of CPQ that incorporates data on physical condition, part remanufacturing history, part replacement history and data from sensors to support a more efficient and intelligent remanufacturing process.
Future work will see a characterisation of in-service data streams based on an information-theoretic approach for selecting optimal circular economy strategies and timing of intervention. To achieve this, qualitative research will identify the different types of value generated from circular economy strategies and the factors and costs that influence their implementation. Findings from this qualitative research will inform the data streams to be mathematically characterised, to further calculate the types of value and cost. Research findings will be iteratively applied, tested and evaluated through crosscutting use cases.
Author Contributions:F.C. is the principal investigator of the research grant and contributed to reviewing the structure and content of the manuscript. D.T. is the corresponding author of this manuscript. She developed the simulation models and contributed to manuscript preparation. O.O. helped conduct the interview for the manuscript, analysed the interview responses, analysed the simulation models and contributed to manuscript preparation. M.M. contributed to research activities and arranged interviews with industry. W.H. contributed to research activities and conducted the interviews for the manuscript. A.T. provided supervision of simulation activities.
Funding:This research was funded by The EPSRC Connected Everything Network Plus. This project was also supported by the Royal Academy of Engineering (RAEng) and Airbus under the Research Chairs and Senior Research Fellowships scheme.
Conflicts of Interest: The authors declare no conflict of interest. The underlying data can be accessed at 10.15131/shef.data.8246912
[image:15.595.88.512.429.755.2]Appendix A
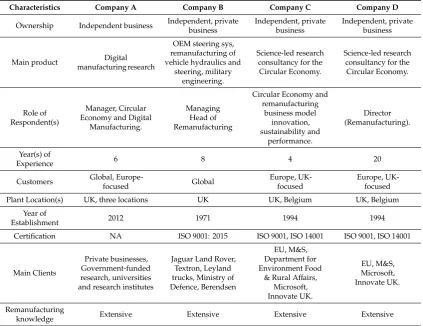
Table A1.Profile of respondents and companies. OEM: original equipment manufacturer.
Characteristics Company A Company B Company C Company D
Ownership Independent business Independent, private
business
Independent, private business
Independent, private business
Main product Digital
manufacturing research
OEM steering sys, remanufacturing of vehicle hydraulics and
steering, military engineering.
Science-led research consultancy for the Circular Economy.
Science-led research consultancy for the Circular Economy.
Role of Respondent(s)
Manager, Circular Economy and Digital
Manufacturing.
Managing Head of Remanufacturing
Circular Economy and remanufacturing business model innovation, sustainability and performance. Director (Remanufacturing). Year(s) of
Experience 6 8 4 20
Customers Global,
Europe-focused Global
Europe, UK-focused
Europe, UK-focused
Plant Location(s) UK, three locations UK UK, Belgium UK, Belgium
Year of
Establishment 2012 1971 1994 1994
Certification NA ISO 9001: 2015 ISO 9001, ISO 14001 ISO 9001, ISO 14001
Main Clients
Private businesses, Government-funded research, universities and research institutes
Jaguar Land Rover, Textron, Leyland trucks, Ministry of Defence, Berendsen
EU, M&S, Department for Environment Food
& Rural Affairs, Microsoft, Innovate UK. EU, M&S, Microsoft, Innovate UK. Remanufacturing
References
1. WRAP. WRAP and the Circular Economy 2017. Available online: http://www.wrap.org.uk/about-us. (accessed on 30 April 2019).
2. Rubmann, M. Industry 4.0 The Future of Productivity and Growth in Manufacturing Industries. The Boston Consulting Group. 2015. Available online:http://www.inovasyon.org/pdf/bcg.perspectives_Industry.4.0_ 2015.pdf(accessed on 30 April 2019).
3. De Sousa Jabbour, A.B.L.; Jabbour, C.J.C.; Godinho Filho, M.; Roubaud, D. Industry 4.0 and the circular economy: A proposed research agenda and original roadmap for sustainable operations.Ann. Oper. Res. 2018,270, 273–286. [CrossRef]
4. Su, B.; Heshmati, A.; Geng, Y.; Yu, X. A review of the circular economy in China: Moving from rhetoric to implementation.J. Clean. Prod.2013,42, 215–227. [CrossRef]
5. Babiceanu, R.F.; Seker, R. Big data and virtualization for manufacturing cyber-physical systems: a survey of the current status and future outlook.Comput. Ind.2016,81, 128–137. [CrossRef]
6. Ellen MacArthur Foundation. Intelligent Assets: Unlocking the Circular Economy Potential. 2016. Available online:www.ellenmacarthurfoundation.org(accessed on 30 April 2019).
7. Lasi, H.; Fettke, P.; Kemper, H.G.; Feld, T.; Hoffmann, M. Industry 4.0 Bus.Inf. Sys. Eng.2014,6, 239–242. [CrossRef]
8. Kang, H.S.; Lee, J.Y.; Choi, S.; Kim, H.; Park, J.H.; Son, J.Y.; Kim, B.H.; Do Noh, S. Smart manufacturing: Past research, present findings, and future directions. Int. J. Precis. Eng. Manuf. Green Tech. 2016,3, 111–128. [CrossRef]
9. Lu, Y. Industry 4.0: A survey on technologies, applications and open research issues.J. Ind. Inf. Int.2017,6, 1–10. [CrossRef]
10. Okorie, O.; Salonitis, K.; Charnley, F.; Moreno, M.; Turner, C.; Tiwari, A. Data-driven approaches for circular economy in manufacturing for digital technologies: a review of current research and proposed framework. Preprints2018. [CrossRef]
11. Hofmann, E.; Rusch, M. Industry 4.0 and the current status as well as future prospects on logistics.Comput. Ind. 2017,89, 23–34. [CrossRef]
12. Despeisse, M.; Baumers, M.; Brown, P.; Charnley, F.; Ford, S.J.; Garmulewicz, A.; Knowles, S.; Minshall, T.H.W.; Mortara, L.; Reed-Tsochas, F.P. Unlocking value for a circular economy through 3D printing: A research Agenda.Technol. Forecast. Soc. Chang.2017,115, 75–84. [CrossRef]
13. Bressanelli, G.; Adrodegari, F.; Perona, M.; Saccani, N. Exploring how usage-focused business models enable circular economy through digital technologies.Sustainability2018,10, 639. [CrossRef]
14. Neely ‘Manufacturing Analytics: The Role of Big Data in the Future of Manufacturing’. Available online: http://cambridgeservicealliance.eng.cam.ac.uk(accessed on 30 April 2019).
15. Towards the Circular Economy Vol. 1–3. Available online: http://www.ellenmacarthurfoundation.org (accessed on 30 April 2019).
16. Saavedra, Y.M.B.; Barquet, A.P.B.; Rozenfeld, H.; Forcellini, F.A.; Ometto, A.R. Remanufacturing in Brazil. Case studies on the automotive sector.J. Clean. Prod.2013,53, 267–276. [CrossRef]
17. Sundin, E. Circular economy and design for remanufacturing. InDesigning for the Circular Economy, 1st ed.; Charter, M., Ed.; Taylor & Francis Group, Routledge: London, UK, 2018; pp. 186–199.
18. SMMT. The Digitalization of the UK Automotive Industry. 2016. Available online:www.smmt.co.uk/reports (accessed on 30 April 2019).
19. Bocken, N.M.P.; Samuel, W.; Short, S.W.; Rana, P.; Evans, S. A literature and practice review to develop sustainable business model archetypes.J. Clean. Prod.2014,65, 42–56. [CrossRef]
20. Glöser-Chahoud, S.; Pfaff, M.; Walz, R.; Schultmann, F. Simulating the service lifetimes and storage phases of consumer electronics in Europe with a cascade stock and flow model.J. Clean. Prod.2019,213, 1313–1321. [CrossRef]
21. Lieder, M.; Asif, F.M.; Rashid, A.; Miheliˇc, A.; Kotnik, S. Towards circular economy implementation in manufacturing systems using a multi-method simulation approach to link design and business strategy. Int. J. Adv. Manuf. Technol.2017,93, 1953–1970. [CrossRef]
23. Turner, C.J.; Hutabarat, W.; Oyekan, J.; Tiwari, A. Discrete event simulation and virtual reality use in industry: new opportunities and future trends.IEEE Trans. Hum. Mach. Syst.2016,46, 882–894. [CrossRef]
24. Bagchi, S.; Chen-Ritzo, C.H.; Shikalgar, S.T.; Toner, M. A full-factory simulator as a daily decision-support tool for 300 mm wafer fabrication productivity. In Proceedings of the Winter Simmer Conference IEEE, Miami, FL, USA, 7–10 December 2008; pp. 2021–2029.
25. Wang, J.; Chang, Q.; Xiao, G.; Wang, N.; Li, S. Data driven production modelling and simulation of complex automobile general assembly plant.Comput. Ind.2011, 765–775. [CrossRef]
26. Azimi, R.; Lee, S.; AbouRizk, S. Intelligent look-ahead scheduling for structural steel fabrication projects. Int. J. Adv. Soft.2011,4, 207–217.
27. Okorie, O.; Salonitis, K.; Charnley, F.; Turner, C. A systems dynamics enabled real-time efficiency for fuel cell data-driven remanufacturing.J. Manuf. Mater. Process.2018,2, 77. [CrossRef]
28. Goodall, P.; Sharpe, R.; West, A. A data-driven simulation to support remanufacturing operations.Comput. Ind. 2019,105, 48–60. [CrossRef]
29. Aras, N.; Boyaci, T.; Verter, V. The effect of categorizing returned products in remanufacturing.IIE Trans. 2004,36, 319–331. [CrossRef]
30. Warken Industrial and Social Ecology PTY LTD. Analysis of lead acid battery consumption, recycling and disposal in Western Australia. 2012. Available online: http://www.batteryrecycling.org.au/wp-content/ uploads/2012/06/120522-ABRI-Publication-Analysis-of-WA-LAB-Consumption-and-Recycling.pdf (accessed on 30 April 2019).
31. Kara, S.; Manmek, S.; Kaebernick, H.; Ibbotson, S. Assessment of products for optimal lifetime.CIRP Ann. 2008,57, 1–4. [CrossRef]
32. Steinhilper, R.Remanufacturing—The Ultimate form of Recycling; Fraunhofer IRB: Stuttgart, Germany, 1998; pp. 255–260.
33. Bras, B.Design for Remanufacturing Processes: Environmentally Conscious Mechanical Design; Wiley: Hoboken, NJ, USA, 2008; pp. 283–318.