Int. J. Electrochem. Sci., 12 (2017) 3916 – 3930, doi: 10.20964/2017.05.44
International Journal of
ELECTROCHEMICAL
SCIENCE
www.electrochemsci.orgEffect of Pre-deformation on Microstructure and Pitting
Corrosion Behavior of UNS S32205
Xu Si, Jun Wu, Yiwei Tang, Jin Li, Yiming Jiang*
Department of Materials Science, Fudan University, Shanghai, 200433
*
E-mail: [email protected]
Received: 23 February 2017 / Accepted: 21 March 2017 / Published: 12 April 2017
The present work studied the microstructure of strain-induced martensite (SIM) in a UNS S32205 DSS under different strains. The material was strained at room temperature from 0 to 30% and the change of microstructure in the duplex stainless steel was investigated by several characterization techniques, such as optical metallographic microscopy (OMM), energy dispersive spectroscopy (EDS), scanning and transmission electron microscopy (SEM), X-ray diffraction (XRD), magnetic properties measurements and HV hardness measurements. In addition, the effects of the SIM on the corrosion behavior in chloride solutions with different pH have been studied. The experimental results showed that the SIM, the magnetization saturation and the micro-hardness values increased as the pre-tensile strain increased from 0 to 30%. The results also revealed that the pitting corrosion resistance was insensitive to the SIM. The pitting potential decreased in acid chloride solution at pH≈2 (3.5 wt.% NaCl+0.01 mol/L HCl) with the increasing of the deformation, however, in 3.5 wt.% NaCl solution and pH≈12(3.5 wt.% NaCl+0.01 mol/L NaOH), the pitting potential was hardly affected by the SIM.
Keywords: Duplex stainless steel, Strain induced martensite, Microstructure characterization, Pitting corrosion behavior
1. INTRODUCTION
(3.0-5.0 wt.%) and nickel (6.0-8.0 wt.%) as well as nitrogen (0.24-0.32 wt.%) shows greater strength and better corrosion resistance than ordinary duplex stainless steels, thus are widely used in high chloride environments, such as the marine and petrochemical industries [6]. However, due to the cost and price fluctuations of alloys, UNS S32101 with less chromium (21%-22 wt. %), molybdenum (0.1-0.8 wt.%), nickel (1.35-1.7 wt.%) and nitrogen (0.20-0.25 wt.%) has been developed as a typical lean DSS. It is increasingly used in nuclear plant and building structure thanks to its higher yield strength, better pitting corrosion resistance but lower cost than 304 austenite stainless steel [7,8].
A number of studies on the plastic deformation effects in austenite stainless steels have been reported [9-12]. It is found that plastic deformation gives rise to structural refinement and martensite transformation [13,14]. Recently, transformation induced plasticity (TRIP) effect has been studied extensively in duplex stainless steels in order to improve the greater ductility [15]. The TRIP mechanism is based on deformation-stimulated displacive transformation of metastable austenite to martensite, which remarkably improves both strength and ductility of the stainless steel. The SIM formation is related to many parameters, such as temperature, strain rate and stacking fault energy (SFE). Marco et al. [16] have proposed that the austenite-to-SIM is related to the stability of retained-austenite and the stacking fault energy (SFE). The retained-austenite-to-SIM transformation was frequently found in lean DSSs in virtue of their lower SFE and the stability of retained-austenite than the higher-alloyed DSSs such as UNS S32205 DSS. Guo et al. [17] have revealed the characteristic of SIM in the 2002 DDS under different strains and the effect of SIM on different aspects. It is generally believed that TRIP occurred in austenite with the SFE less than 20 mJ/m2. The empirical typical equation
calculating SFE for stainless steels proposed by Schramn et al[18]. SFE(mJ/m2) = -53+6.2%Ni+0.7%Cr+3.2%Mn+9.3%Mo (1)
Recently Guo et al. [17] have reported that the sequence of martensitic transformations in UNS S32002 DSS is γ → ε → α’ under the strain deformation. Sudipta et al. [19] have also examined the martensite transformed in UNS S32205 DSS under cold rolling.
Duplex stainless steels are widely used in marine environments because of their good resistance to the pitting corrosion. Pitting corrosion of stainless steel is one of the most dangerous forms of local corrosion. The corrosion resistance of duplex stainless steel relates to the alloy content, heat treatment, pH and the microstructure etc. There are papers reporting the influence of phase on the pitting corrosion of stainless steel. For example, Tsai et al. [20] have revealed the selective dissolution of constitution phases in mixed H2SO4/HCl solutions under different potentials. Alvarez et al. [21]
studied the corrosion behaviour of two corrugated lean duplex stainless steels (SAF 2001 and 2304 grades) in eight alkaline solutions (carbonated and non-carbonated, saturated Ca(OH) 2 solutions with
different chloride contents). Guo et al. [17] have reported that the pitting corrosion resistance was insensitive to the SIM and the SIM effect on pitting corrosion both in neutral and acid solutions.
X-ray diffraction (XRD), magnetic properties measurements, HV hardness measurements to analysis the change of microstructure, the corrosion resistance was investigated by several electrochemical measurements.
2. EXPERIMENTAL
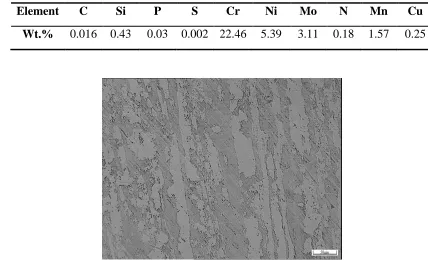
The material for examinations was delivered in the form of sheet-cutting steel with dimensions about 250 mm × 30mm × 1.5 mm. The chemical composition of the duplex stainless steel UNS S31803 was shown in Table 1. Then samples were subjected to pre-tensile ranging from 5%, 10%, 15%, 20% to 30%, using an Instron 5985 testing machine according to BS EN ISO6892-1:2009. The uniaxial tensile tests were conducted at room temperature at a strain rate of 3 mm/min. Rectangular specimens with a dimension of 10 mm × 10 mm were cut from these tensile specimens for further study. The specimens were solution treated at 1050℃ for 1h in an arc furnace, then followed by water quenching to obtain the best mechanical and corrosion resistance properties.[22, 23]. Metallographic specimens were etched in a Beraha reagent (20 mL hydrochloric acid, 80 mL distilled water, and 0.3 g potassium metabisulfite). The white region in Fig.1 corresponds to the austenitic phase (γ) while the gray region is the ferritic phase (α). The microstructure was observed using optical metallographic microscopy (OMM) and scanning electron microscopy (SEM, Philips XL 30 FEG) after etching procedure. The major alloying elements in the individual phases were analyzed by energy dispersive spectroscopy (EDS, Philips XL 30 FEG) and were shown in Table 2.
Table 1. Chemical composition of the sample (wt.%)
Element C Si P S Cr Ni Mo N Mn Cu
Wt.% 0.016 0.43 0.03 0.002 22.46 5.39 3.11 0.18 1.57 0.25
[image:3.596.76.504.471.740.2]
Measurements of the magnetization saturation were performed in a vibrating sample magnetometer (Quantum Design, USA). The micro hardness with 100g was measured in a HMV-2TADW micro-hardness tester (Shimadzu Corporation, Japan). The ferrite detector measurements were repeated in at least ten different fields on the surface of the same specimen, and the average data was calculated as the volume fraction values of ferromagnetic phase.
X-ray diffraction tests were carried out through a D8 ADVANCE X-ray diffractometer with DAVINCI. DESIGN (Bruker Corporation, Germany) using Cu Kα (λ=0.154056 nm) radiation and operated at 40 kV and 20 mA, in the step-scan mode with a step size of 0.01°. The diffraction spectra have a 2θ angular range from 40 to 120°.
The electrochemical tests were performed with a CHI660D workstation (Shanghai Chenhua Instrument Co., Ltd, Shanghai, China). The corrosion test consisted of critical pitting temperature (CPT) test according to ASTM G 150-99 [22] and potentiodynamic polarization curve measurement according to ASTM G 59-97 [23]. All the potentials were measured with respect to a saturated calomel electrode (SCE) as a reference electrode, a platinum slice was used as the counter electrode. CPT test was conducted in solution of l mol/L NaCl via potentiostatic electrochemical method by applying a constant potential of 750 mV and increasing the solution temperature at a constant rate of 1℃/min from 2℃. The corresponding current was recorded simultaneously as the temperature increased during the test. The experiment was terminated when the current density reached 100 µA/cm2 and kept surging for 1min. The temperature at which the current density was 100 µA/cm2 was recorded as a CPT.
The pitting potential was identified as the potential at which the current density continuously exceeded 100 µA/cm2. To avoid the crevice corrosion, interfaces between specimen and resin were sealed with silica gel sealant and dried in air. The exposed electrode surface area was 10mm2. The test solution was prepared with analytical grade reagent and distilled water. Before and during the test, pure nitrogen gas (N2) was passed into the electrolyte to get rid of the oxygen gas (O2) for 30 min and
maintained throughout the test. Potentiodynamic polarization curve measurements were conducted in the solution of 3.5 wt.% NaCl, 3.5 wt.% NaCl+0.01 mol/L HCl and 3.5 wt.% NaCl+0.01 mol/L NaOH at 60℃ with a scan rate of 0.1667 mV/s from -0.8 V versus SCE to the pitting potential (Epit.) versus
SCE. In addition, before the CPT and the potentiodynamic polarization measurement, cathodic polarization at -900 mV versus SCE for 2min was employed to deoxidize the surface of the working electrode, followed by stabilization at open circuit potential for 30min. Each type of electrochemical testing was repeated at least six times, and the average data were chosen as the CPT and Epit values in
this work.
3. RESULT AND DISCUSSION
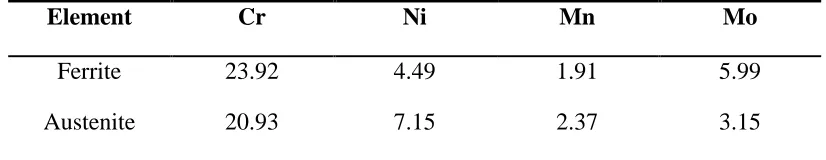
means of SEM with backscattered electron was presented in Fig.2. The major alloying elements of the bipolar phases were analyzed using energy dispersive spectroscopy (EDS) which were listed in Table 2.
[image:5.596.169.426.121.291.2]Figure 2. SEM morphologies of the specimen before deformation
Table 2. EDS results of the major alloying elements (wt.%) of martensite and austenite phase in UNS S32205 DSS
Element Cr Ni Mn Mo
Ferrite 23.92 4.49 1.91 5.99
Austenite 20.93 7.15 2.37 3.15
The susceptibility to deformation induced martensite transformation increase with the decrease of SFE. When the value of SFE < 18 mJ/m2and the molar Gibbs energy of the martensite reaction γfcc→α’Ms bcc is negative, martensite formation—either ε-martensite by γfcc→εMs hcp or, for even lower
SFE’s, α’–martensite formation by γfcc→εMs hcp→α’Ms bcc—becomes the favored transformation mechanism
that affects the further deformation of the material[24-26]. According to calculation of equation (1), the SFE of UNS S31803 was about 30 mJ/m2. But this equation was applied for austenite stainless steel. Therefore, it needs to be further explored whether the SIM in the UNS S32205 after the strain deformation.
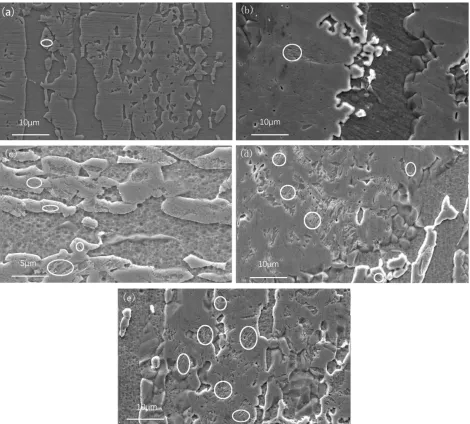
[image:5.596.91.504.388.468.2]
Figure 3. Microstructure of the specimens after different pre-tensile deformations (a) 5%, (b) 10%, (c) 15%, (d) 20%, (e)30%
40 50 60 70 80 90 100 110 120 130
1000 2000 3000 4000 5000 6000 7000 8000
(200)
(110)
(200)
(111)
(110)
30%
15% 20%
10%
5%
Intensity
(c
o
u
n
ts)
2
0
[image:7.596.146.423.93.294.2]Figure 4. X-ray diffraction patterns samples subjected to the different strain.
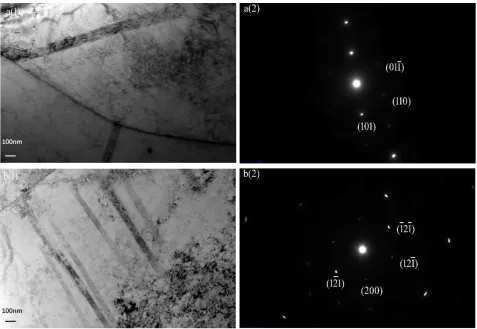
Figure 5. TEM micrographs of the specimens deformed at different strains (a)5%, (b)30%
[image:7.596.63.540.340.669.2]
Fig. 5c exhibited the presence of SIM as dark phase and austenite as bright phase. It was easy to find out that the SIM were generated in austenite grains. Moreover, the orientation relationship of strain induced ε-martensite was not detected by SEM as well as the XRD patterns, which might be a consequence of the higher SFE.
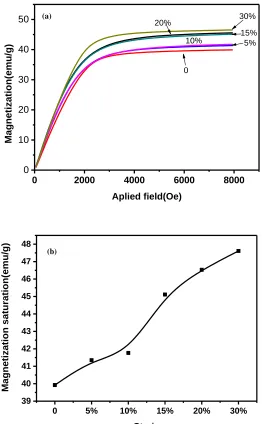
As we all know, the ferrite and α'-martensite were ferromagnetic phase, so the quantification of SIM could be realized by the magnetic saturation measurements. Figs. 6a-b display magnetization curves and magnetization saturation of the specimens with different tensile strains. As can be seen in these figures, the magnetization saturation increased with strain deformation increased from 0 to 30% of samples. This was due to the formation of the SIM (γ → α’) and the value of SIM increasing with the deformation.
0 2000 4000 6000 8000
0 10 20 30 40 50
M
agn
etiza
tion
(emu/g
)
Aplied field(Oe)
0
5% 10%
15%
20% 30%
(a)
0 5% 10% 15% 20% 30%
39 40 41 42 43 44 45 46 47 48
M
agn
etiza
tion
saturati
on(emu/
g)
Strain
(b)
[image:8.596.158.420.263.687.2]
Fig.7 exhibits the variation of the micro hardness with the deformation. By comparing the Fig. 6(b) and Fig. 7, a similar linear relationship between them can be found. From the figures, it was clearly observed that the Vickers hardness increased with the increasing of the strain from 240 to 337. This phenomenon could be caused by the formation of SIM which had higher hardness than austenite or ferrite.
0 5% 10% 15% 20% 30%
200 225 250 275 300 325 350
Micr
o
h
a
r
d
n
e
ss
(HV
)
Strain
Figure 7. HV hardness with different pre-tensile strains with different tensile
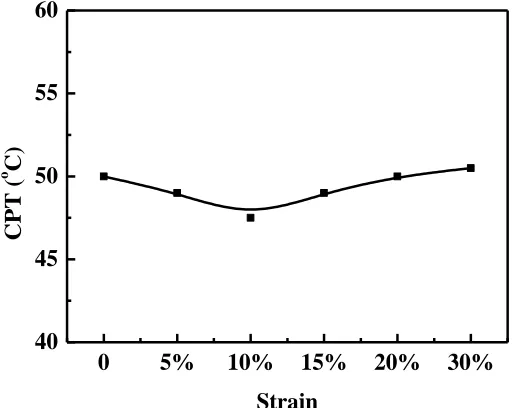
The critical pitting temperature of materials is a significant parameter for the corrosion resistance. Figs.8-9 illustrate the CPT of specimens under different deformations by applying 750mV vs SCE in l mol/L NaCl deaerated neutral solution initially at 0°C. After an initial temperature stabilization period (the surface of samples was protected by the passivation film and the current density presented a numerical value less than 1μA/cm2
), the solution was heated at a constant speed of 1 °C/min.
0 10 20 30 40 50
0 50 100 150 200 250
Curr
e
n
t density
(
A/c
m
2 )
[image:9.596.153.418.177.383.2]Temperature (oC) 0 5% 10% 15% 20% 30%
[image:9.596.169.406.539.720.2]
The current is monitored during the temperature scan, and the CPT is defined as the temperature at which the current increases rapidly (passive film breakdown). However, for practical reasons the CPT was recorded as the temperature at which the current density exceeds 100 μA/cm2 for 60s during the tests. Fig. 9 shows the numerical values of the CPT derived from different deformations were very close. Besides, the fluctuation range of the CPT had not gone beyond 4 °C. The CPT testing results manifested that the SIM did not affect CPT value of the UNS S32205 DDS.
0 5% 10% 15% 20% 30%
40 45 50 55 60
CPT (
o C)
Strain
Figure 9. The average CPT values of specimens with different tensile strains
The cathodic Tafel constant (βc), anodic Tafel slope (βa), corrosion potential and corrosion
current density according to the polarization curve were fitted with the software provided by the CHI660D potentiostation. The result of potentiodynamic polarization obtained in pH≈2 solution (3.5 wt.% NaCl + 0.01 mol/L HCl) at 60 °C (above the CPT acquired by Fig. 8) was presented in Fig. 10. The polarization curves exhibits that the strain deformation’s impacted the corrosion behavior of the UNS S32205 DDS. The fitted corrosion parameters achieved by the polarization curves were presented in the Table 3. It is well-known that the material is less stable with negative corrosion potential (Ecorr)
and it is generally more prone to suffer serious corrosion. However, the material would suffer less attack if it applied with positive potential. On the other hand, the material with lower pitting potential was more susceptible to the pitting corrosion. In acid solution curves, it was clearly observed that the passive current density nearly had no change and the length of the passive regions of the polarization curves decreased with the increasing of the deformation. Besides, both the undeformed and deformed specimens exhibited similar corrosion potential. However, with the strain deformation increasing from 0 to 30%, the Epit decreased from 317mV to 262mV. These results indicate that the SIM influenced the
corrosion resistance of samples in the acid solution and the high local dislocation density might contribute to the weakness of the corrosion resistance. Besides, the test results of Epit suggested that the
[image:10.596.161.417.208.412.2]
-0.8 -0.6 -0.4 -0.2 0.0 0.2 0.4
-10 -9 -8 -7 -6 -5 -4 -3 -2 lo g (i/ A c m -2 ) Potential/V 0 5% 10% 15% 20% 30%
[image:11.596.146.422.92.297.2]Figure 10. Potentiodynamic polarization curves for the specimens with different pre-tensile strains in 3.5 wt.% NaCl+0.01 mol/L HCl solution (pH≈2)
Table 3. Corrosion parameters of the samples studied in 3.5 wt.% NaCl+0.01 mol/L HCl solution
Sample-strain
βc (V/dec) βa (V/dec) Ecorr(mV)vs.
SCE
log(icorr) (A
cm -2 )
logip (A cm -2
)
Epit (mV)
vs. SCE
0% 0.154 1.175 -317 -5.07 -6.07 317
5% 0.131 1.199 -308 -5.24 -6.17 296
10% 0.171 0.863 -318 -5.11 -6.15 284
15% 0.151 0.991 -321 -5.03 -6.06 268
20% 0.224 1.260 -318 -4.83 -6.07 267
30% 0.234 0.871 -301 -4.91 -6.07 262
-0.8 -0.6 -0.4 -0.2 0.0 0.2 0.4 0.6
-10 -9 -8 -7 -6 -5 -4 -3 -2 lo g (i/ A c m -2 ) Potential/V 0 5% 10% 15% 20% 30%
[image:11.596.35.548.387.721.2] [image:11.596.160.414.488.717.2]
Table 4. Corrosion parameters of the samples studied in 3.5 wt.% NaCl solution
Sample-strain
βc (V/dec) βa (V/dec) Ecorr(mV)vs.
SCE
log(icorr) (A
cm -2 )
logip (A cm -2
)
Epit (mV)
vs. SCE
0% 0.120 0.507 -244 -6.56 -6.34 454
5% 0.113 0.545 - 257 -6.32 -6.41 451
10% 0.123 0.565 -236 -6.44 -6.26 452
15% 0.134 0.572 -256 -6.59 -6.29 455
20% 0.107 0.562 -267 -6.47 -6.34 452
30% 0.137 0.594 -268 -6.58 -6.37 456
-0.8 -0.6 -0.4 -0.2 0.0 0.2 0.4 0.6 0.8 1.0
-11 -10 -9 -8 -7 -6 -5 -4 -3 -2 lo g (i /A cm -2 ) Potential/V 0 5% 10% 15% 20% 30%
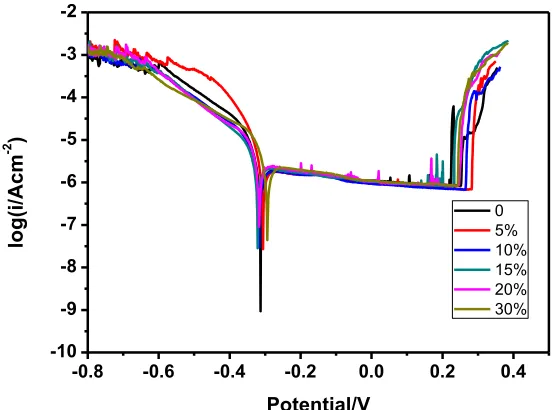
Figure 12. Potentiodynamic polarization curves for the specimens with different pre-tensile strains in 3.5 wt.% NaCl +0.01 mol/L NaOH solution (pH≈12)
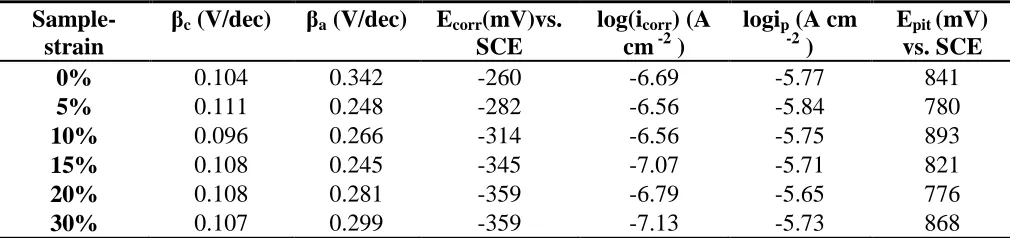
Table 5. Corrosion parameters of the samples studied in 3.5 wt.% NaCl +0.01 mol/L NaOH solution
Sample-strain
βc (V/dec) βa (V/dec) Ecorr(mV)vs.
SCE
log(icorr) (A
cm -2 )
logip (A cm -2
)
Epit (mV)
vs. SCE
0% 0.104 0.342 -260 -6.69 -5.77 841
5% 0.111 0.248 -282 -6.56 -5.84 780
10% 0.096 0.266 -314 -6.56 -5.75 893
15% 0.108 0.245 -345 -7.07 -5.71 821
20% 0.108 0.281 -359 -6.79 -5.65 776
30% 0.107 0.299 -359 -7.13 -5.73 868
Fig. 11 exhibits the polarization curves which reflected the pitting corrosion behavior of the specimens in neutral solution after different pre-strains tensile. The corresponding corrosion parameters were listed in Table 4. As could be seen in Table 4, both the undeformed and deformed specimens exhibited similar pitting potential (Epit). Meanwhile, the corrosion potential with different
[image:12.596.86.514.133.456.2] [image:12.596.152.417.259.461.2] [image:12.596.45.550.538.657.2]
suggests that SIM had no obvious influence on the pitting corrosion resistance of the specimens in neutral chloride solution.
The result of potentiodynamic polarization obtained in the alkaline solution was presented in Fig.12. The corresponding corrosion parameters were listed in Table 5.
In contrast with the corrosion parameters in different solution, it was easily found that the Tafel slops didn’t change obviously under the same pH. However, the values of Tafel slopes varied differentially in the solution under different pH. The different values of cathodic Tafel slope (βc)
suggested that the different mechanism of cathodic reaction occurred in different solution (hydrogen evolution in acid chloride solution, oxygen reduction reaction in acid and neutral chloride solution) [27]. Therefore, it could be found that the values of cathodic Tafel slope were similar both in acid and neutral chloride solution. Moreover, the values of anodic Tafel slope (βa) increased with the decreasing
of pH in chloride solution. It therefore needs some other corrosion parameters to discuss the corrosion situation.
The Epit of samples under the same deformation increased with the increasing of the pH. The
Epit of samples in acid solution and neutral solution under the same deformation didn’t have big
difference; however, there was a high promotion in alkaline solutions. The appearance of the polarization curves in the alkaline solution was much different of that in acid and neutral chloride solution, which might also result from the different corrosion mechanism.
The cathodic reactions possibly occurred in acid and neutral chloride solution, as the following Eqs:
2H++ 2e-→H2↑(2)
2H2O+2e-→2OH-+H2(3)
O2+2H2O+4e-→4OH-(4)
The anodic reactions are mainly the iron dissolution, and other alloys dissolution, as Eq.5: M→M2+
+ 2e- (M replaces Fe, Cr, Ni)(5)
In the alkaline solutions the curves were different from the curves correspond to neutral solution and acid solution. The current gently increased at 700 mV vs. SCE instead of increasing rapidly in the neutral solution or acid solution. This may be due to the transpassivation reaction of the samples correspond to the reaction, as Eq.6:
4OH-→2H2O+O2+4e- (6)
However, when the potential increased around 800 mV, the current density increased rapidly. When the potentiodynamic polarization curves was terminated at 700mV, the pits could not be observed under the optical microscope. Observation results showed that the pitting corrosion took place in the period of rapid current growth. Nevertheless, the current increased slightly around at 300mV vs. SCE. The reason was that insoluble passive film started to dissolve corresponding to the reaction, as Eq7;
Cr2O3+OH-→5H2O+2CrO 4+6e
(7)
Therefore, there was no breakdown of the passive layer in the reaction (5), the pitting corrosion occurred in reaction (6) when potential was around 800mV because of the dissolution of the film-. This explained why the Epit of samples were similar in acidic and neutral solution while the Epit of samples
in alkaline solution were dispersed compared with that in neutral or acid solution, this may be due to the Epit obtained by the potentiodynamic polarization curve measurement was unique, even with a
great randomness. Meanwhile, the passivation current had no obvious change in different pH solutions which meant the passivation of UNS S32205 DSS was hardly affected by the SIM.
In the end, the corrosion potential of 30% deformed specimens was -359mV the same as the specimen under the strain deformation on 20%, lower than that of other deformed specimens which might be attributed to the high dislocation density in strain induced by α’-martensite.
Some authors reported corresponding investigations in this field. Wang et al. [28] found that the film generated in the alkaline solution was greater in intensity and thickness, so as to inhibit pitting corrosion. This is due to a relatively thick and compact passive film formed in an alkaline solution as result of preventing efficiently the matrix metal from being affected by the solution. Prawoto et al. [29] found that the UNS S32205 corrosion rate increased with the decreasing of pH. Albrimi et al. [30] concentrated on austenitic stainless and found the corrosion sensitivity increase with the increase of hydrogen ion concentration in media containing chloride ions. Loto et al. [31] focused on ferritic stainless steel and found the corrosion rate of stainless steel was affected by the pH. Leban et al. [32] studied the deformation-induced martensite of AISI 321 and found that the martensite could cause the initiation of pitting corrosion. In agreement with the works mentioned above, it is found that the corrosion resistance of UNS S32205 was affected by the SIM. The corrosion potential of martensitic is lower than the austenite and ferrite. Therefore, the martensitic is more susceptible to pitting corrosion than other phases in the duplex stainless steel. Moreover, we found that the amount of SIM increased with the increasing of the strain deformation, the strain duplex stainless steel was more sensitive to pitting corrosion in acid chloride solution.
4. CONCLUSIONS
In this paper, the effects of plastic deformation and SIM in a UNS S32205 DSS were investigated. Conclusion can be drawn as followed:
1. The sequence of martensitic transformations in UNS S32205 DSS was γ →α’. The amount of SIM increased with the increasing of the strain deformation.
2. The Vickers micro-hardness increased linearly from 240 to 337 with the increase of the strain, and the magnetization saturation increased monotonically, which arises from the transformation of the induced plasticity.
3. The pitting potential decreased in acid chloride solution at pH≈2 (3.5 wt.% NaCl+0.01 mol/L HCl) with the increase of the deformation, however, in 3.5 wt.% NaCl solution and pH≈12 (3.5 wt.% NaCl+0.01 mol/L NaOH), the pitting corrosion was hardly effected by the SIM.
ACKNOWLEDGMENT
The authors acknowledge the supports of the National Natural Science Foundation of China (Grants No. 51671059, 51501041, 51371053).
References
1. J.O. Nilsson, Mater. Sci. Tech.-Lond., 8 (1992) 685-700.
2. J.O. Nilsson, A. Wilson, Mater. Sci. Tech.-Lond., 9 (1993) 545-554.
3. C. Blawert, A. Weisheit, B.L. Mordike, F.M. Knoop, Surf. Coat. Tech., 85 (1996) 15-27. 4. J. Charles, Steel Res. Int., 79 (2008) 455-465.
5. S.M. Wessman, S. Hertzman, R. Pettersson, R. Lagneborg, M. Liljas, Mater. Sci. Tech.-Lond., 24 (2008) 348-355.
6. J. Gong, Y.M. Jiang, B. Deng, J.L. Xu, J.P. Hu, J. Li, Electrochim. Acta, 55 (2010) 5077-5083. 7. W. Zhang, L. Jiang, J. Hu, H. Song, Mater. Charact., 60 (2009) 50-55.
8. L. Zhang, W. Zhang, Y. Jiang, B. Deng, D. Sun, J. Li, Electrochim. Acta, 54 (2009) 5387-5392. 9. I. Altenberger, B. Scholtes, U. Martin, H. Oettel, Mat. Sci. Eng. A-Struct., 264 (1999) 1-16. 10.W. Hubner, Tribol. Int., 34 (2001) 231-236.
11.G. Frommeyer, U. Brux, P. Neumann, Isij Int., 43 (2003) 438-446.
12.H.F.G.D. Abreu, S.S.D. Carvalho, P.D. Lima Neto, R.P.D. Santos, V.N. Freire, P.M.D.O. Silva, S.S.M. Tavares, Materials Research, 10 (2007) 359-366.
13.A. Weisbrodt-Reisch, M. Brummer, B. Hadler, B. Wolbank, E.A. Werner, Mat. Sci. Eng. A-Struct., 416 (2006) 1-10.
14.B. Soylu, R. Honeycombe, Mater. Sci. Tech.-Lond., 7 (1991) 137-145. 15.C. Herrera, D. Ponge, D. Raabe, Acta Mater., 59 (2011) 4653-4664.
16.M. Breda, K. Brunelli, F. Grazzi, A. Scherillo, I. Calliari, Metall. Mater. Trans. A, 46A (2015) 577-586.
17.Y. Guo, J. Hu, Y. Jiang, J. Li, Int. J. Electrochem. Sc., 11 (2016) 4812-4827. 18.R.E. Schramm, R.P. Reed, Metall. Trans. A, 6 (1975) 1345-1351.
19.S. Pramanik, S. Bera, S.K. Ghosh, Steel Res. Int., 85 (2014) 776-783. 20.W.T. Tsai, I.H. Lo, Corrosion, 64 (2008) 155-163.
21.S.M. Alvarez, A. Bautista, F. Velasco, Corros. Sci., 53 (2011) 1748-1755.
22.A. Kashiwar, N.P. Vennela, S.L. Kamath, R.K. Khatirkar, Mater. Charact., 74 (2012) 55-63. 23.H. Ha, M. Jang, T. Lee, J. Moon, Corros. Sci., 89 (2014) 154-162.
24.W.J. Babyak, F.N. Rhines, Trans. Am. Inst. Min. Metall. Eng., 218 (1960) 21-23. 25.G.B. Olson, M. Cohen, Metall. Trans. A, 6 (1975) 791-795.
26.S. Allain, J.P. Chateau, O. Bouaziz, Mat. Sci. Eng. A-Struct., 387 (2004) 143-147. 27.R.T. Loto, C.A. Loto, Int. J. Electrochem. Sc., 7 (2012) 9423-9440
28.Y. Wang, G. Cheng, W. Wu, Q. Qiao, Y. Li, X. Li, Appl. Surf. Sci., 349 (2015) 746-756. 29.Y. Prawoto, K. Ibrahim, W.B.W. Nik, Arab. J. Sci. Eng., 34 (2009) 115-127.
30.Y.A. Albrimi, A. Eddib, J. Douch, Y. Berghoute, M. Hamdani, R.M. Souto, Int. J. Electrochem. Sc., 6 (2011) 4614-4627.
31.C.A. Loto, R.T. Loto, Int. J. Electrochem. Sc., 7 (2012) 11011-11022. 32.M.B. Leban, R. Tisu, Eng. Fail. Anal., 33 (2013) 430-438.