ASSESSING THE
POTENTIAL FOR
KNOWLEDGE-BASED
DEVELOPMENT IN
TRANSITION
COUNTRIES
REINHILDE VEUGELERS
Highlights
• Transition economies that formerly were within the Soviet Union’s political and economic sphere had on the eve of the crisis much lower GDPs per capita than the EU15 or the United States, despite exhibiting higher growth. In part, increasing total-factor productivity (TFP), a ‘residual’ growth factor commonly interpreted as reflecting technological progress, was behind higher growth rates.
• This paper zooms in on this TFP contribution to growth in the transition countries of central and eastern Europe, the Caucasus and Central Asia, in order to identify which countries have established a knowledge-based growth path or have the potential to develop one in the near future. • We start by looking at how the transition countries covered
by the working paper measure up according to traditional innovation input and output indicators. But the major part of our analysis focuses on identifying countries’ potential for future knowledge-based growth.
• Few transition economies have highly-developed innovation profiles. Analysis of the prerequisites for knowledge-based growth indicates that transition countries are at a systemic disadvantage relative to the US, EU15 and Japan, and have limited potential for knowledge-based growth.
Bruegel gratefully acknowledges the support of the German Marshall Fund of the United States to research underpinning this publication.
B
R
UE
G
EL W
O
RKIN
G P
A
P
ER
2010/01
Assessing the potential for knowledge-based development in the transition
countries of central and eastern Europe, the Caucasus and Central Asia
By
Reinhilde Veugelers
Senior Research Fellow at Bruegel and Full Professor, University of Leuven
1.
Introduction
Transition countries – those that formerly were within the Soviet Union’s political and economic sphere – had on the eve of the crisis much lower GDPs per capita than the EU15 or the United States, despite having higher growth rates. In addition, transition countries exhibited great heterogeneity in their pre-crisis growth performances, and the crisis has not reduced this heterogeneity (see Darvas, 2009).
Scholars have identified two major drivers behind the pre-crisis growth acceleration of transition countries, namely positive terms-of-trade shocks and total-factor productivity (TFP), a ‘residual’ growth factor commonly interpreted as reflecting technological progress1. Using a growth-accounting framework, Iradian (2009), for instance, finds that the strong growth seen in many transition countries has been driven largely by TFP growth; however he also found wide heterogeneity across countries in the contribution of TFP to growth2.
In this working paper, we zoom in on this TFP contribution to growth in the transition countries of central and eastern Europe, the Caucasus and Central Asia (CEECCA)3. More particularly, we want to identify which CEECCA countries have developed a knowledge-based growth path or have the
potential to develop one in the near future. As a knowledge-based growth path gives countries a greater ability to adapt to globalisation and technological change, our analysis may shed some light on these countries’ post-crisis prospects as they try to follow more sustainable and robust growth paths.
We start by looking at how CEECCA countries measure up according to traditional innovation input and output indicators. But as most CEECCA countries are not yet sufficiently
1 As a 'residual', TFP basically accounts for effects in total output growth not caused by capital and labour. TFP is
commonly interpreted as a measure of the technology of production and its rate of growth as a measure of technical progress (World Bank, 2008, p.54). TFP calculations are plagued by substantial measurement errors and are notoriously hard to perform for transition countries.
2
Iradian's (2009) TFP calculations for 1996-2006 showed that the average annual TFP growth in the Commonwealth of Independent States (CIS) was higher than in central European and in six south-east European economies, but was lower than in the Baltic states. In the CIS region, the contribution of TFP to growth was highest in countries such as Armenia, Tajikistan, Ukraine, Azerbaijan, Georgia, Kazakhstan and Russia, but low in Kyrgyzstan, Moldova, Mongolia and Uzbekistan. The central and eastern European (CEE) region also exhibits wide heterogeneity, with the Baltic states and Poland scoring high in terms of the TFP contribution, while Romania, Bulgaria and the Czech Republic score low. For the countries that joined the European Union in 2004 and 2007, Veugelers & Mrak (2009) also report the contribution of TFP to growth, using EC-Ameco numbers. The country results are different, underscoring the sensitivity of TFP calculations. Veugelers and Mrak find the highest scores for the Czech Republic and Slovakia (respectively 63 percent and 55 percent), and the lowest value for Bulgaria (24 percent).
3 The countries covered by this paper are therefore: Albania, Armenia, Azerbaijan, Belarus, Bosnia Herzegovina,
developed, and therefore score very low on these traditional indicators, the major part of our analysis will be focused on identifying their potential for future knowledge-based growth. To this end, we will assess CEECCA countries on how they score in areas that have been identified in the literature as prerequisites for knowledge-based growth. We will take into account the different stages of development of CEECCA countries. In particular, we will take into account how countries combine technology-acquisition and technology-creation strategies (which we will call in this paper 'technology-buy' and 'technology-make'), depending on how far they have progressed towards the realisation of knowledge-based growth. Technology-buy is more important during the earlier part of this process, whereas technology-make becomes more significant when the country has moved closer to the technology frontier. We accordingly distinguish prerequisites that are important for technology-buy from those that are more important for technology-make.
Our empirical methodology uses a mixture of hard information and more subjective survey evidence from the World Economic Forum Global Competitiveness Index (WEF-GCI).
Section 2 screens the literature on transition, for insights on prerequisites for knowledge-based growth. Section 3 discusses the empirical measures we use for assessing CEECCA countries’ innovation performance and how they score on the prerequisites for knowledge-based growth. Section 4 presents the results, culminating in a list of countries with the potential for knowledge-based growth. We find that only four countries among the sufficiently innovation-active CEECCA countries qualify: the Czech Republic, Estonia, Lithuania and Slovenia. Other innovation-active CEECCA countries, including Hungary, Poland and Russia, have at least one obstacle to, or several weaknesses in, establishing the prerequisites for knowledge-based growth.
2. Prerequisites for knowledge-based growth
Countries in early phases of development lack the capability to develop frontier technologies. This implies that technological progress in these countries happens mainly through the adoption and adaptation of technologies developed elsewhere. Nevertheless, how technological progress is made and the relationship between growth and technological progress are complex and vary as time passes. Verspagen (1991, 1992) identifies three phases in the technological development process. During the first or pre-catch-up phase, technological progress does not contribute to growth. At best, countries in this phase are laying the foundations for knowledge-based growth, such as a better education system. In the second or actual catch-up phase, technology absorption gradually increases. Finally, there is a post-catch-up phase during which the country begins to develop the capability to conduct its own research and development. We will describe for each of these three phases how technological progress comes about and what the prerequisites are for knowledge-based growth.
2.1.Knowledge-based catching-up along the development path
In economies with very low levels of development, take-up of technology is absent or slow, in part because of the cost of new technologies, in part because insufficient human capital severely constrains technological progress.
There are two key ingredients for effective technology take-up. The first is access to (foreign) technology. Trade flows, foreign direct investment (FDI) and other forms of international cooperation are the key channels that determine how successful a country will be in tapping the global pool of existing technologies.
Foreign trade is an extremely important channel through which embodied technological knowledge (intermediate and final goods and services) is transferred between developing countries and their technologically more advanced partners. Both sides of foreign trade, imports and exports, are linked to the technological-transfer process. Through imports of technologically-intensive products, developing countries can raise the quality of their products/services as well as the efficiency with which they are being produced. On the export side, new technology is absorbed through a learning-by-exporting process in which exporters interact with foreign customers and competitors.
FDI is another channel through which technological knowledge can flow across borders. Although the entry of foreign affiliates increases the competitive pressure on local producers, the production and/or research activities undertaken by multinational affiliates can confer spillover benefits to the local economy. Knowledge may flow from the affiliate to local producers through formal and informal contacts, or by trained affiliate personnel taking jobs with local firms (eg Blomström & Kokko, 1998).
Second, the effectiveness of these channels for effective technology take-up depends on a country’s
absorptive capacity. External (foreign) knowledge needs to be combined with a sufficiently developed 'absorptive capacity' (Cohen and Levinthal, 1990) or 'social capability' (Abramovitz, 1986), in order to deliver growth.
This absorptive capacity depends on many factors, including the extent to which a country: has a technologically-literate workforce and a highly-skilled elite; promotes a pro-investment climate; permits the creation and expansion of firms using higher-technology processes; permits access to capital; and has adequate public-sector institutions to promote the take-up of critical technologies when private demand or market forces prove inadequate (World Bank, 2008).
As countries develop further and get closer to the technology frontier, another factor that explains heterogeneity of technology take-up comes into play, namely divergence in countries' own indigenous innovative capacity (Hoekman et al, 2005). First, a country's own R&D complements the take-up of existing technology because it is a component of absorptive capacity. Foreign technologies frequently need to be modified so that they are suitable for domestic circumstances. Countries tend to acquire technology more readily when domestic firms have R&D programmes and when public research laboratories and universities have relatively close ties to industry. But, at higher levels of development, a country's own R&D can increasingly substitute adoption of existing technologies, allowing the generation of new technologies, particularly in sectors in which the country has developed some comparative strengths.
well-functioning (risk) capital markets give innovators access to capital to finance their risky projects. High-tech start-ups, often an important source of breakthrough innovations, particularly need access to venture capital.
2.2.Empirical evidence on knowledge-based development
Empirical research confirms the importance of technological progress for development (Nelson, 1993; RINDICATE, 2007). Fagerberg et al (2007) and Fagerberg & Srholec (2008) find technological capacity to be significantly related to growth for a large cross-section of countries. But although a well-functioning innovation system seems important for development, these authors also confirm the critical role for growth of governance and the quality of institutions.
Although many endogenous growth models have emphasised technology spillovers as a vehicle for catching-up (eg Grossman and Helpman, 1991), the empirical evidence on the effects of
international technology-transfer is less clear cut (Hoekman and Smarzynska Javorcik, 2006). More recent studies using panel datasets, correcting for firm or sector-specific fixed effects, find no positive within-industry spillover effects for countries in development on the growth and productivity of local firms. This is accounted for by the lack of absorptive capacity in these
countries (eg Aitken and Harrison, 1999, Blomström and Kokko, 1998, Dunning and Narula, 2000, Damidjan et al, 2003). In addition, the potential benefits from FDI may not materialise, because multinational firms may prevent their core know-how from spreading to local rivals (Veugelers and Cassiman, 2004).
One other explanation for the lack of evidence of positive intra-industry spillovers from openness is the confounding impact of competitive effects from open markets (Markusen and Venables, 1999). More positive results are found for cross-industry spillovers of the vertical type (eg Görg and Greenaway, 2003).
2.3.The impact of transition
All of the countries in our study (except Turkey)4; have undergone transition, ie a process of transformation of their economic systems from planned to market economies, and of their political systems from communism to democracy. Specific transition process patterns have strongly influenced these countries' overall development during the last two decades, with implications for knowledge-based growth.
Consensus has developed on the factors that are associated with successful transition (see, for example, Aghion and Blanchard, 1994, Blanchard, 1997). These include macro-economic stability, international integration, the quality of institutions and structural reforms, including political reforms, price/trade liberalisation, restructuring of the production system, competition policy and banking sector reforms. The initial Washington Consensus focused on fiscal discipline, tax reforms, competitive exchange rates, liberalised interest rates, trade and FDI, privatisation, deregulation and property rights. The augmented Washington Consensus, inspired by a more micro-oriented policy perspective, added corporate governance, anti-corruption, open trade agreements and competition policy. Many of these factors also influence knowledge based growth.
The European Bank for Reconstruction and Development (EBRD) in its regular Transition Reports monitors the progress of transition countries on these structural reforms. In addition, the EBRD
4 Turkey – an EU accession candidate and located in the geographical area under consideration – is not a transition
assesses through its Business Environment and Enterprise Performance Survey (BEEPS) the environment, structure and performance of companies in transition countries. This survey underpins an empirical literature examining the factors that influence the growth of companies in transition countries (see eg RINDICATE (2007) for an overview). Most of these empirical studies find that factors driving growth are highly interlinked, suggesting the importance of a systematic approach to structural reform. Carlin et al (2004) look particularly at the relationship between competition, finance, innovation and growth in transition economies. They show that competitive pressures increase innovation in both new and incumbent firms, subject to hard-budget constraints for incumbent firms and availability of financing for new firms. Also Gorodnichenko et al (2008), using more recent BEEPS data, show that the impact of competition on innovation depends on the technology position of the firms. They confirm the importance of trade and FDI, especially vertical transfers of capabilities in multinational supply chains.
To summarise, technological progress through technology absorption and/or creation can be an important driver for development, but is no guarantee of success. Depending on the country’s initial level of development, a set of additional factors, shaping the country’s capacity for a virtuous innovation-growth link, need to be present. In addition to R&D, technology and ICT infrastructure, these additional factors include access to large markets, (international) openness of markets, competition, access to a highly educated and skilled population (especially tertiary-level), well-developed financial markets and, finally, quality institutions and macro-economic stability. It is important to note that these factors should not be seen in isolation, but as part of a system of key prerequisites for knowledge-based growth.
3. Characterising innovation in CEECCA countries
The CEECCA countries (with the exception of Turkey) were formerly within the Soviet Union’s political and economic sphere and have a transition process in common. They have moved from socialist political systems toward democratic systems and from centrally-planned economies to market economies. However, they are diverse. Ten countries are European Union members. Six countries in the western Balkans are either EU accession 'candidates' or 'potential candidates' (Albania, Bosnia and Herzegovina, Croatia, the Former Yugoslav Republic of Macedonia, Montenegro and Serbia) and twelve countries form the Commonwealth of Independent States (CIS), of which five are major hydrocarbon exporters (Azerbaijan, Kazakhstan, Russia, Turkmenistan and Uzbekistan).
In order to evaluate these countries' scope for knowledge-based growth we make an assessment for each country of the presence of the prerequisites for knowledge-based growth, taking into account each country's level of development. This exercise will be done in section 4. Section 3 first shows for the set of countries under consideration: (i) their innovation activities (more particularly their use of technology-buy and/or technology-make activities (section 3.1), and (ii) how they rank in terms of having the prerequisites for knowledge-based growth (section 3.2).
3.1.Innovation strategies in CEECCA countries
3.1.1. Innovation input and output performance of CEECCA countries
This section reports hard data, commonly used when measuring innovation. On the input side, this includes R&D expenditures relative to GDP. R&D expenditures include both private expenditures by companies as well as expenditures by public institutes (research institutes and universities). On the output side, we look at publications (as an output measure for science by mostly public institutes) and patents (as an (intermediate) output measure for development by mostly private companies). These are the only series that are sufficiently consistent and available across countries and time.
For countries in catching-up stage, publications and patents will be a poor proxy to measure innovation activity, as these indicators are highly biased in favour of countries with a technology-make profile at the technology and science frontier.
Table 3.1: R&D, publications and patents
US Japan Brazil China India EU15 CEECCA
R&D to GDP score 4.93 6.07 2.01 2.98 1.8 3.82 1.77 (0.78)
Publications (pp) score 4.73 3.32 1.27 1.16 1.05 4.47 1.75 (0.86)
Patents (USPTO)pp score
7 6.95 1.01 1.01 1.01 2.32 1.03 (0.05)
All indicators are rescaled on a 1-7 scale (1=series minimum; 7=series maximum). Missing observations for Serbia, Moldova, Albania, Bosnia and Macedonia. The standard deviation is shown between brackets. CEECCA is population weighted average.
Source: R&D to GDP & Patents (USPTO) per population: World Bank; Publications (ISI) per population: NSF, S&E Indicators; Year= 2005;
As anticipated, CEECCA countries (like other emerging countries) score minimally on the two innovation output measures: publications and patents. On R&D expenditure, CEECCA countries, not surprisingly, lag substantially behind the US, Japan and the EU15. But they also score lower than China.
A closer look at some of the CEECCA countries for which we have more detailed statistics shows that the little R&D that is done is highly concentrated in a limited number of sectors and is done by a small number of firms (Veugelers and Mrak, 2009). The same sectors show up as 'key' in a number of countries: pharmaceuticals, motor vehicles and ICT. This suggests the importance of specialising in the 'right' sectors. Foreign affiliates account for a large part of total business R&D, especially in the Czech Republic, Hungary, Poland and Slovakia.
3.1.2. Technology-buy versus technology-make
No hard statistical data are as yet available to assess all CEECCA countries for the use of technology-make versus buy strategies. We therefore resort to more subjective survey-based information from the World Economic Forum, Global Competitiveness Index (WEF-GCI )5.
5
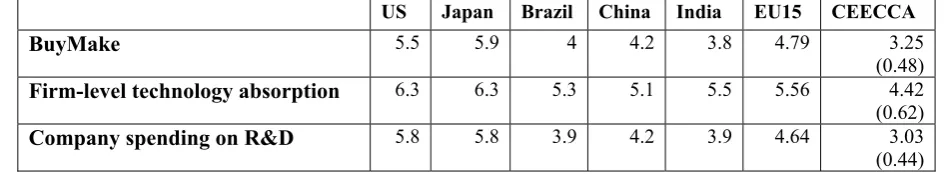
The WEF-GCI provides survey information from sampled executives on the use of technology-buy and technology-make strategies. The 'Firm-level technology absorption' indicator measures the use of technology-buy strategies. 'Company spending on R&D' reflects the allocation of company funds to R&D. R&D activities are important because they generate new knowledge as part of a technology-make strategy, and because they can enhance the ability to understand and apply existing knowledge, and are therefore also an important component of absorptive capacity in firms' technology-buy strategies. Table 1 shows the mix of reported technology-make and buy strategies.
[image:8.595.62.536.292.379.2]CEECCA countries score lower both on 'Firm Technology Absorption' and on 'Company R&D', compared to the US, Japan or the EU15. This is commensurate with the lower level of development of CEECCA countries. But they also score lower on both indicators compared to Brazil, India and, especially, China.
Table 3.2: Technology-buy and/or technology-make: benchmarking of CEECCA countries
US Japan Brazil China India EU15 CEECCA
BuyMake 5.5 5.9 4 4.2 3.8 4.79 3.25 (0.48)
Firm-level technology absorption 6.3 6.3 5.3 5.1 5.5 5.56 4.42 (0.62)
Company spending on R&D 5.8 5.8 3.9 4.2 3.9 4.64 3.03 (0.44)
BuyMake: 'companies mostly acquire (=1) or develop their own (=7) technologies'
Firm technology absorption: 'companies in your country are (1 = not able to absorb new technology, 7 = aggressive in absorbing new technology)'
Company spending on R&D: 'companies in your country (1=do not spend money on R&D, 7=spend heavily on R&D relative to international peers)'.
The standard deviation is shown between brackets.
Source: WEF, GCI, Year=2007
The data suggest a complementarity between technology-buy and make, as high/low scores on 'Company R&D spending' are correlated with high/low scores on 'Firm-technology absorption'. Even for countries at the technology frontier, 'Firm technology absorption' remains important.
With respect to the relative importance of both indicators, the lower score on BuyMake for CEECCA countries, compared to developed countries and to other emerging markets, suggests that, on average, technology-buy is the most important component in innovation strategies for CEECCA companies, as expected. This is also reflected in the higher score on 'Firm Technology Absorption' relative to 'Company spending on R&D'.
Unfortunately, no time series are available to trace the technology-make versus buy patterns along the development path of a specific country. But across countries there is substantial heterogeneity, particularly for the technology-buy strategy. Section 4 will further examine this heterogeneity according to the level of development of the countries.
3.1.3. Classifying CEECCA countries by innovation activities
score of 1.5 on ‘R&D-to-GDP score’6. Within the innovation-active group, the classification into technology-buy and/or technology-make countries is done according to their ‘BuyMake’ score.
Box 3.1 shows the heterogeneity among CEECCA countries with respect to innovation activities. The most innovation-active countries are Slovenia and the Czech Republic. These countries are not only innovation active, they are also most active in technology-make, compared to all other CEECCA countries. Other EU countries in the group under consideration are also more innovation active than their non-EU CEECCA counterparts. Latvia and Poland are at the bottom on the BuyMake mix. Romania and Bulgaria are the only two EU CEECCA countries not (yet) in the innovation-active group. Other CEECCA countries that make it into the innovation-active category are Russia, Turkey, Croatia and Ukraine.
BOX 3.1: Categorising CEECCA countries by innovation activities
GDPpc2003 GDPpc 2007
I1 Little BUY- No MAKE
Tajikistan, Kyrgyzstan,
Serbia, Bosnia, Macedonia
20.7 21.6 Innovation
Weak
I2 Some BUY-
No MAKE Azerbaijan, Mongolia, Moldova, Kazakhstan, Romania, Armenia, Bulgaria
22.7 27.4
I3 Mostly BUY- Little MAKE
Latvia, Poland 53.6 62.1
I4 BUY-MAKE Slovakia,
Lithuania, Hungary, Estonia,
Turkey, Croatia, Ukraine, Russia
53.2 58.6 Innovation
Active
I5 BUY- MORE MAKE
Slovenia, Czech Republic
92.2 94.5
Note: GDPpc is expressed as gap relative to maximum GDPpc in the CEECCA group, ie Slovenia. Values are sub-group unweighted averages.
Mapping the innovation-activity profile of countries to their level of development clearly confirms a positive correlation (see the two right-hand columns of Box 3.1). The most innovation-active countries (I5: Slovenia and the Czech Republic) are also the most developed consistently throughout the period under consideration, while the innovation-weak countries (I1 & I2) are persistently far behind in terms of their relative development. The level of development does not seem to differ greatly between the I1 and I2 category countries, but both categories display high variance. In the I1 group, Tajikistan and Kyrgyzstan are persistently the bottom countries (with a score <10 percent in both periods), while Serbia and Macedonia have a level of development that is even higher than the I2 average. In the I2 group, Kazakhstan, Romania and Bulgaria are the best-performing countries (with a score around 40 percent).
The countries with moderate innovation activities are also moderate performers in terms of their development. The two I3 countries, Latvia and Poland, do not score significantly different from I4 countries; in fact their score may be better. The clearest negative outlier is Ukraine, which has persistently a low development level (with a score around 25 percent), which is at odds with its relatively well-developed innovation-activity profile.
3.2.Indicators to measure the key prerequisites for innovation-based growth
As most of the CEECCA countries are not (yet) strongly innovation active, the major part of our analysis will be focused on identifying the potential of CEECCA countries for innovation-based growth. To this end, we will empirically score the various CEECCA countries on factors that have been identified in section 2 as prerequisites for knowledge-based growth.
Section 3.2.1 discusses the indicators used to test for these prerequisites. These indicators are all derived from the WEF-GCI7. Section 3.2.2 shows the scores for the CEECCA countries on these prerequisites.
3.2.1. Constructing indicators to assess the prerequisites for knowledge-based growth
We split the prerequisites into (i) those that can be considered as broader framework conditions and (ii) those affecting innovation capacity. Box 3.2 details the various components.
Broader framework conditions include the quality of institutions, macro-economic stability and the functioning of markets. The latter includes the functioning of financial markets and labour markets, but most importantly the functioning of markets for goods and services. This latter component includes local market size, product market competition, ease of starting a business, quality of vertical links and international openness (trade and FDI).
Innovation capacity is split into (iia) factors affecting access to technology, (iib) factors affecting capacity to absorb technologies and (iic) factors affecting capacity to create technologies.
As section 3 has shown, CEECCA countries are typically not at the frontier of technological know-how. Thus technological progress in these countries occurs mainly through the adoption and adaptation of pre-existing technologies. This means that the factors determining access to and absorption of technology play a pivotal role. To measure access to technology, we consider the availability of new technologies, ICT availability and use, and transfer of know-how through FDI.
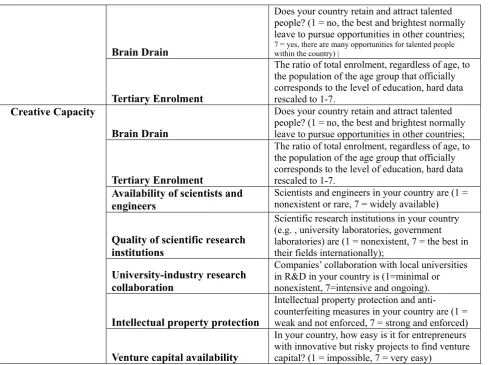
Education and human-resource development is a pivotal factor for determining absorptive capacity. This includes secondary and tertiary enrolment, and availability of scientists and engineers. It corrects for an assessment of the brain-drain problem. It also assesses the quality of education and the extent of on-the-job training.
The human-resources component is important for both absorptive and creative capacity building, although the components will be different: for absorptive capacity, enrolment, quality of schooling and the extent of on-the-job training are important, while for creative capacity, tertiary enrolment and the availability of scientists and engineers (corrected for brain drain) will be more important (see, eg Aghion et al, 1996).
The creative capacity prerequisite further includes the quality of the public science infrastructure
7 Appendix 1 briefly gives an overview of the WEF-GCI analysis on drivers of growth. Appendix 1 also compares the
and the links between this infrastructure and the private sector, IPR protection and venture-capital availability.
While we will try to measure and report on each of these elements individually, we also present a composite perspective. This will allow a more condensed representation of the multitude of factors involved.
Box 3.3: Key prerequisites for knowledge-based growth
Composite Factors Individual Factors Institutions
Institutions
Public institutions (75%) (property rights, ethics, undue influence, government inefficiency, security) and private institutes (25%) (corporate ethics, accountability)
Macro-economic
Stability Macro-economic stability
Government surplus/deficit, national savings rate, inflation, interest rate spread, government debt;
Goods market efficiency
Competition (2/3), both domestic competition and foreign competition, and quality of demand conditions (1/3)
Labour market efficiency Flexibility (50%) and efficient use of talent (50%)
Financial market sophistication
Efficiency 50% (financial market sophistication, financing through local equity market, ease of access to loans, venture capital availability, restriction on capital flows, strength of investor protection); Trust & confidence 50% (soundness of banks, regulation of securities exchanges, legal rights index);
Market size Domestic market size (75%) and foreign market size (25%); Intensity of Local competition*
Competition in local market is 1=limited in most industries and price-cutting is rate, 7= intense and market leadership changes over time
Proclivity to trade* Imports and exports as % of GDP (hard data) rescaled to 1-7
Prevalence of FDI*
Foreign ownership of companies in your country is (1 = rare, limited to minority stakes, and often prohibited in key sectors, 7 = prevalent and encouraged)
Markets Days to start Business* Days required to start a business (Doing Business World Bank) rescaled to 1-7
Availability of latest technologies
In your country, the latest technologies are (1 = not widely available or used, 7 = widely available and used)
ICTavailability-use Broadband internet subscribers, internet users and main telephone lines per population.
Technology Access
FDItransfer
Foreign direct investment in your country (1=brings little new technology, 7=an important source of new technology)
Secondary Enrolment
The ratio of total enrolment, regardless of age, to the population of the age group that officially corresponds to the level of education, hard data rescaled to 1-7.
Quality of the educational system
The educational system in your country (1 = does not meet the needs of a competitive economy, 7 = meets the needs of a competitive economy)
Absorptive Capacity
Extent of staff training
Brain Drain
Does your country retain and attract talented people? (1 = no, the best and brightest normally leave to pursue opportunities in other countries;
7 = yes, there are many opportunities for talented people within the country) |
Tertiary Enrolment
The ratio of total enrolment, regardless of age, to the population of the age group that officially corresponds to the level of education, hard data rescaled to 1-7.
Brain Drain
Does your country retain and attract talented people? (1 = no, the best and brightest normally leave to pursue opportunities in other countries;
Tertiary Enrolment
The ratio of total enrolment, regardless of age, to the population of the age group that officially corresponds to the level of education, hard data rescaled to 1-7.
Availability of scientists and engineers
Scientists and engineers in your country are (1 = nonexistent or rare, 7 = widely available)
Quality of scientific research institutions
Scientific research institutions in your country (e.g. , university laboratories, government laboratories) are (1 = nonexistent, 7 = the best in their fields internationally);
University-industry research collaboration
Companies’ collaboration with local universities in R&D in your country is (1=minimal or nonexistent, 7=intensive and ongoing).
Intellectual property protection
Intellectual property protection and
anti-counterfeiting measures in your country are (1 = weak and not enforced, 7 = strong and enforced)
Creative Capacity
Venture capital availability
In your country, how easy is it for entrepreneurs with innovative but risky projects to find venture capital? (1 = impossible, 7 = very easy)
* These variables are also represented in the composite Goods Market efficiency, but are nevertheless also introduced separately to increase their weight in the Markets Pillar.
Note: All right-side variables are equally weighted in the composite left-side pillars. Source: WEF-EOS (2008) u.o.s.
3.2.2. 3.2.2. CEECCA scoring on key prerequisites for knowledge-based growth
Before we present the individual prerequisites in tables 3.4 and 3.5, we first discuss the composite prerequisites in Table 3.3.
[image:12.595.57.546.52.417.2]The creative capacity prerequisite represents the biggest gap for CEECCA countries to bridge. This is commensurate with their position relative to the technology frontier. This is common to most CEECCA countries, as this prerequisite shows the lowest standard deviation. On technology access, CEECCA countries report higher scores, but also with a greater variance. The technology access gap may be smaller than the creative capacity gap, but a lack of absorptive capacity may limit the effectiveness of a technology-buy strategy for growth for many CEECCA countries.
Table 3.3:
Internationally benchmarking CEECCA on composite prerequisites for knowledge-based growth
Institutions
Macro-Stability Markets Technology Access Absorptive Capacity Creative Capacity
US 4.93 4.99 5.96 5.84 5.62 5.78
EU15 5.24 5.27 5.38 5.43 5.05 4.83
Brazil 3.56 3.89 4.10 4.29 3.88 3.54
China 4.18 5.95 4.88 3.94 3.68 3.78
India 4.23 4.32 4.96 4.26 3.33 3.78
CEECCA
average 3.68 4.89 4.40 4.07 3.82 3.44
CEECCA
st deviation 0.43 0.64 0.59 0.68 0.57 0.48
CEECCA gap
0.70 0.82 0.74 0.70 0.68 0.60
Note: Gap is calculated relative to the country/region with the highest score;
[image:13.595.70.537.55.168.2]On the broader framework conditions for knowledge-based growth, the CEECCA countries lag behind the US and the EU15, on almost all indicators, reflecting a ‘systemic’ gap. Macro-economic stability presents the smallest gap, though variance by this measure is high8. In particular quality of institutions is a common weakness, as the low standard deviation highlights. The Markets prerequisite also shows a substantial gap with significant variance.
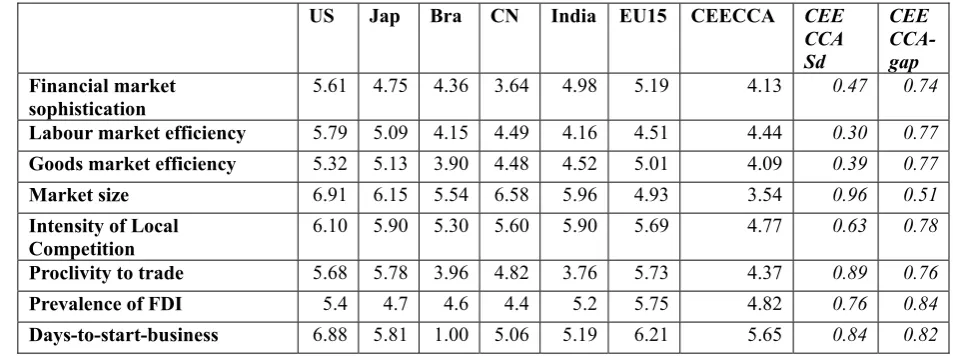
Table 3.4 illustrates the scoring on the various sub-prerequisites that make up the Markets prerequisite.
Table 3.4: Markets prerequisite for knowledge-based growth: Internationally benchmarking CEECCA
US Jap Bra CN India EU15 CEECCA CEE CCA Sd
CEE CCA- gap Financial market
sophistication
5.61 4.75 4.36 3.64 4.98 5.19 4.13 0.47 0.74
Labour market efficiency 5.79 5.09 4.15 4.49 4.16 4.51 4.44 0.30 0.77
Goods market efficiency 5.32 5.13 3.90 4.48 4.52 5.01 4.09 0.39 0.77
Market size 6.91 6.15 5.54 6.58 5.96 4.93 3.54 0.96 0.51
Intensity of Local Competition
6.10 5.90 5.30 5.60 5.90 5.69 4.77 0.63 0.78
Proclivity to trade 5.68 5.78 3.96 4.82 3.76 5.73 4.37 0.89 0.76
Prevalence of FDI 5.4 4.7 4.6 4.4 5.2 5.75 4.82 0.76 0.84
Days-to-start-business 6.88 5.81 1.00 5.06 5.19 6.21 5.65 0.84 0.82
The biggest problem for CEECCA countries is their small market size. Openness through trade, and especially to FDI, partly compensates for small market size. New-firm entry, at least as measured by the days needed to start a business, does not seem to be a major problem on average for CEECCA countries.
[image:13.595.62.539.357.535.2]
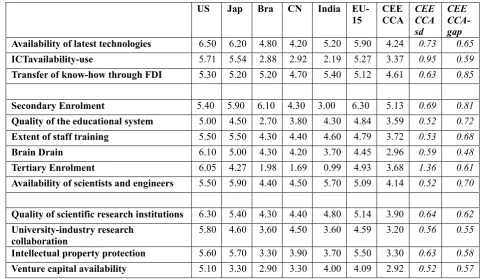
Table 3.5: Innovation-capacity prerequisites for knowledge-based growth: Internationally benchmarking CEECCA
US Jap Bra CN India EU- 15
CEE CCA
CEE CCA sd
CEE CCA- gap Availability of latest technologies 6.50 6.20 4.80 4.20 5.20 5.90 4.24 0.73 0.65
ICTavailability-use 5.71 5.54 2.88 2.92 2.19 5.27 3.37 0.95 0.59
Transfer of know-how through FDI 5.30 5.20 5.20 4.70 5.40 5.12 4.61 0.63 0.85
Secondary Enrolment 5.40 5.90 6.10 4.30 3.00 6.30 5.13 0.69 0.81
Quality of the educational system 5.00 4.50 2.70 3.80 4.30 4.84 3.59 0.52 0.72
Extent of staff training 5.50 5.50 4.30 4.40 4.60 4.79 3.72 0.53 0.68
Brain Drain 6.10 5.00 4.30 4.20 3.70 4.45 2.96 0.59 0.48
Tertiary Enrolment 6.05 4.27 1.98 1.69 0.99 4.93 3.68 1.36 0.61
Availability of scientists and engineers 5.50 5.90 4.40 4.50 5.70 5.09 4.14 0.52 0.70
Quality of scientific research institutions 6.30 5.40 4.30 4.40 4.80 5.14 3.90 0.64 0.62
University-industry research
collaboration 5.80 4.60 3.60 4.50 3.60 4.59 3.20 0.56 0.55
Intellectual property protection 5.60 5.70 3.30 3.90 3.70 5.50 3.30 0.63 0.58
Venture capital availability 5.10 3.30 2.90 3.30 4.00 4.09 2.92 0.52 0.57
The gaps for most innovation-specific drivers are typically larger than for the broader framework conditions, reflecting the still-limited scope for knowledge-based growth in CEECCA countries.
CEECCA countries have much less access to the latest technologies. Although FDI is an important channel for technology transfer, and FDI is important to CEECCA countries (as discussed above), FDI seems less of an opportunity for technology transfer than it is for other countries, including India and Brazil.
In particular, information and communication technologies (ICT) provide a technological backbone for productivity gains. But on ICT availability and use, CEECCA countries still demonstrate a substantial gap relative to the US, EU15 and Japan. They nevertheless score better than China, Brazil and India. There is however wide variance between CEECCA countries.
Availability of the latest technologies is a necessary, but not by itself sufficient, condition for effective technology absorption. For effective absorption, the level of skills in the workforce also plays an important role. Human resources/skills is an area in which CEECCA countries lag by relatively little. But the quality of education and the gap in the training of staff mean that human capital is not capitalised on by CEECCA countries as a factor in innovation-driven growth. Also, brain drain is a serious problem for CEECCA countries, limiting the local returns from human-resource investment.
Compared to other emerging economies, tertiary enrolment and availability of scientists and engineers is one of the strong points of CEECCA countries. But the public research institutions/infrastructure of CEECCA countries is poor and not well linked to the private sector. This is true in comparison to developed countries, but also in comparison to other emerging markets.
developing more innovative projects, have significant potential for growth. This is because CEECCA countries score low on venture-capital availability (in fact, it is the factor with the lowest score among the factors considered). The private sector’s technological activities are further constrained by ineffective IPR regimes.
4.
Assessing the (potential for) knowledge-based growth in CEECCA countries
4.1.Mapping innovation profile and scoring on prerequisites for knowledge-based growth
Table 4.1. maps the scores on prerequisites for knowledge-based growth to the innovation-profile of CEECCA countries. As the available data only allow these dimensions to be measured
simultaneously, the analysis can only be interpreted as correlative evidence.
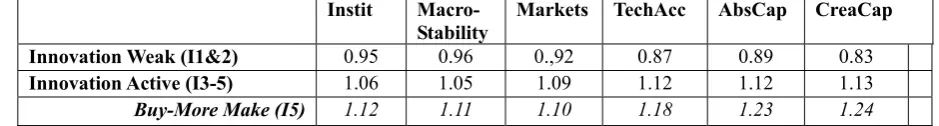
[image:15.595.62.532.424.487.2]Not surprisingly, innovation-active CEECCA countries score higher on all prerequisites, particularly on Creative Capacity, Absorptive Capacity and on Technology Access. Within the group of innovation-active countries, the countries most developed in terms of combining technology-make with technology-buy (ie the I5 countries Slovenia and the Czech Republic), score substantially higher on all indicators, reflecting the importance of 'systems performance'. Slovenia and the Czech Republic outperform other CEECCA countries in particular on Absorptive Capacity and Creative Capacity.
Table 4.1:
Prerequisites for knowledge-based growth: CEECA countries by innovation profile
Instit
Macro-Stability Markets TechAcc AbsCap CreaCap Innovation Weak (I1&2) 0.95 0.96 0.,92 0.87 0.89 0.83 Innovation Active (I3-5) 1.06 1.05 1.09 1.12 1.12 1.13
Buy-More Make (I5) 1.12 1.11 1.10 1.18 1.23 1.24
Going into greater detail (results not reported), we can identify the major differential individual factors across CEECCA countries. The factor where the differential is highest is availability and use of latest technologies, especially ICT. Tertiary enrolment is also a strong differentiating factor. Push factors are clearly important when it comes to brain drain, because the problem is less acute for more innovation-active CEECCA countries. Further differential factors are IPR and venture capital availability, two important drivers for private innovative behaviour.
4.2.Mapping level of development and scoring on prerequisites for knowledge-based growth
Table 4.2:
Prerequisites for knowledge-based growth: CEECA countries by level of development
Instit
Macro-Stability Markets TechAcc AbsCap CreaCap
Level of Development (GDPpc in ppp 2007)
Low 0.92 0.87 0.88 0.81 0.87 0.82
Medium Low 0.94 1.04 0.93 0.90 0.88 0.92
Medium 0.97 1.00 1.03 0.98 0.97 0.97
Medium High 1.03 1.05 1.03 1.06 1.11 1.09
High 1.13 1.05 1.14 1.22 1.14 1.19
Notes:
Development classification is on the basis of GDPpc (in PPP) of 2007. 2003 would leave the same ranking of countries (exc Azerbijan). Low=Armenia, Mongolia, Moldova, Kyrgzyc, Tajikistan; Medium Low = Macedonia, Azerbijan, Bosnia, Ukraine; Medium=Turkey, Romania, Bulgaria, Kazakstan; Medium High=Lithuania, Latvia, Poland, Croatia, Russia; High=Slovenia, Czech, Estonia, Slovakia, Hungary
Numbers represent scoring of group relative to CEECCA average.
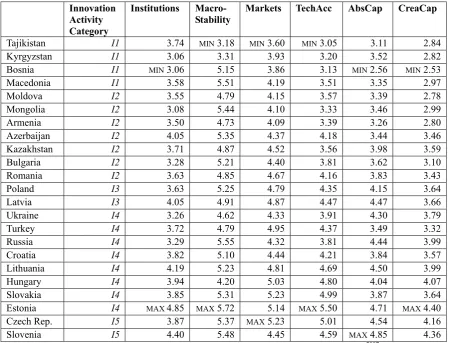
[image:16.595.70.520.407.750.2]Table 4.3 scores on the composite prerequisites each CEECCA country for which data were available. The scoring for each country on the individual components can be found in the appendix.
Table 4.3:
CEECA countries on composite prerequisites for knowledge-based growth
Innovation Activity
Category
Institutions Macro-
Stability Markets TechAcc AbsCap CreaCap
Tajikistan I1 3.74 MIN 3.18 MIN 3.60 MIN 3.05 3.11 2.84
Kyrgyzstan I1 3.06 3.31 3.93 3.20 3.52 2.82 Bosnia I1 MIN3.06 5.15 3.86 3.13 MIN 2.56 MIN 2.53
Macedonia I1 3.58 5.51 4.19 3.51 3.35 2.97 Moldova I2 3.55 4.79 4.15 3.57 3.39 2.78 Mongolia I2 3.08 5.44 4.10 3.33 3.46 2.99 Armenia I2 3.50 4.73 4.09 3.39 3.26 2.80 Azerbaijan I2 4.05 5.35 4.37 4.18 3.44 3.46 Kazakhstan I2 3.71 4.87 4.52 3.56 3.98 3.59 Bulgaria I2 3.28 5.21 4.40 3.81 3.62 3.10 Romania I2 3.63 4.85 4.67 4.16 3.83 3.43
Poland I3 3.63 5.25 4.79 4.35 4.15 3.64
Latvia I3 4.05 4.91 4.87 4.47 4.47 3.66
Ukraine I4 3.26 4.62 4.33 3.91 4.30 3.79
Turkey I4 3.72 4.79 4.95 4.37 3.49 3.32
Russia I4 3.29 5.55 4.32 3.81 4.44 3.99
Croatia I4 3.82 5.10 4.44 4.21 3.84 3.57 Lithuania I4 4.19 5.23 4.81 4.69 4.50 3.99 Hungary I4 3.94 4.20 5.03 4.80 4.04 4.07 Slovakia I4 3.85 5.31 5.23 4.99 3.87 3.64 Estonia I4 MAX 4.85 MAX 5.72 5.14 MAX 5.50 4.71 MAX 4.40
Czech Rep. I5 3.87 5.37 MAX 5.23 5.01 4.54 4.16
We discuss a selected set of individual countries.
(i) EU CEECCA countries
Slovenia and the Czech Republic are the highest scoring CEECCA countries in terms of innovation input and output performance, and on Buy-Make. They are also, more than other CEECCA countries, relatively more concentrated on technology-make relative to technology-buy. They score substantially above the CEECCA average on most prerequisites for knowledge-based growth, reflecting the importance of 'systemic performance'.
Slovenia's greatest advantage (relative to other CEECCA countries) is its skills, with high tertiary enrolment, a good quality education system and public research infrastructure, and relatively good industry-science links. Other relatively strong points are its financial market sophistication and IPR. Access to latest technologies, particularly ICT is another strength. FDI is much less prevalent, restricting the acquisition of existing technologies through this channel. But this seems to be compensated for by Slovenia’s openness to trade, which enables access to technologies through imports, compensates for a small internal market and allows learning through exports. Slovenia's weakest point is its small and less competitive domestic market.
The Czech Republic has similar strong points as Slovenia, ie its financial market development, its open character, this time not only through trade, but also FDI, access to the latest technologies, including ICT, and the quality of its education system. The Czech Republic has no obvious weak points.
Estonia scoresmaximum or close to the maximum for all prerequisites. Its innovation activities are mostly focused on start-up activities and on accessing existing technologies, with a strong focus on ICT.
Latvia, like Poland has a relatively undeveloped innovation strategy. Both countries score below their peers on most drivers for based growth, impeding their potential for knowledge-based growth in the near future. Slovakia’s development is strongly related to FDI, but it scores relatively poorly on indigenous absorptive capacity, especially on quality of education and training. This jeopardises the role of FDI as a mechanism for technology transfer and local productivity growth.
Bulgaria and Romania are the EU countries with the lowest levels of development. Furthermore they display the lowest innovation profile score among EU CEECCA countries. Both countries also score lowest on almost all prerequisites for an innovation-based growth process (excluding Macro-stability for Bulgaria), suggesting a systemic problem.
(ii) The two largest CEECCA countries: Russia and Turkey
Russia and Turkey are both innovation-active, and score above the CEECCA average with respect to their R&D-to GDP ratios. They have a higher score for most prerequisites, although the differential compared to the average is not large.
Turkey also has a market-size advantage, coupled with good market access and openness to trade, giving it channels to the latest technologies. Its negative points, ie factors on which it scores below the CEECCA average, are its labour market efficiency, IPR and venture capital availability. Tertiary enrolment in Turkey is also below the average for the transition CEECCA countries. But brain drain is less problematic than in other CEECCA countries.
4.4. An assessment of the potential of CEECCA countries for knowledge-based growth
In this final section, we classify CEECCA countries on their potential for knowledge-based growth. We categorise the CEECCA countries as innovation active (I3-I4-I5) and non-innovation active (I1-I2). The evaluation of their potential for knowledge-based growth will be specific for each group.
4.4.1 Innovation-active CEECCA countries
On the condition that they are already carrying out some innovation activities, countries need to perform on the prerequisites for knowledge-based growth. Two principles guide our analysis of good performance in this respect. First, as the analysis has shown the importance of 'systemic' performance, countries need to perform well on all of the prerequisites for knowledge-based growth. Second, when defining benchmark levels for scores, we will take into account the position of countries on their innovation-development path, ie scores will be compared only with other innovation-active CEECCA countries.
The following algorithm is used to assess performance on the prerequisites. First, there should not be bottlenecks holding back the putting in place of prerequisites. A country is judged as having a bottleneck if it scores at the minimum value of all innovation-active CEECCA countries (see 'XXX' in Table 4). Next, a country cannot have too many weak spots. A weak spot is defined as a score below the average of its benchmark group of innovation-active CEECCA countries. We differentiate between serious weak spots ('XX') and lesser weaknesses ('X'). A country cannot accumulate more than one bottleneck, two weak spots or three minor weak spots.
Compared to a procedure where we would take the overall CEECCA average as a benchmark rather than the subgroup of innovation-active CEECCA countries only, our procedure will give more weight to the innovation-capacity prerequisites as well as to market efficiency. Compared to taking the average across all countries, including US, EU15 et al, our procedure reduces the weight of the creative capacity prerequisites, as most of the transition countries are still far from the technology frontier. The results are relatively robust to changes in the chosen benchmarks.
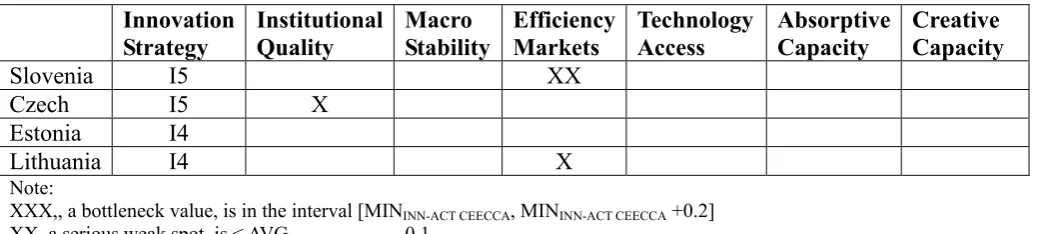
Table 4.4:
CEECCA countries with potential for knowledge-based growth in the near future
Innovation
Strategy Institutional Quality Macro Stability Efficiency Markets Technology Access Absorptive Capacity Creative Capacity
Slovenia I5 XX
Czech I5 X Estonia I4
Lithuania I4 X
Note:
XXX,, a bottleneck value, is in the interval [MININN-ACT CEECCA, MININN-ACT CEECCA +0.2]
XX, a serious weak spot is < AVGINN-ACT CEECCA -0.1
X, a mild weak spot, is a value in the interval [AVGINN-ACT CEECCA -0.1, AVGINN-ACT CEECCA];
As Table 4.5 shows, the other innovation-active CEECCA countries have at least one bottleneck or too many weak spots. Russia and Ukraine combine at least three bottlenecks, Turkey two.
Table 4.5:
CEECCA countries falling short on potential for knowledge-based growth in the near future
Innovation Strategy
Institutional Quality
Macro Stability
Efficiency Markets
Technology Access
Absorptive Capacity
Creative Capacity
Slovakia I4 X XX XX
Hungary I4 XXX XX
Croatia I4 X X XXX XX XX XX
Russia I4 XXX XXX XXX
Turkey I4 XX XX XX XXX XXX
Ukraine I4 XXX XX XXX XXX X
Latvia I3 XX X XX
Poland I3 XX X XX XX XX
XXX= bottleneck; XX=strong weak spot; X= mild weak spot
Countries are ordered according to their Innovation Activity Category and then by GDPpc2007 level (decreasing).
4.4.2 Non-innovation active CEECCA countries
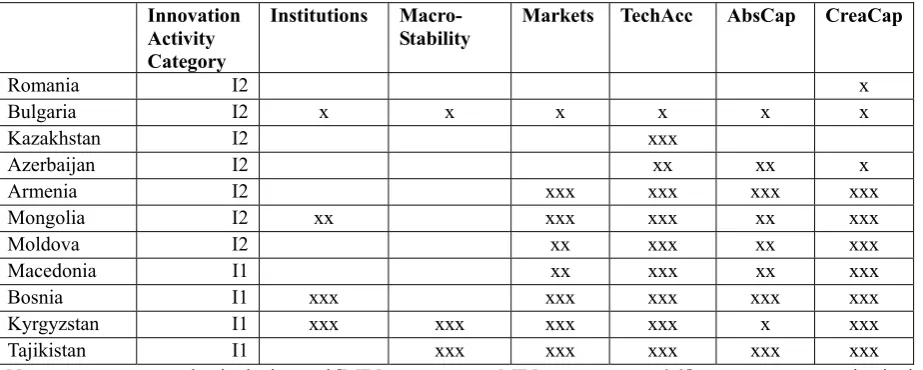
[image:19.595.53.568.326.475.2]Table 4.6:
CEECCA countries failing on potential for knowledge-based growth in the near future
Innovation Activity
Category
Institutions Macro- Stability
Markets TechAcc AbsCap CreaCap
Romania I2 x
Bulgaria I2 x x x x x x
Kazakhstan I2 xxx
Azerbaijan I2 xx xx x
Armenia I2 xxx xxx xxx xxx
Mongolia I2 xx xxx xxx xx xxx
Moldova I2 xx xxx xx xxx
Macedonia I1 xx xxx xx xxx
Bosnia I1 xxx xxx xxx xxx xxx
Kyrgyzstan I1 xxx xxx xxx xxx x xxx
Tajikistan I1 xxx xxx xxx xxx xxx
Note: x represents a value in the interval [MININN-ACT CEECCA, MININN-ACT CEECCA +0.2]; xx represents a value in the
interval [MININN-ACT CEECCA -0.2, MININN-ACT CEECCA[; xxx represents a value smaller than MININN-ACT CEECCA -0.2;
Countries are ordered according to their Innovation Activity Category and then by GDPpc2007 level (decreasing).
On average, these countries score still considerably below the minimum scores of the innovation-active CEECCA countries, particularly on the Innovation Capacity prerequisites. Romania is closest to the group of innovation-active CEECCA countries. It has only a minor weak spot for the Creative Capacity prerequisite. Kazakhstan is also not too far from the minimum score of the innovation-active CEECCA countries; its weakness is evident for the Technology Access prerequisite. Bulgaria is also not too far away, although it has weaknesses for all prerequisites, but these weaknesses are minor.
5.
Summary of main findings
CEECCA countries are still far from the technology frontier. A number of them are not innovation-active at all; those that are innovation-innovation-active mainly pursue technology-buy strategies. Slovenia and the Czech Republic are the two countries with the most developed innovation profile, being also engaged in technology-make.
Given the weak profile of CEECCA countries, rather than evaluating their current innovation performance, it makes more sense to assess their potential for knowledge-based growth, by evaluating their scoring on the prerequisites for knowledge-based growth. These prerequisites include broader framework conditions: quality of institutions, macro-economic stability and well functioning markets. On innovative capacity, the analysis takes into account the factors that shape the potential for a technology-make strategy, but also, and more importantly for CEECCA countries, those prerequisites that shape the potential for a technology-buy strategy, more particularly access to technology and absorptive capacity.
a number of CEECCA countries.
On innovation capacity, CEECCA countries are at a serious disadvantage, and not only with respect to the US and the EU15, but also relative to countries like China, India and Brazil. The disadvantage when it comes to technology access may be less than for creative capacity, which is needed for a technology-make strategy, but a lack of absorptive capacity limits the effectiveness of a technology-buy strategy for growth in CEECCA countries. Nevertheless, there is substantial heterogeneity across countries in the region, especially for the technology access prerequisite. The importance of FDI as a channel for technology access varies across CEECCA countries. It is important for Slovakia, the Czech Republic and Hungary, but not for others such as Slovenia. In terms of absorptive capacity, ICT availability and use in particular is a weak point for CEECCA countries. This factor also seems to be the most divisive among CEECCA countries, differentiating successful countries (like Estonia) from less successful countries. Another critical factor is human capital, particularly the quality of training.
Overall, the analysis seems to suggest that CEECCA countries do not have the potential for knowledge-based growth, on the basis of an evaluation at pre-crisis conditions. A post-crisis assessment would probably reveal even more bottlenecks and weaknesses.
References
Abramovitz, M. (1986) 'Catching up, forging ahead and falling behind', Journal of Economic History 46, 2, 386-406
Aghion, P. and Howitt, P. (1998) Endogenous Growth Theory, Cambridge, MA: MIT Press
Aghion, P. and Blanchard, O. (1994) 'On the Speed of Transition in Central Europe', NBER Macro Annuals
Aghion, P., Bloom, N., Blundell, R., Griffith, R. and Howitt, P. (2005) 'Competition and Innovation: An Inverted U Relationship', Quarterly Journal of Economics
Aitken, B. and Harrison, A. (1999) ‘Do domestic firms benefit from foreign direct investment? Evidence from Venezuela’, American Economic Review 89 (3), 605-618
Blanchard, O. (1996) 'Theoretical Aspects of Transition', American Economic Review Papers and Proceedings, May 1996, 117-122
Blomström, M. and Kokko, A. (1998) 'Multinational Corporations and Spillovers', Journal of Economic Surveys 12, 3, 247-277
Carlin, W., Schaffer, M. and Seabright, P. (2004) 'A Minimum of Rivalry: Evidence from Transition Economies on the Importance of Competition for Innovation and Growth', contributions to
Economic Analysis and Policy, Berkeley Electronic Press, vol. 3(1), pages 1284-1284
Cohen, W.M. and Levinthal, D.A. (1990) 'Innovation and Learning: The Two Faces of R&D', Economic Journal 99, 569-596
Darvas, Z. (2009) 'Beyond the crisis: prospects for transition economies from cross-country growth regressions', Working Paper, Bruegel, Brussels
Damijan, J., Knell, M., Majcan, B. and Rojec, M. (2003) 'The Role of FDI, R&D Accumulation and Trade in Transferring Technology to Transition Countries: Evidence from Firm Panel Data for Eight Transition Countries', Economic Systems June 2003, pp. 189-204
EBRD, Transition Report, various years
Fagerberg, J. and Srholec, M. (2008) 'National innovation systems, capabilities and economic development', Research Policy 37, 1417-1435
Fagerberg, J., Knell, M. and Srholec, M. (2007) 'The competitiveness of nations: why some countries prosper, while others fall behind', World Development 35, 10, 1595-1620
Furman, J., Porter, M. and Stern, S. (2002) 'The determinants of national innovation capacity', Research Policy 899-934
Görg, H. and Greenaway, D. (2003) 'Much ado about nothing? Do domestic firms really benefit from FDI?', mimeo
Grossman, G. and Helpman, E. (1991) Innovation and growth in the global economy, Cambridge, MA: MIT Press
Hoekman, B., Maskus, K. and Saggi, K. (2005) 'Transfer of technology to developing countries: unilateral and multilateral policy options', World Development 33, 10, 1587-1602
Hoekman, B. and Smarzynska Javorcik, B. (eds.) (2006) Global Integration and Technology Transfer, New York, Palgrave MacMillan
Iradian, G. (2007) 'Rapid Growth in Transition Economies: Growth-Accounting Approach', IMF Working Paper No. 07/164
Lall, S. (1992) 'Technological Capabilities and industrialisation', World Development 20, 165-186
Markusen, J. and Venables, A. (1999) 'Foreign direct investment as a catalyst for industrial development', European Economic Review 43, 335-356
Narula, R and Dunning, J. (2000) 'Industrial development, globalisation and multinational enterprises: New realities for developing countries', Oxford Development Studies 28 (2)
Nelson, R. (1993) National innovation systems: a comparative analysis, Oxford University Press, New York
RINDICATE (2007) 'The role of Science and Technology for Catching-up Economics', report prepared for EC-RTD, coordinated by Idea Consult
Solow, R. (1956) 'A contribution to the theory of economic growth', Quarterly Journal of Economics 70, 1, 65-94
Svejnar, J. (2006) 'Strategies for Growth: Central and Eastern Europe', conference proceedings: The New Economic Geography: Effects and Policy Implications, Federal Reserve Bank of Kansas City, Jackson Hole, Wyoming, August 24-26, p .205-233
Verspagen, B. (1991) 'A new empirical approach to catching up or falling behind', Structural Change and Economic Dynamics 2: 359-80
Veugelers, R. and Mrak, M. (2009) 'The Knowledge Economy and Catching-up Member States of the European Union', report prepared for Potocnik’s Knowledge-for-Growth Expert Group
Veugelers, R. and Cassiman, B. (2004) 'Foreign subsidiaries as channel of international technology diffusion: some direct firm level evidence from Belgium', European Economic Review 48, 455-476
Appendix 1: The WEF drivers of growth
The World Economic Forum, in its Global Competitiveness Reports, provides an assessment of the growth potential of a comprehensive set of countries. It looks at three sets of 'growth pillars': Basic requirements, Efficiency Enhancers and Innovation Factors.
Although all pillars are factored into the calculation of the overall score of each country on growth potential (ie their ranking on the Global Competitiveness Index), it is clear that the three pillars affect countries differently, depending on the country's stage of development. The first pillar is more important for countries with initial low levels of development (which are still in a factor-driven growth stage); the second pillar for countries at median levels of development (with an efficiency-driven growth stage); and the third pillar will be more important at high levels of development, when closer to the frontier. These countries are, in WEF terminology, in an innovation-driven growth stage. Consequently, each of the three growth pillars receives a different ranking in the calculation of a country’s overall GCI score, depending on its development stage.
By comparison, our general growth factors are distributed over 'Basic Requirements' (Institutions and Macro-stability) and 'Efficiency Enhancers'. The 'Innovation factors' considered in the WEF analysis are heavily concentrated on 'Technology-make', and on the quality of vertical links. Some of the drivers for 'Technology-buy' are in the efficiency enhancers group (Technological Readiness and Higher Education).
According to WEF, the CEECCA area includes countries with growth processes ranging from factor-driven to innovation-driven (KY, MOL, MON, TAJ in stage 1, SI and CZ in stage 3), but most are in stage 2, ie the efficiency-driven stage, moving from 1 to 2, or trying to move from 2 to 3 (RU, TK and most EU countries within the group). These results are very similar to ours.
Table A.0
US Japan Brazil China India EU-15 CEECCA CEECCA-USgap
Basic
requirements
5.50 5.36 3.98 5.01 4.23 5.55 4.33 0.79
Efficiency enhancers
5.81 5.22 4.28 4.41 4.49 5.00 3.97 0.68
Innovation factors
5.80 5.65 4.04 4.18 4.29 4.87 3.45 0.59
CEECCA and EU-15 is the population weighted average. Countries with less than 1 million population are excluded. Basic Requirements is the average of the score on Institutions, Infrastructure, Macroeconomic Stability and
Health&PrimaryEducation;
Efficiency enhancers is the average of HigherEducation, GoodsMarketEfficiency, LabourMarketEfficiency,
FinancialMarketSophistication, Technological Readiness and MarketSize (which includes beyond domestic market size, also openness for trade)
Innovation factors is the average of “Business Sophistication” (networks and supporting industries (50%) and
sophistication of firm’s operations and strategy (50%) ) and “Innovation” (incl Spending on R&D, utility patents, IPR, Scientists and Engineers, Quality of PROs, Industry-Science Links..).
Source: On the basis of WEF, Year=2007.
5.1.Appendix 2: The World Bank Knowledge Economy Index (KEI)
The World Bank produces the Knowledge Economy Index (KEI), which is a measure of a country's performance on four pillars which they consider to be key for establishing and maintaining a knowledge economy: (i) economic incentive and institutional regime (EIC); (ii) education (EDU); (iii) innovation (INN); and (iv) ICT.
Economic Incentives is based on Tariff and Non-Tariff Barriers, Regulatory Quality and Rule of Law; Innovation is measured through Royalty and License Fee Payments & Receipts, USPTO Patent Applications and Scientific and Technical Journals; Education uses Adult Literacy, Secondary and Tertiary Enrolment; ICT is Telephone, Computer and Internet penetration.
Table A.1
Bulgaria Romania Latvia Lithuania Poland Hungary Estonia Slovakia Czech Slovenia GDPpcppp2007 11311 11401 17488 17733 16316 19020 20584 20268 24229 27227
g07-93 5.00 5.80 9.50 7.80 6.90 6.10 9.10 7.00 5.50 6.20
R&D-to-GDP ratio 1.46 1.34 1.59 1.91 1.60 2.20 2.20 1.50 3.18 3.11
Publications pp 1.54 1.22 1.32 1.65 1.97 2.41 2.78 1.92 2.68 3.81
Patents (USPTO) pp 1.02 1.01 1.01 1.03 1.02 1.11 1.11 1.02 1.08 1.18
BuyMake 2.90 3.30 3.00 3.30 3.00 3.40 3.60 3.30 4.20 4.50
Firm Technology Absorption
4.00 4.40 4.50 5.00 4.70 4.70 5.50 5.40 5.40 4.90
Company spending on R&D
2.70 3.00 3.00 3.40 3.10 2.90 3.60 3.30 4.00 4.00
Note: ranking of countries is on GDPpc2007. Ranking is very similar when using GDPpc2003 (exc Hungary which would move to third place).
Table A.2
Bulgaria Romania Latvia Lithuania Poland Hungary Estonia Slovakia Czech Slovenia
Institutions 3,28 3,63 4,05 4,19 3,63 3,94 4,85 3,85 3,87 4,40
Macro-economic stability 5,21 4,85 4,91 5,23 5,25 4,20 5,72 5,31 5,37 5,48
Goods market efficency 4,11 4,18 4,46 4,52 4,22 4,20 4,98 4,71 4,73 4,49
Labor market efficiency 4,42 4,10 4,71 4,52 4,40 4,23 4,74 4,67 4,74 4,41
Financial market sophistication 4,18 4,42 4,80 4,50 4,28 4,42 5,08 5,04 4,65 4,67
Market size 3,83 4,38 3,24 3,51 5,00 4,28 3,04 3,94 4,45 3,44
Intensity of Local competition 5 4,7 5,1 5,4 5,3 5,4 5,8 5,6 5,7 5,1 Proclivity to trade 4,11 4,27 4,88 5,52 5,12 5,46 5,61 5,2 5,67 5,71 Prevalence of FDI 4,3 4,9 5,5 4,9 4,7 6 5,7 5,7 6,4 4,3 Days-to-start-business 5,25 6,38 6,25 5,63 5,31 6,25 6,81 5,69 6,19 3,50
Availability of latest technologies 3,80 3,90 4,70 5,00 4,40 4,70 5,80 5,10 5,10 5,10
ICTavailability-use 3,54 3,58 3,90 4,38 3,76 4,21 5,40 3,86 4,44 4,88
FDItransfer 4,10 5,00 4,80 4,70 4,90 5,50 5,30 6,00 5,50 3,80
Tertiary Enrolment 3,43 3,91 5,45 5,66 4,87 5,09 4,87 3,41 3,73 6,13
Quality of the educational system 3,30 3,60 3,70 3,70 3,80 3,20 4,50 3,40 4,70 4,40
Extent of staff training 3,10 4,10 4,00 4,40 3,60 3,40 4,60 4,40 4,70 4,30
Brain Drain 2,10 2,60 3,50 3,00 2,70 3,00 3,80 2,70 4,00 3,90
Availability of scientists and engineers 3,70 4,30 3,30 4,20 4,10 4,50 4,10 4,90 5,40 3,90
Quality of scientific research institutions 3,70 3,60 3,60 4,30 4,10 5,00 4,90 3,70 4,90 4,80
University-industry research collaboration 2,90 3,10 3,00 3,50 3,00 4,00 4,00 3,40 4,20 3,90
Intellectual property protection 2,90 3,50 3,60 4,00 3,40 4,10 4,80 3,70 3,90 4,40
Table A.3
Tajikistan Kyrgyz Moldova Mongolia Armenia Georgia Ukraine Azerb Kazak Russia Turkey CEECCA
GDPpcppp2007 1843 2000 2897 3222 4946 4694 6968 7618 10837 14705 12858 11796
g07-93 3,70 3,10 3,40 5,80 11,20 10,40 3,20 8,30 6,90 5,00 4,80 6,86
R&D-to-GDP ratio 0,84 1,00 1,10 1,02 0,97 2,35 0,67 1,13 2,41 1,94 1,78
Publications pp 1,00 1,00 1,11 1,00 1,32 3,92 1,22 1,05 1,05 1,54 1,59 1,74
Patents (USPTO) pp 1,00 1,00 1,00 1,00 1,01 1,03 1,01 1,00 1,00 1,03 1,01 1,03
BuyMake 3,20 2,80 3,30 2,70 3,10 2,70 3,80 3,70 3,30 3,40 3,30 3,25
Firm Technology
Absorption 3,80 3,70 4,30 4,40 4,10 4,10 4,50 5,10 4,40 4,10 5,10 4,45
Company spending on R&D 2,60 2,50 2,60 2,60 2,70 2,50 3,30 3,00 3,20 3,40 3,00 3,03