This is a repository copy of Quantifying age and model uncertainties in palaeoclimate data and dynamical climate models with a joint inferential analysis.
White Rose Research Online URL for this paper: http://eprints.whiterose.ac.uk/143482/
Version: Accepted Version
Article:
Carson, J., Crucifix, M., Preston, S. et al. (1 more author) (2019) Quantifying age and model uncertainties in palaeoclimate data and dynamical climate models with a joint inferential analysis. Proceedings of the Royal Society of London. Series A, Mathematical and physical sciences, 475 (2224). 20180854. ISSN 1364-503X
https://doi.org/10.1098/rspa.2018.0854
© 2019 The Royal Society. This is an author-produced version of a paper accepted for publication in Philosophical Transactions A: Mathematical, Physical and Engineering Sciences. Uploaded in accordance with the publisher's self-archiving policy.
Reuse
Items deposited in White Rose Research Online are protected by copyright, with all rights reserved unless indicated otherwise. They may be downloaded and/or printed for private study, or other acts as permitted by national copyright laws. The publisher or other rights holders may allow further reproduction and re-use of the full text version. This is indicated by the licence information on the White Rose Research Online record for the item.
Takedown
If you consider content in White Rose Research Online to be in breach of UK law, please notify us by
Quantifying Age and Model Uncertainties in
Palaeoclimate Data and Dynamical Climate Models
with a Joint Inferential Analysis
J. Carson
1∗, M. Crucifix
2, S. P. Preston
3and R. D. Wilkinson
41Department of Statistics, University of Warwick, Coventry CV4 7AL, United
King-dom
2Earth and Life Institute, Universite catholique de Louvain, 1348 Louvain-la-Neuve,
Belgium
3School of Mathematical Sciences, University of Nottingham, Nottingham NG7 2RD,
United Kingdom
4School of Mathematics and Statistics, University of Sheffield, Sheffield S10 2TN,
United Kingdom
Abstract
The study of palaeoclimates relies on information sampled in natural archives such as deep sea cores. Scientific investigations often use such information in multi-stage analyses, typically with an age model being fitted to a core to convert depths into ages at stage one. These age estimates are then used as inputs to develop, calibrate, or select climate models in a second stage of analysis. Here we show that such multi-stage approaches can lead to misleading conclusions, and develop a joint inferential approach for climate reconstruction, model calibration, and age estimation. As an illustration, we investigate the glacial-interglacial cycle, fitting both an age model and dynamical climate model to two benthic sediment cores spanning the past 780 kyr. To show the danger of a multi-stage analysis we sample ages from the posterior distribution, then perform model selection conditional on the sampled age estimates, mimicking standard practice. Doing so repeatedly for different samples leads to model selection conclusions that are substantially different from each other, and from the joint inferential analysis. We conclude that multi-stage analyses are insufficient when dealing with uncertainty, and that to draw sound conclusions the full joint inferential analysis should be performed.
1
Introduction
Our understanding of palaeoclimates is based on data taken from climate archives that are proxy for climatic variables, such as temperature, as well as models of the climate that mathematically formulate hypotheses about long-term climate dynamics. Sediment cores are commonly used climate archives, with measurements from different depths in the core relating to the climate at different points in time. These data can be used to produce reconstructions of past climates by converting depths into ages through the use of anage model, but doing so is a difficult process as the age-depth relationship is nonlinear, and there are typically only a few features present in a climate archive that can be used directly for dating. Mathematical models are used to investigate climate dynamics, and are often calibrated using these reconstructions in a separate stage of analysis. Care must be taken when interpreting the results of such calibrations, as any inferences from the model calibration might otherwise result from assumptions artificially embedded in the age model. In particular, many age models rely on assumptions about climate dynamics, creating a risk of circular reasoning when climate models are calibrated using the output of said age models [1].
There are numerous sources of uncertainty in each stage of the analysis; for example uncertainties in the age and parameter estimates, discrepancies between models and real-world system dynamics, and in how proxy measurements relate to climatic variables. Accurately quantifying these uncertainties, and in particular propagating uncertainties through the entire analysis, is essential if we are to trust in the conclusions from these investigations [2]. A multi-stage analysis offers no natural way to do so when strong dependencies exist between stages. The aim of this article is to demonstrate that a single joint inferential analysis of the problem can and should be performed. This has been made possible by advances in computational Bayesian statistical methodology that allow us to simultaneously solve the probability calculus for all of the unknowns. Using a joint inferential analysis avoids issues with circular reasoning, and ensures that uncertainties are propagated correctly throughout the investigation.
Our motivating example is the study of the glacial-interglacial cycle over the past 780 kyr. Over this period the climate oscillated between cold periods in which glaciers extended, and warm periods in which the glaciers retreated [3]. This is clear in, for example, benthic cores ofδ18O, which is a measurement of the ratio between18O and16O taken from calcite shells embedded in deep-sea sediment cores, and is primarily a function of global temperature and ice volume at the time the calcite shell was deposited [4, 5]. The tasks we aim to perform are fitting an age model to the sediment cores (age estimation), reconstructing components of the climate over time (climate reconstruction), estimating the parameters of a climate model (model calibration), and determining which models are best supported by the data (model selection). This is in some sense the statistical holy grail for analysing this problem [6], and has not been achieved before now (even for simple models) due to the computational complexities of such an approach.
Numerous climate reconstructions over this period have been obtained by averaging
δ18O measurements over multiple cores (known as stacking), and then fitting an age
tuning have been developed with the aim of verifying the Milankovitch hypothesis [9, 12]. Phenomenological models of the glacial-interglacial cycle are often characterized as either ordinary differential equations (ODEs) or stochastic differential equations (SDEs) that explicitly model a small number of climatic variables [13, 14]. These are consistent with the underlying dynamics of the system, but are not analytically derived from the laws that govern the physical processes. The models are typically astronomically forced, and so in a multi-stage analysis there is a clear risk of circular reasoning from calibrating such models using astronomically tuned age estimates. This danger has been demonstrated for model calibration and selection, which are extremely sensitive to the age estimates [15, 16]. However, this sensitivity is apparent even when different sets of age estimates are consistent with the estimated age uncertainty in the data [16]: two sets of age estimates that differ by an amount that is less than the error in the age estimates lead to conflicting conclusions about which models are more strongly supported by the data. This shows that fixing the age estimates and ignoring the age uncertainty can severely bias the results of a multi-stage analysis, regardless of the choice of age model. Due to strong mutual dependencies between the age estimates and the climate model, namely that the forcing in the climate model constrains the age estimates, and the age estimates influence the amount of forcing inferred in the model calibration, we must account for the uncertainty in these investigations by using a joint inferential analysis.
In this article we develop an approach for joint age, state, and parameter estimation, involving models of the climate and sediment accumulation, and proxy measurements taken from sediment cores. The algorithm we present is an extension of that employed in [16], which calibrates dynamical climate models using fixed age estimates. This extension is highly challenging, as to jointly infer the observation ages we must add a significant number of hidden variables that increase the dimension of the problem dramatically. We introduce a novel stochastic age model to reflect our prior beliefs about how age varies as a function of depth, and construct suitable proposal distributions to sample from the joint distribution of the ages and climate states. The output is a sample of age estimates, reconstructions, and estimates of the parameters in the age and climate models, that characterise the uncertainty in the inference. We believe that this is the first algorithm shown to be capable of jointly fitting an age model and a nonlinear dynamical climate model. The approach is tested on synthetic data, and then applied to two cores from the Ocean Drilling Program, ODP677 [17] and ODP846 [18], so that the age estimates from these cores can be compared with those of [8] and [9].
An additional output and advantage of our approach is that it allows for the estimation of the model evidence, which can be used for model selection. We investigate the impact of ignoring age uncertainty by sampling age estimates from the joint inferential analysis, and then keeping them fixed in a subsequent computational analysis in order to mimic a multi-stage analysis. We demonstrate that conclusions differ greatly between different sampled age estimates, further motivating the need for a joint inferential analysis.
2
Data and Models
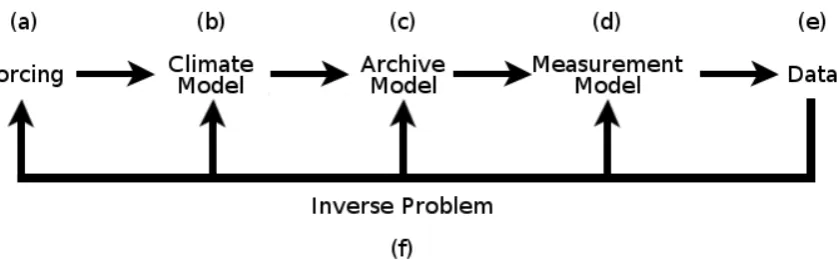
Figure 1: Illustration of the inverse problem. A set of models are used to describe the data generation process, and then the data are used to learn about these models.
Combining forward-models in an appropriate way for performing statistical inference in palaeoclimate investigations is discussed in [19]. The components we include are an astronomical forcing model (a) that drives a climate model (b); an archive model (c) that incorporates an age model relating core depths to ages, and a function linking proxy and climate variables; and a measurement model (d) relating observations (e) to the true values. This is summarized in Figure 1. The models used here are relatively simple, but even for these the inference is computationally challenging. However, in principle each component could be replaced by a more sophisticated choice, and, notwithstanding computational challenges, the inference methodology described in this article could still be used.
2.1
Forcing
The prevailing theory is that the glacial–interglacial cycle is primarily driven by the seasonal and spatial variation of incoming solar radiation, termed “insolation”, due to variations in the Earth’s orbit around the Sun. The orbit is characterized by precession, obliquity, and eccentricity. Precession refers to the angle, ̟, made between the point of perihelion (the point of the orbit when the Earth is closest to the Sun) and the vernal point marking the spring equinox, and as such determines when in the seasonal cycle the Earth is closest to the Sun. Obliquity is the angle between the equator and the orbital plane, and determines the insolation contrast between summer and winter. Eccentricity measures how much the Earth’s orbit deviates from a perfect circle (indicated by zero eccentricity), and hence modulates the effect of precession. It is often convenient to refer to climatic precession, esin̟, which combines the effects of eccentricity and precession in order to indicate the effect on the Northern Hemisphere summer insolation. Climatic precession can be complemented with coprecession, ecos̟, to effectively compute insolation at any time of year at any latitude [20]. In this article we compute these quantities using the algorithm in [20], which is suitably accurate over the past ∼1 Myr.
use a forcing function of the form
F(t;γ) =γPΠP(t) +γCΠC(t) +γEE(t), (1)
where ΠP(t), ΠC(t), and E(t), are the normalized climatic precession, coprecession, and
obliquity respectively. The parameter γ = (γP, γC, γE)⊤ weights the linear combination.
Particular choices of γ correspond to several forcing functions used in the literature, for example caloric summer insolation at 60◦ N as advocated by [10], or daily mean insolation
at 60◦ N summer solstice as used in [21]. The model is unforced when γ is set to zero.
2.2
Climate model
The astronomical forcing alone does not explain all of the features of the glacial-interglacial cycle, and so the internal dynamics of the climate system must also be con-sidered [21, 22]. The approach we follow is to model the Earth’s climate as a dynamical system forced by the variation in the insolation [14]. The complexity of the climate model is necessarily limited by the computational cost of generating model simulations. Many simple phenomenological models have been proposed, which typically comprise of a small number of differential equations representing hypothesized relationships between different aspects of the climate. Here we take the CR14 model (a modified version of [13]), which treats the climate model as a forced oscillator, i.e., the Earth’s climate would fluctuate between hot and cold periods in the absence of forcing, but the oscillation is paced by the astronomical forcing. In addition, we represent atmospheric variability as a stochastic process, resulting in the following SDE (suppressing dependence on time)
dX1 =− β0+β1X1+β2 X13−X1
+δX2+F (γ)
dt+σ1dW1
dX2 =αδ
X1+X2−
X3 2 3
dt+σ2dW2,
in which X1 is taken to be ice volume, and X2 is a non-physical variable acting to
switch between glacial and interglacial states. The parameter β0 scales the ice accumu-lation/ablation process depending on the sign, β1 scales a linear feedback process, β2 stabilizes the system when positive,δ is an inverse time scale,αcontrols the ratio of time scales betweenX1 and X2, and σ1 andσ2 scale the stochastic fluctuations. Finally,F (γ) is the forcing function given in Equation 1.
2.3
Archive model
the proxy model we assume a simple linear relationship between ice volume (X1), and
δ18O (denoted Z), i.e.,
Z =ψ+λX1,
The δ18O datasets we use in this article are taken from benthic sediment cores. Sed-iment accumulation is inherently stochastic, so as a starting point for the age model we model sediment accumulation by
dS =µsdt+σsdWs, (2)
where S is the amount of sediment (in meters), Ws a standard Brownian motion, and
the parameters µs and σs respectively control the mean and variance of the sediment
accumulation process. Under this model, sediment can accumulate and dissipate, but when µs >0 the trend is for linear accumulation over time.
Equation 2 can be inverted to give a model for the time, Tm, corresponding to some
core depth Hm, where 1 ≤ m ≤ M identifies core slices. Notationally we take larger
values of m to be nearer the top of the core (Hm < Hm−1), T = 0 as the present, S = 0 as the present sediment level, andH = 0 as the top of the core. When a core is sampled at depth Hm, the climate information recorded corresponds to the most recent time at
which S = −Hm. This gives a first passage time problem under the time reversal of
Equation 2, the solution of which is an inverse Gaussian distribution, so that
Tm−Tm−1 |Tm ∼ IG
Hm−1−Hm
µs
,(Hm−1−Hm)
2
σ2
s
!
. (3)
We can obtainp(Tm|Tm−1) using Bayes theorem by noting thatp(Tm) follows Equation
3 conditioned on present values.
This age model satisfies many of the desirable properties for Bayesian age models as summarised in [23]. In particular, age is a monotonic function of depth, the sediment rate can quickly vary between large and small values, and age uncertainty increases as the distance away from fixed age points (such as the present/core top) and dated core slices increases. However, in contrast to other Bayesian age models [23, 24] we have relaxed the monotonicity assumption for sediment accumulation over time. This is important because sediment erosion and dissolution are causes of hiatus events (in which a small change in depth is associated with a large difference in age) in benthic sediment cores [25].
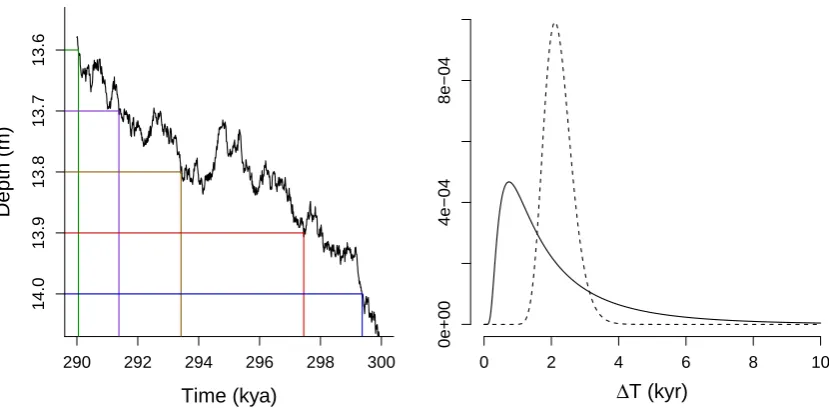
A realisation of the sediment accumulation model and the implied inverse Gaussian distribution for the age model are shown in Figure 2. For small values of σs the inverse
Gaussian distribution is centered around the mean, and hiatus events from sediment erosion and dissolution are rare. As σs increases, the sediment accumulation process is
more volatile, increasing the frequency of hiatus events resulting from sediment erosion and dissolution. Consequently, the inverse Gaussian distribution becomes increasingly skewed.
Time (kya)
Depth (m)
14.0
13.9
13.8
13.7
13.6
290 292 294 296 298 300 0 2 4 6 8 10
0e+00
4e−04
8e−04
[image:8.595.90.505.77.282.2]∆T (kyr)
Figure 2: Left: Realisation of the sediment accumulation model with µs = 4.5×10⁻⁵
and σs= 2×10⁻³. Horizontal lines show a sequence of core slices at 0.1 m intervals, and
the corresponding vertical lines show the associated ages. Right: The implied inverse Guassian profile for a depth change of 0.1 m with µs = 4.5×10⁻⁵ and σs = 2×10⁻³
(solid curve), and µs = 4.5×10⁻⁵ and σs = 4×10⁻⁴ (dashed curve). Asσs increases the
inverse Gaussian distribution becomes increasingly skewed.
two additional parameters that need to be inferred, the gradient,η, and the intercept, φ. The model transforms depth measurements into a non-compacted equivalent, using
ˆ
Hm =Hm+
η
1−φH
2
m,
which can then be substituted into Equation 3.
2.4
Measurement model
The final component in the forward modelling approach relates the output of the climate
model to measurements taken from palaeoclimate archives. For δ18O we use Gaussian
white noise measurement error,
Ym ∼ N(Zm, σ2y),
where Ym denotes the observation at depth Hm,Zm =Z(Tm), andσy scales the amount
2.5
Data
We use the ODP677 [17] and ODP846 [18] benthic sediment cores. Both an astronomically tuned age model [8] and a non-astronomically tuned age model [9] have been fitted to each core, giving two different sets of age estimates for each core for comparison. The BM reversal is identifiable in both ODP677 (at 30.4 m) and ODP846 (at 28.7 m), and so we take the measurements at these depths as the starting values. The number of
observations following the BM reversal are M = 363 and M = 308, for ODP677 and
ODP846 respectively.
2.6
Inverse problem
We employ a Bayesian approach that simultaneously estimates ages, model parameters, climate states, and chooses between models by estimating Bayes factors. Formally, we target the posterior distribution
p(θ, T1:M,X1:M |Y1:M)∝p(Y1:M |θ, T1:M,X1:M)p(X1:M |θ, T1:M)×
p(T1:M |θ)p(θ), (4)
where p(Y1:M |θ, T1:M,X1:M), p(X1:M |θ, T1:M), and p(T1:M |θ) are densities induced
by the forward models described in (a)–(d), and p(θ) is the user defined prior distribu-tion. Where possible we base our prior distribution on physical grounds. We constrain
γP and γE to be positive in line with Milankovitch theory, which suggests that a
pos-itive northern hemisphere insolation anomaly in summer encourages a reduction in ice volume over time [28]. Specifically, we choose exponential prior distributions for these parameters, allowing for the system to be weakly forced. The final astronomical forcing parameter,γC, influences the seasonal distribution of insolation. Since we lack knowledge
about whether more insolation in spring at the expense of autumn results in a positive or negative contribution to ice accumulation, we choose a Gaussian prior distribution cen-tred on zero (indicating summer solstice insolation). The prior distributions for the age model parameters, µs and σs, were selected by examining the sediment cores presented
in [8, 9], and the prior distributions for the compaction adjustment parameters,φ and η, were chosen based on the porosity profiles presented in [12]. The remaining parameters do not represent measurable quantities, making prior distribution specification on physical grounds impossible. Instead, prior distributions were selected based on trial simulations so that undesirable behaviours such as non-oscillating regimes, having extremely short or long cycles, and trajectories that diverge to infinity were all discouraged. Broadly speaking we choose weakly or moderately informative prior distributions depending upon the parameter. This approach for prior specification was taken in [16] for similar phe-nomenological models, and produced reasonable results that were robust to variations in the prior hyperparameters. The complete set of prior distributions for all three models is given in Table 1.
3
Methods
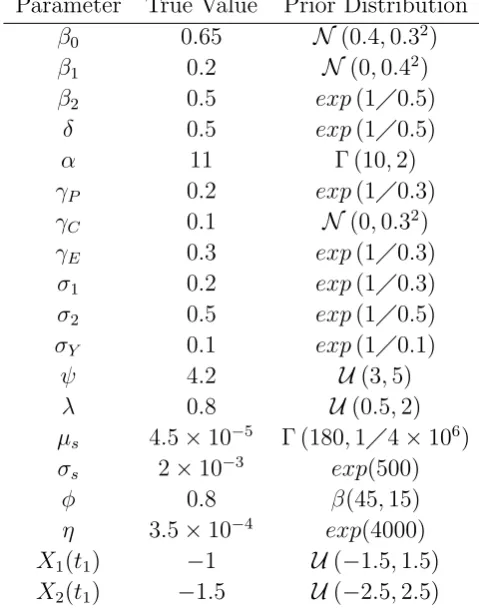
Table 1: List of parameters used to generate data for the simulation study, and the associated prior distributions used in the statistical analysis.
Parameter True Value Prior Distribution
β0 0.65 N(0.4,0.32)
β1 0.2 N (0,0.42)
β2 0.5 exp(10.5)
δ 0.5 exp(10.5)
α 11 Γ (10,2)
γP 0.2 exp(10.3)
γC 0.1 N (0,0.32)
γE 0.3 exp(10.3)
σ1 0.2 exp(10.3)
σ2 0.5 exp(10.5)
σY 0.1 exp(10.1)
ψ 4.2 U(3,5)
λ 0.8 U(0.5,2)
µs 4.5×10⁻⁵ Γ (180,14×10⁶)
σs 2×10⁻³ exp(500)
φ 0.8 β(45,15)
η 3.5×10⁻⁴ exp(4000)
X1(t1) −1 U(−1.5,1.5)
X2(t1) −1.5 U(−2.5,2.5)
one of which consists of a set of parameter values, climate reconstructions, and age
es-timates. Specifically we employ the sequential Monte Carlo squared (SMC2) algorithm
[29], which was previously implemented in [16] to test between competing phenomeno-logical models of the glacial-interglacial cycle in the absence of any age uncertainty. Here we extend the target distribution to also estimate the ages. SMC2 is advantageous as it requires little user input in selecting tuning parameters, and so can be applied to multiple models and data sets with relative ease.
Sequential Monte Carlo (SMC) algorithms [30] sample a target distribution, pM, by
propagating a weighted collection of ‘particles’ through a series of intermediary distribu-tions, {pm}Mm=1. The particles are initially sampled from an arbitrary tractable distribu-tion,p1, and the intermediary distributions are then chosen so as to gradually morph from
p1 topM. The gradual transition between distributions allows for the implementation of
an efficient sampling scheme in every iteration. The reason for using SMC methods is that they provide an unbiased estimate of the normalizing constant for each distribution that can then be used in parameter estimation or model selection.
For state space models it is common to initialize by settingp1 to be the prior distribu-tion, and to then add a single data point for every intermediary distribution. A well known example is the particle filter (PF) [31], which uses the sequence of filtering distributions
pm(X1:m) := p(X1:m | Y1:m,θ). Particles are sampled and propagated via importance
pro-posal density r1(X1 |Y1,θ), and given importance weight p(X1, Y1 |θ)r1(X1 |Y1,θ). In subsequent iterations the particles are resampled using a multinomial scheme, propa-gated via some proposal distribution rm(Xm | X1:m−1, Y1:m,θ), and reweighted so that
the particles are a weighted sample of the posterior p(X1:m |Y1:m,θ).
Here we extend the target distribution to also sample the ages, i.e., we use the se-quence of intermediary distributions pm(X1:m, T1:m) = p(X1:m, T1:m | Y1:m,θ). This
in turn requires us to extend the proposal distribution. Our approach is to use
a two-step proposal, proposing Tm from bm(Tm |Tm−1, Ym,θ), followed by Xm from
rm(Xm |Tm−1, Tm,Xm−1, Ym,θ). The full algorithm is described in Algorithm 1.
Using the PF, unbiased estimates of the normalizing constants p(Y1:m | θ) (termed
the likelihood) can be obtained in each iteration by noting that this normalizing constant can be decomposed as
p(Y1:m |θ) =p(Y1 |θ)
m
Y
j=2
p(Yj |Y1:j−1,θ).
Unbiased estimates of each of the components can be obtained by averaging the unnor-malised weights in the particle filter in each iteration, i.e.,
ˆ
p(Ym |Y1:m−1,θ) = 1
Nx Nx
X
k=1
ω(k)
m .
Taking the product of these unbiased estimates in turn gives an unbiased estimate, ˆ
p(Y1:m |θ), of p(Y1:m |θ) [32].
At the conclusion of the PF (once all of the data have been assimilated), we have an unbiased estimate of the likelihood, ˆp(Y1:M | θ). The unbiased likelihood estimates can
then be embedded within another Monte Carlo algorithm in order to perform parameter estimation (sampling from p(θ | Y1:M)). These are termed pseudo-marginal algorithms,
and are constructed in such a way as to target the correct posterior distribution, despite using the approximate likelihood ˆp(Y1:M | θ) in the Monte Carlo scheme [33]. Recent
examples include PMCMC [34], which embeds the PF within an MCMC algorithm, and SMC2[29], which embeds the PF within a second SMC algorithm. As we are interested in obtaining estimates of the normalizing constantp(Y1:M), we focus on the SMC2algorithm.
The SMC2 algorithm [29] embeds the particle filter within another SMC algorithm in order to target the sequence of posterior distributions
p0 =p(θ), pm =p(θ,X1:m |Y1:m),
for m = 1, . . . , M. The first step samples Nθ parameter particles, {θ(n)}Nθn=1, from the prior distribution, and attaches a PF of Nx state particles to each parameter particle.
As observations are assimilated, the attached PFs return unbiased estimates of the likeli-hoods,p(Y1:m|θ(n)), which are used to weight the parameter particles. The weights must
be carefully monitored in each iteration as a small number of particles tend to accumulate most of the weight, dominating the particle approximation. This is referred to as particle degeneracy, and is often monitored by tracking the effective sample size (ESS), defined as
ESS =
Nθ
X
i=1
W(i)
m
2 !−1
Algorithm 1Particle filter targeting p(T1:M,X1:M |Y1:M,θ).
fork= 1, ..., NX do
SampleT1(k)∼b1(T1|Y1,θ).
SampleX(1k)∼r1
X1|T(
k)
1 , Y1,θ
. Set the importance weight
ω(1k)=
pT1(k)|θpX1(k)|T1(k),θpY1|T(
k)
1 ,X (k) 1 ,θ
b1
T1(k)|Y1,θ
r1
X(1k)|T1(k), Y1,θ
.
end for
Normalize the weights. Fork= 1, ..., NX
Ω(1k)=
ω(1k)
PNX
i=1ω
(i) 1
.
form= 2, ..., M do fork= 1, ..., NX do
Sample ancestor particle indexa(mk−)1 with replacement from 1 :Nxaccording to weights Ω(1:
NX)
m−1 .
SampleTm(k)∼bm Tm|T
a(mk)
−1
m−1 , Ym,θ
! .
SampleX(mk)∼rm Xm|T
a(mk−)1
m−1 , T
(k)
m ,X
a(mk−)1
m−1 , Ym,θ
! .
Extend the particle trajectory
n
T1:(km),X(1:km) o
=
T(a
(k) m
−1)
1:m−1 , T
(k)
m
,
X(a
(k) m
−1)
1:m−1,X
(k)
m
.
Set the importance weight
ωm(k)=pYm|X(mk),θ
p Tm(k)|T
a(mk)
−1
m−1 ,θ
!
bm T(
k)
m |T
a(mk)
−1
m−1 , Ym,θ
!×
p X(mk)|X
a(mk)−1
m−1 , T
(k)
m , T
a(mk−)1
m−1 ,θ
!
rm X(mk)|T
a(mk−)1
m−1 , T
(k)
m ,X
a(mk−)1
m−1 , Ym,θ
!.
end for
Normalize the weights. Fork= 1, ..., NX
Ω(k)
m =
ω(mk) PNX
i=1ω
(i)
m
.
where nWm(i)
oNθ
i=1 are the normalized weights in population m. The particles can be
re-sampled when the ESS falls below some threshold (usually Nθ/2), so that low-weight
particles are discarded. Doing so equalizes the weights between particles, but leads to few unique particles in the parameter space. In SMC2 particle diversity can be improved after the resampling step by running a PMCMC algorithm that leaves p(θ,X1:m |Y1:m)
invariant [34], i.e. new values are proposed for each parameter particle, and a PF
per-formed up to timem conditional on the proposed parameters. The new parameter values
are then accepted or rejected according to the ratio of the posterior density estimates. The full algorithm, extended to include T1:M in the target, is given in Algorithm 2.
SMC2 also provides an estimate to the normalizing constant to Equation 4, termed
the model evidence. As with the PF, SMC2 makes use of the decomposition
p(Y1:M) = p(Y1)
M
Y
m=2
p(Ym |Y1:m−1).
The components are then estimated by averaging the unnormalised weights in each iter-ation, i.e.,
ˆ
p(Ym |Y1:m−1) =
Nθ
X
n=1
Wm(n−)1pˆ(Ym |Y1:m−1,θ(n)),
and an estimate of the model evidence is then obtained by substituting p(Ym | Y1:m−1) with ˆp(Ym | Y1:m−1). The ratio of model evidence terms between two models, i.e.
p(Y1:M | M1)/p(Y1:M | M2) where M1 and M2 are model identifiers, is the Bayes factor
of model M1 over M2, and indicates the relative explanatory power between the two
models [35]. Bayes factors are a commonly used tool for performing model selection in a Bayesian framework. Standard interpretations of the Bayes factor are described in [36]. The Bayes factors provide a principled way to undertake model selection, such as comparing two different phenomenological models, or different astronomical forcings.
3.1
Implementation details
There are several user-defined choices to make when implementing the algorithm. Firstly there are the proposal distributions in both the PF and the SMC algorithm in which it is contained. An advantage of SMC approaches is that we have a collection of par-ticles in each iteration that permits some automation of the proposals. For example, for the model parameters in the PMCMC component we use independent Gaussian proposals with the sample mean and covariance. In the PF, in the first iteration we initialize with the proposals b1(T1 |Y1,θ) ∼ N(780,2) (kyr ago), which is the obser-vation error distribution of the Brunhes-Matuyama (BM) geomagnetic reversal, and
r1(X1 |T1, Y1,θ) = p(X1), which is the prior distribution. Within the PMCMC steps, whenever the PF is reinitialized we replace these proposals with independent Gaussian proposals using the sample mean and covariance. As the PF progresses, for the ages we use the proposalbm(Tm |Tm−1, Ym,θ)∝p(Tm−1 |Tm), which is a reasonable
Algorithm 2SMC2 algorithm targeting p(θ,X
1:M, T1:M |Y1:M).
forn= 1, ..., Nθ do
Sampleθ(n) from the prior distribution,p(θ). Set the importance weight
W0(n)= 1
Nθ
.
end for
form= 1, ..., M do if ESS< Nθ
2 then
forn= 1, ..., Nθ do Sampleθ∗(n)
,T∗(1:NX,n)
1:m−1 andX∗ (1:NX,n)
1:m−1 fromθ (1:Nθ)
,T(1:NX,1:Nθ)
1:m−1 andX
(1:NX,1:Nθ)
1:m−1 , according
to weightsW(1:Nθ)
m−1 .
Sample θ∗∗(n), T∗∗(1:NX,n)
1:m−1 and X∗∗ (1:NX,n)
1:m−1 from a PMCMC algorithm targeting
p(θ,X1:m−1, T1:m−1|Y1:m−1) initialised withθ∗
(n)
,T∗(1:NX,n)
1:m−1 andX∗ (1:NX,n)
1:m−1 .
end for
Setθ(1:Nθ)
=θ∗∗(1:Nθ)
, T(1:NX,1:Nθ)
1:m−1 =T∗∗
(1:NX,1:Nθ)
1:m−1 andX
(1:NX,1:Nθ)
1:m−1 =X∗∗
(1:NX,1:Nθ)
1:m−1 .
Set the importance weights
Wm(n)
−1=
1
Nθ
forn= 1, ..., nθ.
end if
forn= 1, ..., Nθ do
SampleT(1:NX,n)
1:m ,X
(1:NX,n)
1:m by performing iterationmof the particle filter, and record estimates of ˆpYm|Y1:m−1,θ(n)
and ˆpY1:m|θ(n)
. Set the importance weights
w(mn)=Wm(n)
−1pˆ
Ym|Y1:m−1,θ
(n)
.
end for
Evaluate
ˆ
p(Ym|Y1:m−1) =
Nθ
X
i=1
wm(i).
Normalise the weights
Wm(n)= w
(n)
m PNθ
i=1w
(i)
m
for n= 1, ..., Nθ.
proposal distributions so that the transition density cancels from the importance weights,
which can be achieved by simulating each Xm from the climate model, i.e., by setting
rm = p(Xm | Tm−1, Tm,Xm−1,θ). However, this will typically lead to too many pro-posals being far from the observations, leading to particle degeneracy. Instead we use the proposals developed in [16] that guide proposals towards the next observation, giving more equal weights.
Secondly, we need to decide on a resampling scheme. Here we use multinomial re-sampling, which is the most commonly used resampling scheme, but alternatives such as stratified resampling usually give improvements in sample variance [37, 38].
Thirdly, we need to decide on the number of particles, Nθ and Nx, and the chain
length for the PMCMC rejuvenation steps. These choices are typically dictated by the
available computational resources. We use Nx = Nθ = 1000, and a chain length of 10,
which seems to maintain high particle diversity.
Finally, we check whether the algorithm has converged by ensuring that the results are consistent between independent runs.
4
Results
4.1
Joint inferential analysis reliably infers unobserved
compo-nents from synthetic data
We begin with a simulation study to demonstrate the ability of our joint inferential anal-ysis for age estimation, state estimation, parameter estimation, and model selection. We simulate a set of observations from the forward models, and then attempt to recover the true parameters, states, and ages. We also estimate the Bayes factors between the forced and unforced model to ensure that we can determine the importance of the astronomical forcing. Specifically, observation times were drawn from an imagined core of length 32m sampled at 0.1 m intervals, givingM = 321 observations. The first observation is a noisy measurement of the true age, where the noise is sampled from a Gaussian distribution with mean zero and a standard deviation of 2 kyr, as if we had observed the BM reversal. Figure 3 shows the simulated observations, and compares them with the 95% highest density regions (HDRs) for the estimated ages and states. The linear trend has been removed from the age versus depth plot so that the variation is more clearly visible. Note that the age-depth relationship is not a linear relationship (which would be a horizontal line), and in particular, there is a large period of time in which little sediment is deposited in the middle of the record. Despite this hiatus, the true ages are in regions of high pos-terior probability density throughout the dataset, showing that we are able to recover the ages. Likewise, the majority of the true values for both the observable and unobservable state variables lie within the 95% HDRs throughout the core. As would be expected, the posterior variance for the unobservable state is larger than for the observable state, particularly when the system switches between glacial and interglacial periods.
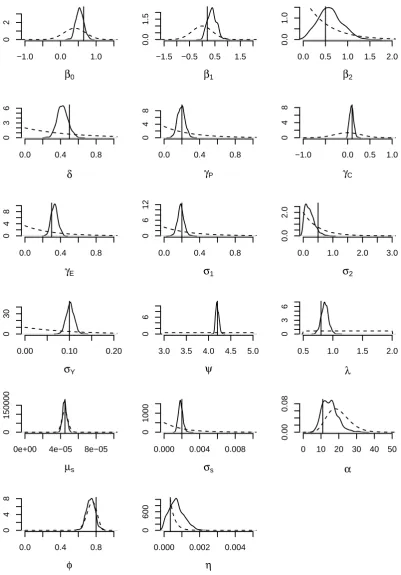
The marginal posterior distributions of the parameters and their true values are shown in Figure 4. The true parameter values lie in regions of high posterior probability density, demonstrating that we are able to recover the values used to generate the data. However,
3.0 4.0 5.0
δ
18O
●● ●●●●●● ●●●●● ●●●● ●●●● ●●●●● ●● ●●● ●●●●●●●● ● ●● ●●●●●●●●●● ●● ●●●●● ●● ●●●● ●●●●●● ● ● ● ●● ●● ●● ●●●● ● ● ●●● ● ●●●●●● ●● ● ●●●●●●●●●●● ●●●●●●● ●● ●●●●●●●●● ● ●●● ●● ●●●●●●● ●● ●●●●●●●●● ●● ●●● ● ●●● ●●● ● ●●●●●●● ● ● ●● ● ●●●●●●●●● ●●●● ●● ●●● ●●●● ●● ●● ●● ●●● ●●●●●●●●●●● ● ● ●● ●● ●●●●● ● ●●● ● ●●● ●●●●●●●●●●●● ● ●●●●● ● ●●●●●● ●● ●●●●●●●●●●●● ● ●● ●●●●● ●● ●●●●●●●●● ● ●●● ●● ● ●●● ●● ●●● ● ●●●●● ●●● ●Age anomaly
●● ●●●●●● ●●●●● ●●●● ●●●● ●●●●● ●● ●●● ●●●●●●●● ● ●● ●●●●●●●●●● ●● ●●●●● ●● ●●●● ●●●●●● ● ● ● ●● ●● ●● ●●●● ● ● ●●● ● ●●●●●● ●● ● ●●●●●●●●●●● ●●●●●●● ●● ●●●●●●●●● ● ●●● ●● ●●●●●●● ●● ●●●●●●●●● ●● ●●● ● ●●● ●●● ● ●●●●●●● ● ● ●● ● ●●●●●●●●● ●●●● ●● ●●● ●●●● ●● ●● ●● ●●● ●●●●●●●●●●● ● ● ●● ●● ●●●●● ● ●●● ● ●●● ●●●●●●●●●●●● ● ●●●●● ● ●●●●●● ●● ●●●●●●●●●●●● ● ●● ●●●●● ●● ●●●●●●●●● ● ●●● ●● ● ●●● ●● ●●● ● ●●●●● ●●● ● −30 0 30 ●●● ● ●●● ●●●●● ●●●●● ● ●●● ●●● ● ●● ●●●●● ● ●●●● ●●● ●● ●●● ●●●● ● ● ●● ●●●●●● ●● ●● ●●●●● ●● ● ● ● ● ●● ●● ●●● ● ●● ● ●●● ● ●●●●● ● ●● ●● ● ● ● ●●● ● ●●● ● ●●●●●●●●●●●● ● ●●●● ● ● ● ● ●●●●●●●● ●●●● ●●●●● ● ● ●● ● ● ●●● ● ● ● ●●●●● ●● ●●●●● ● ● ●● ● ● ●●●●●●●●●●● ● ● ● ●● ●●● ● ● ●●● ●●● ●●●● ●● ● ● ● ● ● ●● ●● ● ● ●●●●● ● ●●● ● ● ●● ● ● ● ● ● ● ● ● ●● ●● ●● ●●●● ● ● ● ● ● ● ●●● ●● ●●● ● ● ●● ●● ●● ●●● ● ●●●●●● ●●● ● ●●● ● ● ● ● ● ● ●●●● ● ●●● ●●●● ●●●●● ●● ●●●● −1.5 0.0 1.5X
1 ●●● ● ●●● ●●●●● ●●●●● ● ●●● ●●● ● ●● ●●●●● ● ●●●● ●●● ●● ●●● ●●●● ● ● ●● ●●●●●● ●● ●● ●●●●● ●● ● ● ● ● ●● ●● ●●● ● ●● ● ●●● ● ●●●●● ● ●● ●● ● ● ● ●●● ● ●●● ● ●●●●●●●●●●●● ● ●●●● ● ● ● ● ●●●●●●●● ●●●● ●●●●● ● ● ●● ● ● ●●● ● ● ● ●●●●● ●● ●●●●● ● ● ●● ● ● ●●●●●●●●●●● ● ● ● ●● ●●● ● ● ●●● ●●● ●●●● ●● ● ● ● ● ● ●● ●● ● ● ●●●●● ● ●●● ● ● ●● ● ● ● ● ● ● ● ● ●● ●● ●● ●●●● ● ● ● ● ● ● ●●● ●● ●●● ● ● ●● ●● ●● ●●● ● ●●●●●● ●●● ● ●●● ● ● ● ● ● ● ●●●● ● ●●● ●●●● ●●●●● ●● ●●●● ● ● ●●●●●●●●●●●●●● ● ●●●●●●● ●● ● ●● ● ● ● ● ●●● ●● ●●● ●●●● ● ● ●● ●●●● ● ●●●●●●● ● ● ●● ●●●●●●●●●●●●● ●● ●● ● ● ● ●●●●● ● ●● ●● ●● ● ● ● ● ● ● ● ●●●●●● ●●●●●●●●●●●● ●● ●●●● ●●●● ●●● ●●● ● ● ●●●●● ●●●● ●● ● ●● ●●●●●●●●●●●●● ●● ●●● ● ●● ● ●●● ● ●●●●● ●●● ● ●● ● ● ● ● ● ● ●●●●●● ● ●●●●●●●●●●●● ●●●● ●● ● ●●● ● ● ● ●●●●●● ● ● ● ●● ● ● ● ● ●●●●●●●●●●● ●● ●●●●●●●●●●●● ●● ● ● ●●●●●●●●● ●● ●●●●● ● ● ● ●●● ●● ● ●●●●●●●● ●●●●● ●●●●●●●●● ●X
2 ● ● ●●●●●●●●●●●●●● ● ●●●●●●● ●● ● ●● ● ● ● ● ●●● ●● ●●● ●●●● ● ● ●● ●●●● ● ●●●●●●● ● ● ●● ●●●●●●●●●●●●● ●● ●● ● ● ● ●●●●● ● ●● ●● ●● ● ● ● ● ● ● ● ●●●●●● ●●●●●●●●●●●● ●● ●●●● ●●●● ●●● ●●● ● ● ●●●●● ●●●● ●● ● ●● ●●●●●●●●●●●●● ●● ●●● ● ●● ● ●●● ● ●●●●● ●●● ● ●● ● ● ● ● ● ● ●●●●●● ● ●●●●●●●●●●●● ●●●● ●● ● ●●● ● ● ● ●●●●●● ● ● ● ●● ● ● ● ● ●●●●●●●●●●● ●● ●●●●●●●●●●●● ●● ● ● ●●●●●●●●● ●● ●●●●● ● ● ● ●●● ●● ● ●●●●●●●● ●●●●● ●●●●●●●●● ●32 28 24 20 16 12 8 4 0
−3
0
3
[image:16.595.81.514.164.593.2]Depth (m)
−1.0 0.0 1.0
0
2
β0
−1.5 −0.5 0.5 1.5
0.0
1.5
β1
0.0 0.5 1.0 1.5 2.0
0.0
1.0
β2
0.0 0.4 0.8
0
3
6
δ
0.0 0.4 0.8
0
4
8
γP
−1.0 0.0 0.5 1.0
0
4
8
γC
0.0 0.4 0.8
0
4
8
γE
0.0 0.4 0.8
0
6
12
σ1
0.0 1.0 2.0 3.0
0.0
2.0
σ2
0.00 0.10 0.20
0
30
σY
3.0 3.5 4.0 4.5 5.0
0
6
ψ
0.5 1.0 1.5 2.0
0
3
6
λ
0e+00 4e−05 8e−05
0
150000
µs
0.000 0.004 0.008
0
1000
σs
0 10 20 30 40 50
0.00
0.08
α
0.0 0.4 0.8
0
4
8
φ
0.000 0.002 0.004
0
600
[image:17.595.104.506.83.659.2]η
are very close to the prior distributions. This suggests that data are not informative about these parameters. For the purposes of interpretation we need to be careful, as estimates of these parameters will obviously be highly sensitive to the choice of prior distributions. Furthermore, care must be taken using SMC algorithms when the initial target distribution (in this case the prior distribution) concentrates mass in regions of low posterior density. In these cases very few particles will be initialised in regions of high posterior density, potentially leading to slow convergence of the algorithm or resulting in high variance estimates. Since we were conservative in our prior specification, selecting weakly or moderately informative prior distributions, this was not an issue here.
We repeat the analysis for these data but now using an unforced version of the CR14 model. We focus on the Bayes factor to determine whether we can infer the impor-tance of the astronomical forcing. The Bayes factor is approximately 109 in favour of the forced model, suggesting that even with the age uncertainty, the data strongly sup-port the forced model [16, 36]. The strength of the Bayes factor may result from the volatility of the driving Brownian motion. In the forced model the inferred value of σ1 is [0.126,0.281] (95% credible interval), whereas in the unforced model this increases to [0.323,0.493]. This suggests that in the unforced model the drift of the SDE frequently pulls the trajectory away from observations, which then needs to be corrected by large stochastic perturbations in order to fit the data.
This result suggests that even though we have a relatively small number of noisy measurements from a single core, we are able to correctly infer the importance of the astronomical forcing in the climate record, even after accounting for the uncertainty that arises from estimating 17 model parameters, the age-depth relationship, and the climate states. To ensure that this is a reasonable result, we can perform the model selection experiment on simulated data that has been generated with the unforced model. In this case, we find that the Bayes factor is 102 in favour of the unforced model, demonstrating that we are inferring the forcing parameters, and not simply assuming that the forcing plays a crucial role.
4.2
Reconstructions from ODP677 and ODP846 are consistent
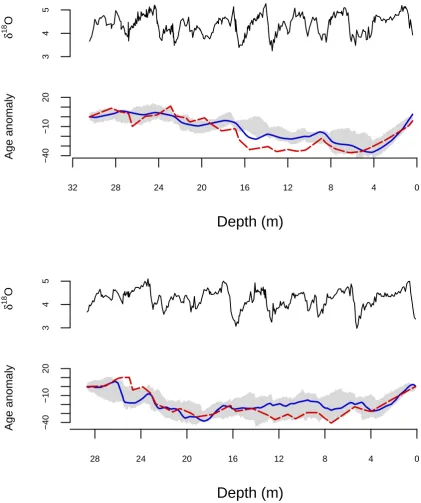
with LR04 but not H07
in the age estimates. However, the LR04 estimates are notably closer to the posterior mean. For both datasets it can be seen that using a linear age-depth relationship will lead to poor estimates of observation times.
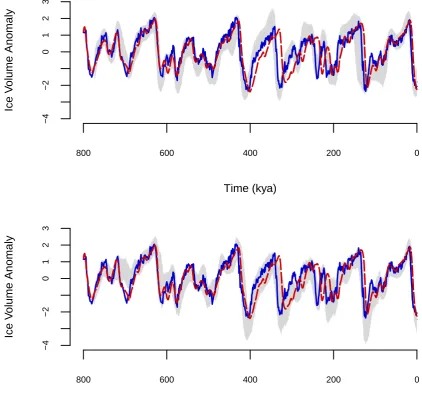
The sequence of 95% HDRs of the normalized ice volume vs time are shown in Figure 6. We include the LR04 and H07 stacks for comparison. It is reassuring that our ice-volume reconstructions from ODP677 and ODP846 are remarkably similar despite being obtained independently. The similarities with LR04 are again very striking, whereas H07 is out of agreement between 200 and 400 kyr ago. The likely reason is that the age estimates in the H07 stack are purely depth derived, and since this period is distant from the age-control points provided by the BM reversal and the present (core-top), the H07 reconstruction has low accuracy here.
Our approach has the advantage of using information on climate forcing, while pre-serving the possibility to test the alternative hypothesis that the astronomical forcing has no influence. Repeating the experiment using the unforced CR14 model yields Bayes factors in favour of the forced model against the unforced model of approximately 105 in ODP677, and 1 in ODP846. In other words, the forced model is strongly supported by ODP677, while evidence about astronomical forcing from ODP846 is weaker, but not contradictory.
4.3
Joint inferential analysis, as opposed to a multi-stage
anal-ysis, is essential
δ
18 O
3
4
5
−40
−10
20
Age anomaly
32 28 24 20 16 12 8 4 0
Depth (m)
δ
18
O
3
4
5
−40
−10
20
Age anomaly
28 24 20 16 12 8 4 0
[image:20.595.92.514.123.627.2]Depth (m)
800 600 400 200 0
−4
−2
0
1
2
3
Time (kya)
Ice V
olume Anomaly
800 600 400 200 0
−4
−2
0
1
2
3
Time (kya)
Ice V
[image:21.595.92.515.167.569.2]olume Anomaly
5
Conclusion
We have investigated an approach to calibrating dynamical climate models and testing between competing hypotheses via model selection, whilst jointly fitting an age model to a sediment core. Performing a joint inferential analysis in this manner is highly challeng-ing, requiring state of the art statistical methods and intensive computation (the analyses presented here each took six days on a standard desktop computer). Nevertheless there are notable advantages in undertaking a joint inferential analysis over splitting the anal-ysis between multiple stages. Firstly, the joint inferential analanal-ysis both estimates climate dynamics and forcings, and uses this information to constrain the ages, without the risk of circular reasoning. Secondly, we are able to characterize a range of uncertainties, and push these uncertainties forward into our conclusions, making those conclusions more reliable.
There are several ways in which the approach presented here could potentially be extended. Firstly, in each experiment we only utilize data from a single sediment core, and a natural extension is to combine observations from multiple cores. However, this is a non-trivial extension; with multiple cores the order in time of the observations is unknown, and so developing effective proposal distributions in a Monte Carlo approach is significantly more difficult. Secondly, numerous sources of uncertainty are not accounted for here. Examples include identification error for the BM reversal, and bioturbation in the sediment core. Such sources of uncertainty could be incorporated into the analysis by extending the models. Finally, the models considered here are all relatively simple, and could be replaced with more complex models. A primary obstacle in these extensions is the computational cost involved, which is already high when using simple models. Fortunately, sequential Monte Carlo methods such as those used here are amenable to parallelization, giving the possibility of dramatically improving computation times.
Our focus for model selection was testing between a forced and an unforced model for the glacial–interglacial cycle, but the joint inferential approach is relevant to a much wider range of investigations. Dynamical models can be used to investigate, for exam-ple, changes in oscillation regimes such as the mid-Pleistocene transition, abrupt changes during glacial periods such as Dansgaard–Oeschger events, and relationships between dif-ferent climate variables such as ice volume and CO2. In each of these cases the calibration of the dynamical model will be sensitive to the inferred ages of the observations. Testing between different hypotheses therefore requires effective joint quantification of age and model uncertainties, which can only be achieved by performing a joint inferential analysis.
Data Accessibility
Code and data supporting this manuscript are available from Zenodo https://doi.org/10.5281/zenodo.1973118 [39].
Authors’ Contributions
Competing Interests
We have no competing interests.
Funding
JC was funded by an EPSRC PhD studentship. RDW was supported by the EPSRC-funded Past Earth Network (Grant number EP/M008363/1). MC is supported by the Belgian National Fund of Scientific Research.
Acknowledgements
The authors thank the referees for their constructive comments and suggestions. JC also thanks Caitlin Buck for discussions during the completion of this work.
References
[1] Muller RA, MacDonald GJ. 1997 Glacial cycles and astronomical forcing. Science
277, 215–218. (doi:10.1126/science.277.5323.215)
[2] Blaauw M. 2012 Out of tune: the dangers of aligning proxy archives. Quat. Sci. Rev.
36, 38–49. (doi:10.1016/j.quascirev.2010.11.012)
[3] Shackleton NJ, et al. 1984 Oxygen isotope calibration of the onset of ice-rafting
and history of glaciation in the North Atlantic region. Nature 307, 620–623.
(doi:10.1038/307620a0)
[4] Emiliani, C. 1955 Pleistocene temperatures. J. Geol 63, 538–578.
(doi:10.1086/626295)
[5] Shackleton NJ. 1967 Oxygen isotope analyses and Pleistocene temperatures re-assessed. Nature 215, 15–17. (doi:10.1038/215015a0)
[6] Tingley M, Craigmile P, Haran M, Li B, Mannshardt E, Rajaratnam B. 2012 Piecing together the past: statistical insights into paleoclimatic reconstructions. Quat. Sci. Rev. 35, 1–22. (doi:10.1016/j.quascirev.2012.01.012)
[7] Imbrie J, Hays JD, Martinson DG, McIntyre A, Mix AC, Morley JJ, Pisias NG, Prell WL, Shackleton NJ. The orbital theory of Pleistocene climate: support from a revised chronology, of the marine δ18O record. In: Berger AL, Imbrie J, Hays JD, Kukla G, Saltzmann B, editors.Milankovitch and Climate, Part 1. Dordrecht: Reidel, p. 269–305.
[8] Lisiecki LE, Raymo ME. 2005 A Pliocene–Pleistocene stack of 57 globally distributed
δ18O records. Paleoceanography 20, PA1003. (doi:10.1029/2004PA001071)
[10] Milankovitch M. 1941Kanon der erdbestrahlung und seine anwendung auf das eiszeit-enproblem. Belgrade: K¨oniglich Serbische Akademie.
[11] Milankovitch M. 1998 Canon of insolation and the ice-age problem. Beograd: Naro-dna Biblioteka Srbije.
[12] Huybers P, Wunsch C. 2004 A depth-derived Pleistocene age model: uncertainty estimates, sedimentation variability, and nonlinear climate change. Paleoceanography
19, PA1028. (doi:10.1029/2002PA000857)
[13] Crucifix M. 2012 Oscillators and relaxation phenomena in Pleistocene climate theory.
Philos. Trans. R. Soc. London, Ser. A 370, 1140–1165. (doi:10.1098/rsta.2011.0315).
[14] Crucifix M. 2013 Why could ice ages be unpredictable? Clim. Past 9, 2253–2267.
(doi:10.5194/cp-9-2253-2013)
[15] Feng F, Bailer-Jones CAL. 2015 Obliquity and precession as
pace-makers of Pleistocene deglaciations. Quat. Sci. Rev. 122, 166–179.
(doi:10.1016/j.quascirev.2015.05.006)
[16] Carson J, Crucifix M, Preston S, Wilkinson RD. 2018 Bayesian model selec-tion for glacial-interglacial cycle. J. R. Stat. Soc. Ser. C Appl. Stat. 67, 25–54. (doi:10.1111/rssc.12222).
[17] Shackleton NJ, Berger A, Peltier WR. 1990 An alternative calibration of the lower
Pleistocene timescale based on ODP site 677. Trans. R. Soc. Edinburgh: Earth Sci.
81, 251–261. (doi:10.1017/S0263593300020782)
[18] Mix A, Le J, Shackleton NJ. 1995 Benthic foraminiferal stable isotope
stratigra-phy of site 846: 0–1.8 ma. Proc. Ocean Drill. Program Sci. Results. 138, 839–854.
(doi:10.2973/odp.proc.sr.138.160.1995)
[19] Sweeney J, Salter-Townshend M, Edwards T, Buck CE, Parnell AC. 2018 Statistical
challenges in estimating past climate changes. WIREs Comp. Stat. 10, e1437. (doi:
https://doi.org/10.1002/wics.1437)
[20] Berger AL. 1978 Long term variations of daily insolation and
Quater-nary climate changes. J. Atmos. Sci. 35, 2362–2367.
(doi:10.1175/1520-0469(1978)035¡2362:LTVODI¿2.0.CO;2)
[21] Imbrie J, Imbrie JZ. 1980 Modeling the climatic response to orbital variations. Sci-ence 207, 943–953. (doi:10.1126/science.207.4434.943)
[22] Raymo ME. 1997 The timing of major climate terminations. Paleoceanography 12,
577–585. (doi:10.1029/97PA01169)
[24] Blaauw M, Christeny JA. 2011 Flexible Paleoclimate Age-Depth Models Using an
Autoregressive Gamma Process. Bayesian Anal.6, 457–474. (doi:10.1214/11-BA618)
[25] Spencer-Cervato C. 1998 Changing depth distribution of hiatuses during the
Ceno-zoic. Paleoceanography 13, 178–182. (doi:10.1029/97PA03440)
[26] Bahr DB, Hutton EWH, Syvitski JPM, Pratson LF. 2001 Exponential
approx-imations to compacted sediment porosity profiles. Comput. Geosci. 27, 691–700.
(doi:10.1016/S0098-3004(00)00140-0)
[27] Singer BS, Pringle MS. 1996 Age and duration of the Matuyama–Brunhes geomag-netic polarity reversal from 40Ar39Ar incremental analysis of lavas. Earth Planet.
Sci. Lett. 139, 47–61. (doi:10.1016/0012-821X(96)00003-9)
[28] Berger A, Loutre MF. 2004 Astronomical theory of climate change.J. Phys. IV 121, 1–35. (doi:10.1051/jp4:2004121001)
[29] Chopin N, Jacob PE, Papaspiliopoulos O. 2013 SMC2: an efficient algorithm for
sequential analysis of state-space models. J. R. Stat. Soc. Ser. C Stat. Methodol. 75, 397–426. (doi:10.1111/j.1467-9868.2012.01046.x)
[30] Del Moral P, Doucet A, Jasra A. 2006 Sequential Monte Carlo samplers.J. R. Stat. Soc. Ser. C Stat. Methodol. 68, 411–436. (doi:10.1111/j.1467-9868.2006.00553.x)
[31] Gordon NJ, Salmond DJ, Smith AFM. 1993 Novel approach to nonlinear/non-Gaussian Bayesian state estimation.IEE Proc. F Radar Signal Process.140, 107–113. (doi:10.1049/ip-f-2.1993.0015)
[32] Del Moral P. 2004Feynman-Kac formulae. New York: Spring-Verlag.
[33] Andrieu C, Roberts GO. 2009 The pseudo-marginal approach for efficient Monte
Carlo computations. Ann. Stat. 37, 697–725. (doi:10.1214/07-AOS574)
[34] Andrieu C, Doucet A, Holenstein R. 2010 Particle Markov chain Monte Carlo methods. J. R. Stat. Soc. Ser. C Stat. Methodol. 72, 269–342. (doi:10.1111/j.1467-9868.2009.00736.x)
[35] Jeffreys H. 1939 The theory of probability. Oxford: Oxford University Press.
[36] Kass RE, Raftery AE. 1995 Bayes factors. J. Am. Stat. Assoc. 90, 773–795.
(doi:10.1080/01621459.1995.10476572)
[37] Liu JS, Chen R. 1998 Sequential Monte Carlo methods for dynamical systems. J.
Am. Stat. Assoc. 93, 1032–1044. (doi:10.1080/01621459.1998.10473765)
[38] Douc R, Capp´e O, Moulines E. 2005 Comparison of resampling schemes for par-ticle filtering. Proceedings of the 4th International Symposium on Image and Signal Processing and Analysis (ISPA 2005) 64–69. (doi:10.1109/ISPA.2005.195385)
[39] Carson J. 2018 JointPaleoAnalysis: Initial release. Zenodo.