1
Additional quantitative and semi-quantitative information to the report
A more research-intensive and
integrated European Research Area
Science, Technology and Competitiveness
Disclaimer
This document presents additional quantitative and semi-quantitative data from various
sources. Eurostat, OECD and DG Research are the sources for most of the data, however,
some data come from projects commissioned by DG Research or DG JRC and these data have
not yet been validated by the Commission services. Further methodological verification is
needed and the value of these data is mainly explorative, as a first step in an indicators
development process.
The presentation of the additional data follows the structure of the Science, Technology and
Competitiveness report. The list of graphs and tables complementing each chapter of the
report can be found at the beginning of this annex. All chapters do not necessarily have
complementary data. Some of the data in this document may form the basis for further
analysis, notably in the next edition of the report.
In conclusion, the data provided here may be difficult to interpret, are not exhaustive and need
further development. Comments by stakeholders on the coverage, relevance and interpretation
of the indicators provided, as well as observations on new indicators that could be employed
to improve the measurement of the development of the knowledge intensive economy and of
the European Research Area, are welcomed by the Commission services at
[email protected].
3
List of graphs, statistical tables and boxes
Part I: Investment in and performance of R&D in the European Research
Area
1. Supplementary data on R&D investment
6
FIGURE I.1.1 R&D intensity broken down by sector of performance, 2000 and 2006
FIGURE I.1.2 Venture Capital – early stage per thousand GDP
R&D investment in energy
8
FIGURE I.1.3 Government budget appropriations for energy
FIGURE I.1.4 Evolution of government budget appropriations for energy
Box I.1.1: Energy specialization in Member States - public expenditure
FIGURE I.1.5 Business enterprise expenditure on R&D in the energy sector
Box I.1.2: Energy specialization in Member States - private expenditure
2. Supplementary data on human resources
13
Expenditure on education
13
TABLE I.2.1 Expenditure on educational institutions by source as % of GDP, for all levels of
education combined, 2005
FIGURE I.2.1 Total public expenditure on education as % of GDP, for all levels of education
combined and at tertiary level (ISCED 5-6), 2001 and 2005
Education inflows
15
FIGURE I.2.2 % share of population aged 25-64 with tertiary education, 2000 and 2005
TABLE I.2.2 Graduates from tertiary education by field of education, 2005, and average annual
growth, 2000-2005
TABLE I.2.3 Total population, population aged 20-29 and share of age group 20-29 in total, 2000 and
2005, and average annual growth between 2000 and 2005
TABLE I.2.4 Doctoral graduates by field of education, 2005, and average annual growth 2000-2005
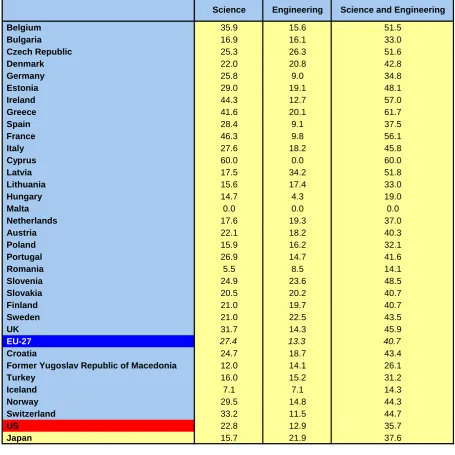
TABLE I.2.5 Science and Engineering doctoral graduates - % shares, 2005
Human resources for S&T (HRST) and researchers
19
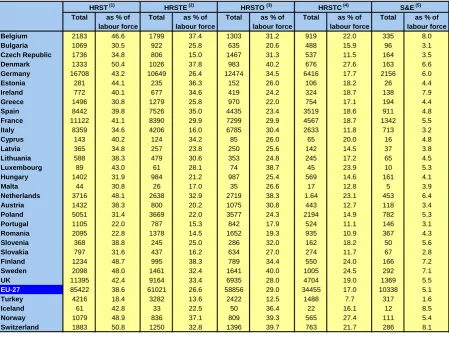
TABLE I.2.6 Human Resources for Science and Technology and sub-groups, 2006, totals (thousands),
and as % of labour force
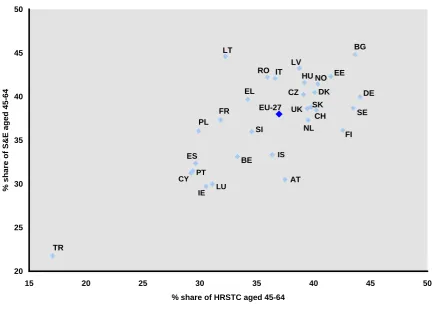
FIGURE I.2.3 Shares (%) of Human Resources in Science and Technology Core (HRSTC) and
Scientists and Engineers (S&E) aged 45-64, 2006
TABLE I.2.7 Human Resources in Science and Technology Core (HRSTC) and Scientists and
Engineers (S&E) – total aged 45-64, and as % of age group 25-64, 2006
Part II: Integration of the European Research Area
1. Supplementary data on higher education
23
TABLE II.1.1 Key data on the higher education sector, 2000 and 2006
TABLE II.1.2 Scientific production and visibility of the top 171 European Research Universities
measured as the number of scientific publications (1997-2006) and the field-normalized average
impact
TABLE II.1.3 Key recent reforms concerning universities
TABLE II.1.4 Key recent reforms concerning public research centres
2. Supplementary data on Research Infrastructures
34
TABLE II.2.1
FP6 networks of Research Infrastructures
3. Supplementary data on mobility of human resources
35
Human Resources for Science and Technology – Core (HRSTC)
35
Box II.3.1: Human Resources for Science and Technology – Core (HRSTC)
TABLE II.3.1 Number (thousands) and share (%) of foreign-born Human Resources in Science and
Technology Core (HRSTC), EU-27 foreign-born and non-EU-27 foreign-born, 15 Member States,
2006
FIGURE II.3.1 Foreign-born Human Resources in Science and Technology Core (HRSTC) in ten EU
Member States: numbers (thousands) and shares (%), 2000-2006
TABLE II.3.2 Number (thousands) and share (%) of non-nationals in Human Resources in Science
and Technology Core (HRSTC), 2000 and 2006, with average annual growth rates and evolution of
the shares (in percentage points), 2000-2006
TABLE II.3.3 Number (thousands) and share (%) of foreign-born Human Resources in Science and
Technology Core (HRSTC), 2000 and 2006, with average annual growth rates and evolution of the
shares (in percentage points), 2000-2006
European doctoral students in the US
38
TABLE II.3.4 U.S. doctoral degree recipients: total, foreign recipients, and recipients from Europe,
2000-2005
FIGURE II.3.2 Number of US doctoral recipients from the top eight EU Member States, 2000-2005
TABLE II.3.5 US S&E doctoral degree recipients: total, foreign recipients, and recipients from
Europe, 2000-2005
Marie Curie Individual Fellowships
39
5
FIGURE II.3.4 Marie Curie Intra-European Fellowships (IEF): % distribution of selected applicants
by country of citizenship (origin) and country of host institution (destination)
TABLE II.3.6 Marie Curie Intra-European Fellowships (IEF): intra-European inflows, outflows and
net gains of selected applicants
Box II.3.3: Mobility from and to Third Countries: Marie Curie International Incoming Fellowships
(IIF) and Outgoing International Fellowships (OIF)
TABLE II.3.7 Marie Curie Incoming International Fellowships (IIF): nationality and host country of
selected applicants
TABLE II.3.8 Marie Curie Outgoing International Fellowships (OIF): nationality and outgoing host
country of selected applicants
European Research Council (ERC)
44
Box II.3.4: ERC Starting Independent Researcher Grants
TABLE II.3.9 Applications by Principal Investigators for ERC Starting Grants: total number of
applicants and % distribution by country of origin
TABLE II.3.10 ERC Starting Grants for Principal Investigators: total number of selected applicants
and % distribution by country of origin
4. Supplementary data on knowledge sharing
47
FIGURE II.4.1 EU-27 - Scientific fields with the highest numbers of publications, 2000-2006
FIGURE II.4.2 Firms with foreign cooperation on innovation as % of all firms, 2002-2004
5. Supplementary data on international cooperation
49
Box II.5.1: The Fifth and Sixth Research Framework Programmes (FP5 and FP6)
TABLE II.5.1 FP5 and FP6 – All Third Countries - evolution of participations
and EC financial
contribution
FIGURE II.5.1 FP5 and FP6 – All Third Countries - evolution of the EC financial contribution by
world economic region
FIGURE II.5.2 FP5 - Thematic participation of selected Third Countries
by world economic region
FIGURE II.5.3 FP6 - Thematic participation of selected Third Countries by world economic region
Box II.5.2: The Seventh Research Framework Programme (FP7)
FIGURE II.5.4: FP7 - Cooperation Specific Programme - participation of Third Countries in proposals
selected for funding by thematic area: All Emerging Economies
FIGURE II.5.5 FP7 - Cooperation Specific Programme - participation of Third Countries in proposals
selected for funding by thematic area: All Industrialized Countries
FIGURE II.5.6 FP7 - Cooperation Specific Programme - participation of Third Countries in proposals
selected for funding by thematic area: All Developing Countries
Part I: Investment in and performance of R&D in the European Research
Area
1. Supplementary data on R&D investment
Source: DG Research STC key figures report 2008
Data: Eurostat, OECD
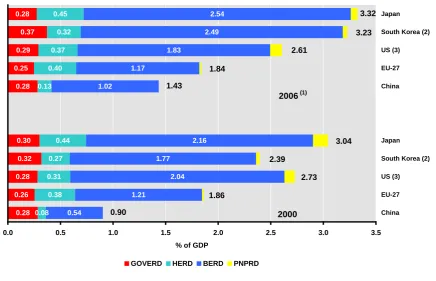
Notes: (1) JP : 2005
(2) KR : R&D in the social sciences and humanities is not included
[image:6.595.81.518.209.490.2](3) US : GERD, BERD and HERD do not include most or all capital expenditure; GOVERD refers to federal or central
FIGURE I.1.1 R&D intensity broken down by sector of performance, 2000 and 2006
(1)0.28
0.26
0.28
0.32
0.30
0.28
0.25
0.29
0.37
0.28
0.08
0.38
0.31
0.27
0.44
0.13
0.40
0.37
0.32
0.45
0.54
1.21
2.04
1.77
2.16
1.02
1.17
1.83
2.49
2.54
0.90
1.86
2.73
2.39
3.04
1.43
1.84
2.61
3.23
3.32
0.0
0.5
1.0
1.5
2.0
2.5
3.0
3.5
China EU-27 US (3) South Korea (2) Japan China EU-27 US (3) South Korea (2) Japan
% of GDP
GOVERD
HERD
BERD
PNPRD
2006
(1)7
Source:
DG Research
STC key figures report 2008
Data:
Eurostat
Notes:
(1) SK, US : 2000-2005; RO : 2005-2006
(2) SK, US : 2005
(3) EU-27 does not include BG, EE, CY, LV, LT, LU, MT, SI
FIGURE I.1.2 Venture Capital - early stage per thousand GDP - average annual
growth 2000-2006
(1); in brackets early stage per thousand GDP, 2006
(2)-53.7
-41.4
-40.9
-34.7
-30.0
-29.7
-28.3
-28.2
-27.8
-22.7
-22.0
-19.9
-15.1
-14.7
-6.6
-5.6
-4.8
-4.7
-2.6
1.4
6.3
13.7
38.7
-60
-40
-20
0
20
40
60
Czech Republic (0.00)
Poland (0.01)
Italy (0.02)
US (0.35)
Belgium (0.12)
Austria (0.03)
Netherlands (0.12)
Ireland (0.15)
Germany (0.11)
Greece (0.01)
Norway (0.13)
Finland (0.27)
France (0.30)
Portugal (0.10)
Sweden (0.57)
EU- 27 (3) (0.50)
Denmark (0.15)
Romania (0.04)
Spain (0.27)
Switzerland (0.23)
Hungary (0.05)
UK (2.22)
Slovakia (0.05)
R&D investment in energy
Source:
DG Research
STC key figures report 2008
Data:
Eurostat
Notes:
(1) Production, distribution and rational utilisation of energy (NABS 05)
(2) LV, HU, UK : 2005
(3) CH : 2004
(4) Others: all other EU-27 member states (excluding BG), NO, CH, IS
FIGURE I.1.3 Government bugdet appropriations for energy
(1)(million
euro); in brackets as % of total GBAORD
France; 663
(3.64%)
France; 719
(4.30%)
Germany ; 540
(3.03%)
Germany ; 491
(2.85%)
Italy; 359
(3.95%)
Italy; 382
(3.99%)
S
p
ai
n
;
171
(2.
24%)
S
p
ai
n
;
245
(2.
51%)
Others
(4); 505
Others
(4); 576
0
500
1000
1500
2000
2500
3000
2005 (3)
2006 (2)
9
Source:
DG Research
STC key figures report 2008
Data:
Eurostat
Note:
(1) Production, distribution and rational utilisation of energy (NABS 05)
FiIGURE I.1.4 Evolution of government budget appropriations for energy
(1)
as % of GDP
EU-15
US
JP
0.00
0.02
0.04
0.06
0.08
0.10
0.12
0.14
1995
1996
1997
1998
1999
2000
2001
2002
2003
2004
2005
%
o
f G
D
Box I.1.1: Energy specialization in Member States - public expenditure
1
The International Energy Agency (IEA) collects data from its members on government R&D
expenditure on energy and provides a detailed breakdown by energy sources. This makes it possible to
identify the energy technologies favoured by the countries covered in the IEA database. 17 EU
Member States are members of the IEA.
In 2005, in the 17 EU Member States for which data are available in the ERA database, nuclear energy
research accounted for 40% of total public expenditure on energy, compared to 15% in the US and
64% in Japan. France is the EU Member State with the highest public investment in nuclear research,
accounting for 62% of government R&D expenditure on energy, compared with from 0% to one third
in the other Member States. In absolute terms, France also has the highest expenditure on non-nuclear
research of the 17 Member States. The high share of nuclear research in the French government's
R&D energy budget accounts for much of the relatively high share of nuclear research (40%) in the 17
Member States' at aggregated level.
There are large differences between Member States in the setting of priorities. Although some
Member States invest in R&D on a wide range of energy technologies, other Member States tend to
specialise. For example, Austria and the Netherlands spend about 60% of their R&D energy budgets
on energy efficiency and renewables compared to an EU average of 30%. Denmark and Spain spend
16% and 15% of their respective budgets on wind energy; research on solar heating accounts for 52%
of the Portuguese budget; and 75% of the Hungarian budget goes to research in bioenergy. Danish
spending on research in hydrogen and fuel cells is the second highest in the EU after Germany. The
specialisation of some smaller countries can be an important element in the construction of an ERA in
non-nuclear energy R&D.
11
Source:
DG Research
STC key figures report 2008
Data:
Eurostat, OECD
Notes:
(1) BE, FR, UK : R&D by industry served (production field); Other countries : R&D by main activity
(2) NACE sectors : Mining and quarrying; Electrical machinery and apparatus; Coke, refined petroleum products
and nuclear fuel; Electriciy, gas and water supply
(3) FR: 2004
(4) Other EU-27 Member States (not including DK, LV and LU) and NO
[image:11.595.81.509.113.418.2](5) AT refers to 2004 and does not include Coke refined petroleum products and nuclear fuel
(6) IS, CH : Data are not available
FIGURE 1.1.5 Business enterprise expenditure on R&D (BERD)
(1)in the energy
sector
(2)(million euro), 2005; in brackets: as % of total BERD
France
(3); 1584
(7%)
Germany ; 1325
(3.4%)
UK; 1066
(5.4%)
Others
(4) (5); 1579
(3.5%)
0
1000
2000
3000
4000
5000
6000
2005
Box I.1.2: Energy specialization in Member States - private expenditure
2
13
2. Supplementary data on human resources
[image:13.595.69.526.166.593.2]Expenditure on education
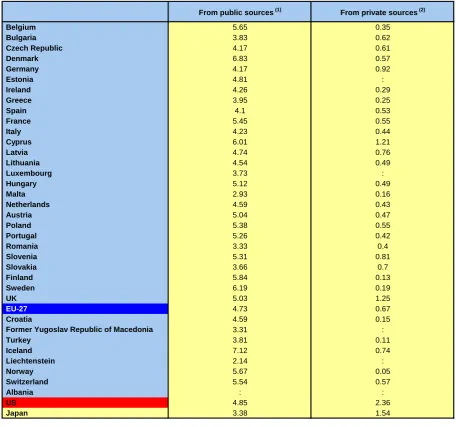
TABLE I.2.1 Expenditure on educational institutions by source as % of GDP, for all levels of
education combined, 2005
From public sources
(1)From private sources
(2)Belgium
5.65
0.35
Bulgaria
3.83
0.62
Czech Republic
4.17
0.61
Denmark
6.83
0.57
Germany
4.17
0.92
Estonia
4.81
:
Ireland
4.26
0.29
Greece
3.95
0.25
Spain
4.1
0.53
France
5.45
0.55
Italy
4.23
0.44
Cyprus
6.01
1.21
Latvia
4.74
0.76
Lithuania
4.54
0.49
Luxembourg
3.73
:
Hungary
5.12
0.49
Malta
2.93
0.16
Netherlands
4.59
0.43
Austria
5.04
0.47
Poland
5.38
0.55
Portugal
5.26
0.42
Romania
3.33
0.4
Slovenia
5.31
0.81
Slovakia
3.66
0.7
Finland
5.84
0.13
Sweden
6.19
0.19
UK
5.03
1.25
EU-27
4.73
0.67
Croatia
4.59
0.15
Former Yugoslav Republic of Macedonia
3.31
:
Turkey
3.81
0.11
Iceland
7.12
0.74
Liechtenstein
2.14
:
Norway
5.67
0.05
Switzerland
5.54
0.57
Albania
:
:
US
4.85
2.36
Japan
3.38
1.54
Source:
DG Research
STC key figures report 2008
Data:
Eurostat
Notes:
(1) MK : 2003; CZ, EE, TR, IS : 2004
Source: DG Research STC key figures report 2008
Data: Eurostat
[image:14.595.79.519.118.335.2]Notes: (1) HR, LI : 2002 (2) CZ, EE, TR, IS : 2004
FIGURE I.2.1 Total public expenditure on education as % of GDP, for all levels of education combined and
at tertiary level (ISCED 5-6), 2001
(1)and 2005
(2)0 1 2 3 4 5 6 7 8 9 Denm ark Icela nd Norw ay Sw eden Cypru s Fin land Bel gium Slov enia Sw itzer land Fran ce Pol
and UK
Hun gary Aust ria Por tuga l Net herl
andsLatvi
a EU-2 7 Esto nia Lith uani a US Irela nd Cro atia Ger man y Bul gari a Italy Cze
ch R
epub lic Spa in Turk ey Gre ece Slov akia Luxe mbo urg Japan Rom
aniaMalta
Liech
ten
stei
n
%
All levels of education 2001 All levels of education 2005 Tertiary level 2001 Tertiary level 2005
Source: DG Research STC key figures report 2008
Data: Eurostat
Note: (1) LT : 2001
FIGURE I.2.2 % share of population aged 25-64 with tertiary education, 2000
(1)and 2005
0 5 10 15 20 25 30 35 40 Fin land Denm ark Norw ay Esto nia Bel gium Cypru s Sw eden Irela nd Spa in Switz erla nd Net herlands UK Lith uani a Fran ce Luxe mbo urg Ger man y EU-2 7 Bul gari a Icela nd Gre ece Slov enia Latvi a Pol and Hun gary Aust ria Slov akia Cze ch R
epub lic
Por tuga
l ItalyMalta
[image:14.595.80.518.430.683.2]15
[image:15.595.74.524.146.545.2]Education inflows
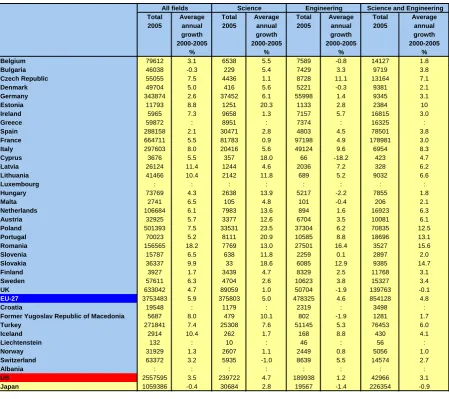
TABLE I.2.2
Graduates from tertiary education by field of education, 2005, and average annual growth, 2000-2005
(1)All fields Science Engineering Science and Engineering Total Average Total Average Total Average Total Average 2005 annual 2005 annual 2005 annual 2005 annual
growth growth growth growth
2000-2005 2000-2005 2000-2005 2000-2005
% % % %
Belgium 79612 3.1 6538 5.5 7589 -0.8 14127 1.8
Bulgaria 46038 -0.3 229 5.4 7429 3.3 9719 3.8
Czech Republic 55055 7.5 4436 1.1 8728 11.1 13164 7.1
Denmark 49704 5.0 416 5.6 5221 -0.3 9381 2.1
Germany 343874 2.6 37452 6.1 55998 1.4 9345 3.1
Estonia 11793 8.8 1251 20.3 1133 2.8 2384 10
Ireland 5965 7.3 9658 1.3 7157 5.7 16815 3.0
Greece 59872 : 8951 : 7374 : 16325 :
Spain 288158 2.1 30471 2.8 4803 4.5 78501 3.8
France 664711 5.5 81783 0.9 97198 4.9 178981 3.0
Italy 297603 8.0 20416 5.6 49124 9.6 6954 8.3
Cyprus 3676 5.5 357 18.0 66 -18.2 423 4.7
Latvia 26124 11.4 1244 4.6 2036 7.2 328 6.2
Lithuania 41466 10.4 2142 11.8 689 5.2 9032 6.6
Luxembourg : : : : : : : :
Hungary 73769 4.3 2638 13.9 5217 -2.2 7855 1.8
Malta 2741 6.5 105 4.8 101 -0.4 206 2.1
Netherlands 106684 6.1 7983 13.6 894 1.6 16923 6.3
Austria 32925 5.7 3377 12.6 6704 3.5 10081 6.1
Poland 501393 7.5 33531 23.5 37304 6.2 70835 12.5
Portugal 70023 5.2 8111 20.9 10585 8.8 18696 13.1
Romania 156565 18.2 7769 13.0 27501 16.4 3527 15.6
Slovenia 15787 6.5 638 11.8 2259 0.1 2897 2.0
Slovakia 36337 9.9 33 18.6 6085 12.9 9385 14.7
Finland 3927 1.7 3439 4.7 8329 2.5 11768 3.1
Sweden 57611 6.3 4704 2.6 10623 3.8 15327 3.4
UK 633042 4.7 89059 1.0 50704 -1.9 139763 -0.1
EU-27 3753483 5.9 375803 5.0 478325 4.6 854128 4.8
Croatia 19548 : 1179 : 2319 : 3498 :
Former Yugoslav Republic of Macedonia 5687 8.0 479 10.1 802 -1.9 1281 1.7
Turkey 271841 7.4 25308 7.6 51145 5.3 76453 6.0
Iceland 2914 10.4 262 1.7 168 8.8 430 4.1
Liechtenstein 132 : 10 : 46 : 56 :
Norway 31929 1.3 2607 1.1 2449 0.8 5056 1.0
Switzerland 63372 3.2 5935 -1.0 8639 5.5 14574 2.7
Albania : : : : : : : :
US 2557595 3.5 239722 4.7 189938 1.2 42966 3.1
Japan 1059386 -0.4 30684 2.8 19567 -1.4 226354 -0.9
Source: DG Research STC key figures report 2008
Data: Eurostat
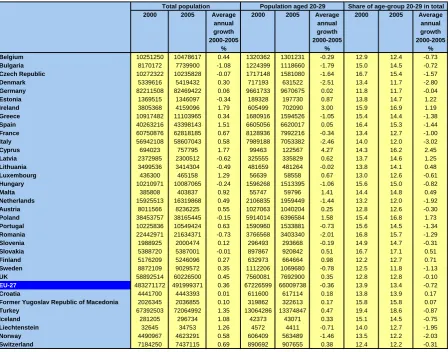
TABLE I.2.3 Total population, population aged 20-29 and share of age group 20-29 in total, 2000 and 2005
and average annual growth between 2000 and 2005
Total population Population aged 20-29 Share of age-group 20-29 in total 2000 2005 Average 2000 2005 Average 2000 2005 Average
annual annual annual
growth growth growth
2000-2005 2000-2005 2000-2005
% % %
Belgium 10251250 10478617 0.44 1320362 1301231 -0.29 12.9 12.4 -0.73
Bulgaria 8170172 7739900 -1.08 1224399 1118660 -1.79 15.0 14.5 -0.72
Czech Republic 10272322 10235828 -0.07 1717148 1581080 -1.64 16.7 15.4 -1.57
Denmark 5339616 5419432 0.30 717193 631522 -2.51 13.4 11.7 -2.80
Germany 82211508 82469422 0.06 9661733 9670675 0.02 11.8 11.7 -0.04
Estonia 1369515 1346097 -0.34 189328 197730 0.87 13.8 14.7 1.22
Ireland 3805368 4159096 1.79 605499 702090 3.00 15.9 16.9 1.19
Greece 10917482 11103965 0.34 1680916 1594526 -1.05 15.4 14.4 -1.38
Spain 40263216 43398143 1.51 6605056 6620017 0.05 16.4 15.3 -1.44
France 60750876 62818185 0.67 8128936 7992216 -0.34 13.4 12.7 -1.00
Italy 56942108 58607043 0.58 7989188 7053382 -2.46 14.0 12.0 -3.02
Cyprus 694023 757795 1.77 99463 122567 4.27 14.3 16.2 2.45
Latvia 2372985 2300512 -0.62 325555 335829 0.62 13.7 14.6 1.25
Lithuania 3499536 3414304 -0.49 481659 481264 -0.02 13.8 14.1 0.48
Luxembourg 436300 465158 1.29 56639 58558 0.67 13.0 12.6 -0.61
Hungary 10210971 10087065 -0.24 1596268 1513395 -1.06 15.6 15.0 -0.82
Malta 385808 403837 0.92 55747 59796 1.41 14.4 14.8 0.49
Netherlands 15925513 16319868 0.49 2106835 1959449 -1.44 13.2 12.0 -1.92
Austria 8011566 8236225 0.55 1027063 1040204 0.25 12.8 12.6 -0.30
Poland 38453757 38165445 -0.15 5914014 6396584 1.58 15.4 16.8 1.73
Portugal 10225836 10549424 0.63 1590960 1533881 -0.73 15.6 14.5 -1.34
Romania 22442971 21634371 -0.73 3766568 3403340 -2.01 16.8 15.7 -1.29
Slovenia 1988925 2000474 0.12 296493 293668 -0.19 14.9 14.7 -0.31
Slovakia 5388720 5387001 -0.01 897867 920842 0.51 16.7 17.1 0.51
Finland 5176209 5246096 0.27 632973 664664 0.98 12.2 12.7 0.71
Sweden 8872109 9029572 0.35 1112206 1069680 -0.78 12.5 11.8 -1.13
UK 58892514 60226500 0.45 7560081 7692900 0.35 12.8 12.8 -0.10
EU-27 483271172 491999371 0.36 67226599 66009738 -0.36 13.9 13.4 -0.72
Croatia 4441700 4443393 0.01 611600 617114 0.18 13.8 13.9 0.17
Former Yugoslav Republic of Macedonia 2026345 2036855 0.10 319862 322613 0.17 15.8 15.8 0.07
Turkey 67392503 72064992 1.35 13064286 13374847 0.47 19.4 18.6 -0.87
Iceland 281205 296734 1.08 42373 43071 0.33 15.1 14.5 -0.75
Liechtenstein 32645 34753 1.26 4572 4411 -0.71 14.0 12.7 -1.95
Norway 4490967 4623291 0.58 606409 563489 -1.46 13.5 12.2 -2.03
Switzerland 7184250 7437115 0.69 890692 907655 0.38 12.4 12.2 -0.31
Source: DG Research STC key figures report 2008
17
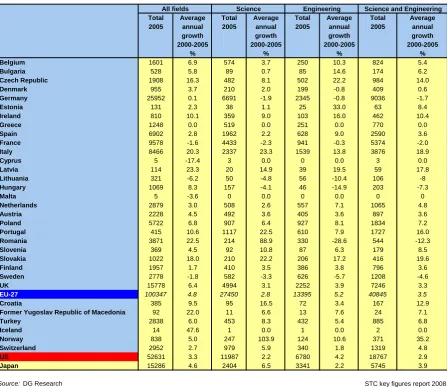
TABLE I.2.4 Doctoral graduates by field of education, 2005
(1), and average annual growth, 2000-2005
(2)All fields Science Engineering Science and Engineering Total Average Total Average Total Average Total Average 2005 annual 2005 annual 2005 annual 2005 annual
growth growth growth growth
2000-2005 2000-2005 2000-2005 2000-2005
% % % %
Belgium 1601 6.9 574 3.7 250 10.3 824 5.4
Bulgaria 528 5.8 89 0.7 85 14.6 174 6.2
Czech Republic 1908 16.3 482 8.1 502 22.2 984 14.0
Denmark 955 3.7 210 2.0 199 -0.8 409 0.6
Germany 25952 0.1 6691 -1.9 2345 -0.8 9036 -1.7
Estonia 131 2.3 38 1.1 25 33.0 63 8.4
Ireland 810 10.1 359 9.0 103 16.0 462 10.4
Greece 1248 0.0 519 0.0 251 0.0 770 0.0
Spain 6902 2.8 1962 2.2 628 9.0 2590 3.6
France 9578 -1.6 4433 -2.3 941 -0.3 5374 -2.0
Italy 8466 20.3 2337 23.3 1539 13.8 3876 18.9
Cyprus 5 -17.4 3 0.0 0 0.0 3 0.0
Latvia 114 23.3 20 14.9 39 19.5 59 17.8
Lithuania 321 -6.2 50 -4.8 56 -10.4 106 -8
Hungary 1069 8.3 157 -4.1 46 -14.9 203 -7.3
Malta 5 -3.6 0 0.0 0 0.0 0 0
Netherlands 2879 3.0 508 2.6 557 7.1 1065 4.8
Austria 2228 4.5 492 3.6 405 3.6 897 3.6
Poland 5722 6.8 907 6.4 927 8.1 1834 7.2
Portugal 415 10.6 1117 22.5 610 7.9 1727 16.0
Romania 3871 22.5 214 88.9 330 -28.6 544 -12.3
Slovenia 369 4.5 92 10.8 87 6.3 179 8.5
Slovakia 1022 18.0 210 22.2 206 17.2 416 19.6
Finland 1957 1.7 410 3.5 386 3.8 796 3.6
Sweden 2778 -1.8 582 -3.3 626 -5.7 1208 -4.6
UK 15778 6.4 4994 3.1 2252 3.9 7246 3.3
EU-27 100347 4.8 27450 2.8 13395 5.2 40845 3.5
Croatia 385 9.5 95 16.5 72 3.4 167 12.9
Former Yugoslav Republic of Macedonia 92 22.0 11 6.6 13 7.6 24 7.1
Turkey 2838 6.0 453 8.3 432 5.4 885 6.8
Iceland 14 47.6 1 0.0 1 0.0 2 0.0
Norway 838 5.0 247 103.9 124 10.6 371 35.2
Switzerland 2952 2.7 979 5.9 340 1.8 1319 4.8
US 52631 3.3 11987 2.2 6780 4.2 18767 2.9
Japan 15286 4.6 2404 6.5 3341 2.2 5745 3.9
Source: DG Research STC key figures report 2008
Data: Eurostat
Notes: (1) IT, CH (All fields) : 2004