Rochester Institute of Technology
RIT Scholar Works
Theses Thesis/Dissertation Collections
7-2016
Visual Odometry Estimation Using Selective
Features
Vishwas Venkatachalapathy [email protected]
Follow this and additional works at:http://scholarworks.rit.edu/theses
This Thesis is brought to you for free and open access by the Thesis/Dissertation Collections at RIT Scholar Works. It has been accepted for inclusion in Theses by an authorized administrator of RIT Scholar Works. For more information, please [email protected].
Recommended Citation
Visual Odometry Estimation Using Selective Features
By
Vishwas Venkatachalapathy
A Thesis Submitted in Partial Fulfillment of the Requirements for the Degree of Master of Science in Computer Engineering
Supervised by
Dr. Raymond W Ptucha Department of Computer Engineering
Kate Gleason College of Engineering Rochester Institute of Technology
Rochester, NY July,2016
Approved By:
_____________________________________________ ___________ _
Dr. Raymond W Ptucha
Primary Advisor – R.I.T. Dept. of Computer Engineering
_ __ ___________________________________ _________ ___
Dr. Andreas Savakis
Secondary Advisor – R.I.T. Dept. of Computer Engineering
_____________________________________________ _____________
Dr. Clark Hochgraf
Acknowledgements
Abstract
The rapid growth in computational power and technology has enabled the automotive industry to do extensive research into autonomous vehicles. So called self-driven cars are seen everywhere, being developed from many companies like, Google, Mercedes Benz, Delphi, Tesla, Uber and many others. One of the challenging tasks for these vehicles is to track incremental motion in runtime and to analyze surroundings for accurate localization. This crucial information is used by many internal systems like active suspension control, autonomous steering, lane change assist and many such applications. All these systems rely on incremental motion to infer logical conclusions. Measurement of incremental change in pose or perspective, in other words, changes in motion, measured using visual only information is called Visual Odometry. This thesis proposes an approach to solve the Visual Odometry problem by using stereo-camera vision to incrementally estimate the pose of a vehicle by examining changes that motion induces on the background in the frame captured from stereo cameras.
The approach in this thesis research uses a selective feature based motion tracking method to track the motion of the vehicle by analyzing the motion of its static surroundings and discarding the motion induced by dynamic background (outliers). The proposed approach considers that the surrounding may have moving objects like a truck, a car or a pedestrian body which has its own motion which may be different with respect to the vehicle. Use of stereo camera adds depth information which provides more crucial information necessary for detecting and rejecting outliers. Refining the interest point location using sinusoidal interpolation further increases the accuracy of the motion estimation results. The results show that by using a process that chooses features only on the static background and by tracking these features accurately, robust semantic information can be obtained.
Table of Contents
Acknowledgements ... iii
Abstract ... iv
List of Figures ... vi
List of Tables ... vii
Chapter 1 Introduction ... 1
1.1. Odometer and Odometry ... 1
1.2. Visual Odometry ... 2
1.3. Visually Aided Inertial Odometry ... 2
1.4. Stereo and Monocular Visual Odometry ... 2
Chapter 2 : Motivation from Previous Work ... 5
Chapter 3 : Datasets ... 9
Chapter 4 : Methodology ... 11
4.1. Proposed Algorithm ... 12
4.2. Lens Distorsion: ... 14
4.3. Rectification/ Calibration : ... 16
4.4. Feature Detection... 19
4.5. Feature Description and Matching ... 25
4.6. Depth Computation ... 28
4.7. Pose Estimation ... 35
Chapter 5 : Experiments ... 38
Chapter 6 : Conclusion ... 50
Bibliography ... 51
Chapter 7 Appendix A ... 55
7.1. Stereo Camera Setup ... 55
7.2. Accessing images from Cameras ... 58
7.3. Calibration of the Cameras ... 61
List of Figures
Figure 3-1 Sequence path traced in KITTI dataset [47]. ... 9
Figure 3-2 Setup used for data collection in KITTI dataset [47]. ... 9
Figure 3-3 Path traced by the robot in New college dataset [46]. ... 10
Figure 3-4 Robot used for new College Dataset [46]. ... 10
Figure 4-1Block diagram of the proposed approach... 11
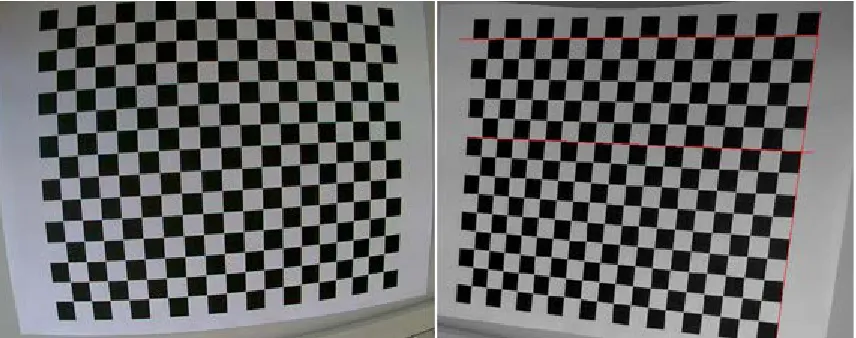
Figure 4-2 Checkerboard pattern before and after removing lense distortion. ... 15
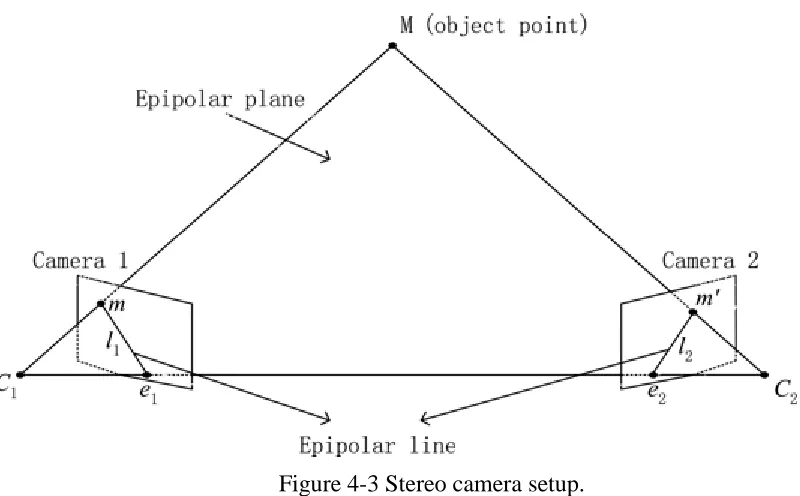
Figure 4-3 Stereo camera setup... 16
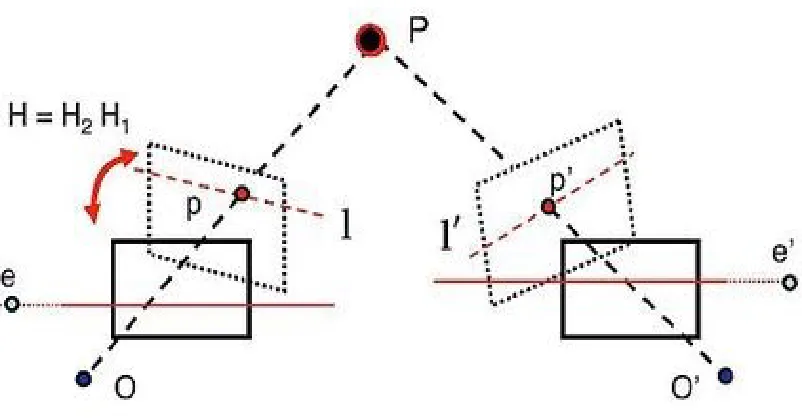
Figure 4-4 Stereo camera pose rectification. ... 17
Figure 4-5 Feature matching in the stereo pair ... 17
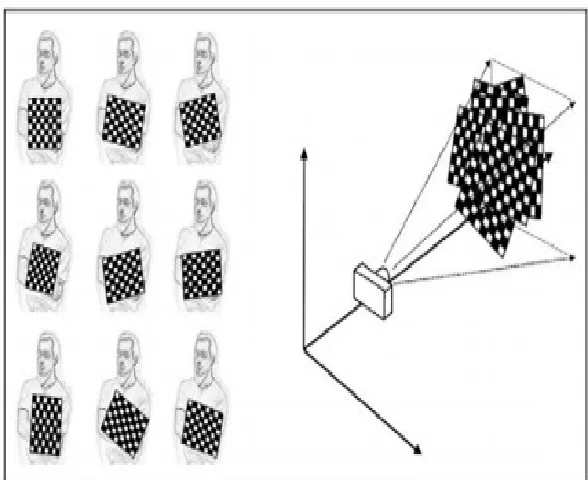
Figure 4-6 Multiple orientations of the checkerboard to estimate camera caliberation parameters. ... 18
Figure 4-7 Image showing the interest point under test and the 16 pixels on the circle [27]. ... 19
Figure 4-8 Pixel p and its neighboring pixels in a vector form [5]. ... 21
Figure 4-9 Fast key points, green dots show the Non-maximally suppressed corners [5]. ... 22
Figure 4-10 Features concentrated around regions with high intensity variations ... 23
Figure 4-12 Image bucketing or windowing. ... 23
Figure 4-13 Features generated from ddaptive feature generation. ... 24
Figure 4-14 Graph showing no. of feature generted by using fixed FAST thresholding. ... 24
Figure 4-15 Graph showing no. of features generted by using adaptive FAST thresholding... 24
Figure 4-16 Feature tracking. ... 25
Figure 4-17 Optical flow features being captures for t and t-1 time instances. ... 27
Figure 4-18 Stereo images overlaid from KITTI dataset, notice the feature matches are along parallel (horizontal) lines[50]. ... 28
Figure 4-19 A disparity map computed on frames from KITTI VO dataset [50]. ... 29
Figure 4-20 Projection matrix for left and right stereo cameras. ... 29
Figure 4-21 Feature tracking through DoG [40] pyramid. ... 30
Figure 4-22 Feature matching from left to right pyramid. ... 31
Figure 4-23 Sinusoidal Sub pixel interpolation. ... 32
Figure 4-24 Motion of a pixel w.r.t to its depth. ... 32
Figure 4-25 Geometrical representaion of sterero camera setup. ... 33
Figure 4-26 Triangular congruency in the stereo camera setup. ... 33
Figure 4-27 Outlier feature detection using prediction error. ... 37
7-1 Camera baseline distance. ... 56
Figure 7-2 Stereo camera setup on golfkart. ... 56
Figure 7-3 Stereo Camera Configuration. ... 57
7-4 Login snapshot of Hik-Vision Camera. ... 58
Figure 7-5 Output Video config snapshot . ... 59
Figure 7-6 Output Camer ID snapshot. ... 59
Figure 7-7 Output Streaming protocol and its authentication snapshot. ... 59
Figure 7-8 Checker board pattern for camera caliberation. ... 62
List of Tables
Table 5-1 Subpixel regression Statistics. ... 39
Table 5-2 Execution time for each step. ... 40
Table 5-3 RMS Error for data based on date ... 45
Table 5-4 RMS Error for data based on content. ... 45
Table 5-5 Translational and rotational result for all the sequences of KITTI dataset. 46 Table 5-6 New college dataset results fro translation and rotation. ... 49
Table 5-7 Result comparision with state of the art approaches. ... 49
Chapter 1
Introduction
One of the significant challenges for both autonomous cars and robots is to find the current position and heading, either globally or locally. To understand globally, is to know the exact position in the real world (e.g. global positioning system), and to understand locally is with reference to a particular starting point. This knowledge is very essential when the return path has to be traced or when the path changes and then rerouting has to be done for these robots or moving objects. Hardware sensors can gather acceleration and rotation information, but lack the potential to detect any other information, such as, wheel slip and drift over time. Visual odometry can provide that crucially needed extra information, that we humans make use of everyday. Visual Odometry is a concept that came to life inspired by human’s ability to analyze motion using visual data. Visual information is so rich of information, and if analyzed could provide a lot more than what’s necessary. Humans analyze visual information using our incredible brain that has evolved over millions of years, and just now computers are starting to possess some of these capabilities. This thesis research focuses on problems and solutions in analyzing visual data to capture self-motion of an object. Visual data can provide information regarding the surroundings, obstacles and also reconstruction of the scene to make informed decisions. Different camera setups can help visualize the world in either 2D or 3D perspective.
1.1. Odometer and Odometry
1.2. Visual Odometry
Motion Estimation / Pose estimation at discrete time intervals using visual data like images or depth data from sensors like cameras and Lidars is termed as Visual odometry.. Visual data is captured from a sensor rigidly attached to the body of robot,for which the motion estimation is of intrest. This visual data is used to used to generate real world motion trajectory using the visual data stream.,. The visual data may also be used for inferring other information like objects in the scene, localization and many more applications. Use of different sensors provides different information to be processed. Stereo cameras, like the human eyes, are two identical cameras fitted into a solid structure to provide images along with stereoscopic depth. A single monocular camera provides image data that would lack a degree of freedom when compared to the stereo cameras, but can be very efficient when compared with a ranging sensor.
1.3. Visually Aided Inertial Odometry
The idea of combining both the visual and the inertial information to get good results was proposed during the early research for the space exploration rovers. This idea uses visual and inertial data to infer the change is pose of the object. This approach uses either loose coupling or tight coupling of the data. Loose coupling is when both the visual and the inertial data are processed independently and the results are refined or coupled together. In case of tight coupling both the visual and inertial information are used together to predict the result.
1.4. Stereo and Monocular Visual Odometry
using a ranging sensor along with monocular cameras. Farther the objects in the scene more erroneous it is to compute depth, and if majority of the objects in the scene are farther away in the scene, when compared to the baseline distance between the cameras, its beneficial to use a monocular visual odometry algorithm like Semi direct monocular Visual Odometry (SVO) [2].
For this thesis research, stereo visual odometry estimation is investigated. Adaptive feature detectors and selective features for motion estimation are used, such as Horn’s quaternion equation [1]. The use of adaptive feature detectors enhances the feature count and hence the information content gathered from the image. The selective feature extractor helps in avoiding features on moving objects, hence avoiding dynamic background and only considering static background for motion estimation. The use of Horn’s quaternion equation [1], aided by a perspective transform for motion estimation, helps to find motion estimation quicker and more reliably. The motion estimation process often produces speckle errors and hence smoothening of results generally improves results. The use of multiple previous frames for motion refinement helps in selecting robust and reliable features on the static background and using them for accurate motion estimation. Current state of the art algorithms improve results by post processing, like loop closure detection for trajectory correction and localization for position refinement. Without such post processing, there usually is a huge error that gets accumulated over time. The approach described in this thesis tries to reduce the accumulated run time error. When used with loop closure detection or other post processing, this can yield much more accurate results.
Novel contributions in this thesis research include:
• Use of adaptive feature generation, to generate dynamically distributed sparse features throughout the image.
• Use of windowing and adaptive Features from Accelerated Segment Test (FAST) thresholding to acquire constant number of robust features for efficient tracking through multiple frames.
• Use of Sum of Absolute Difference (SAD) /Normalized Cross Correlation (NCC) with sub pixel interpolation for efficient feature matching.
Chapter 2
: Motivation from Previous Work
Visual odometry, finds its roots from a problem commonly known as structure from motion (SFM). SFM is a problem of recovering relative camera pose of the body and its 3D structure from a set of camera’s, which could be either calibrated or non-calibrated (epipolar plane). It was initially solved in [3], [4] and [5]. The concept of visual odometry was coined in 2004 in [3] and used dense stereo matching along with optical flow to estimate motion. In [4] and [5] concepts related to 3D projections, camera calibration, and baseline optimization were introduced. C Harris and J Pike [4] put forth the idea of position integration from consecutive frames to find out the end position with respect to the origin. SFM covers wider application like 3D reconstruction, but still needs visual odometry to track the position at which different image sets are taken. These image sets may be consecutive or in-ordered, and hence is usually processed offline. Such applications are time consuming and its time complexity increases with increase in number of image sets. The resultant structure and the pose of the cameras with which the images were captured are processed using offline optimizations like bundle adjustment [6]. Post processing algorithms like Bundle adjustment can be used to refine the local estimate of the trajectory.
While bundle adjustment [6] works on image sets that are captured non-consecutively, visual odometry processes image sets taken sequentially to track incremental changes that help in building a resultant motion map. Visual odometry is estimated in real-time, processes sets of image frames independently.
In early 1980’s, Moravec [7] started to solve the problem of a vehicle’s egomotion from visual input alone. Much of the early research following Moravec [45] was aimed at precise visual odometry for planetary rovers and it gained much more interest by NASA’s Mar’s exploration program. It was during this period where a lot of advantages and drawbacks of using visual only method for tracking vehicle’s egomotion was discovered and these outcomes inspired this thesis’ research into visual odometry. Providing 6-degree-of-freedom (DoF) for rover’s motion and overcoming wheel slippage in rough terrains were some important problems. Moravec‘s [45] work laid the foundation of egomotion estimation by presenting the first motion-estimation approach.
stereo camera approach. Since the camera was mounted on a slider which was level and the camera’s pose was fixed, the camera had epiploic geometry. The cameras baseline distance was the length of the slider bar and this information made calculations easier. The main assumption is that neither the robot, nor the surrounding moves during the image capturing stage. Once the images were captured, corners in one image were detected using Morvec’s corner detector [9] and these corners are matched to the right image using NCC (Normalized Cross Correlation). These corners are tracked to the next consecutive frame capturing the incremental motion of the robot using optical flow. Variance in the overall flow and discrepancies in the neighboring pixel depth information of the features can be outlined for outlier rejection. With the set of 3D points tracked between subsequent frames, rigid body transformation is used to align triangulated 3D points. Weighted least square of the triangulation vector of features based on their weights was used to reduce mean error in solving the equation obtained from two sets of 3D points. Once the camera captures the nine images and analyze these images for motion estimation, the robot would move. The motion in between the image capturing stage was very minimal and hence the speed at which the robot could travel was restricted. This was a major drawback. Moravec visualized the stereo camera by setting up a camera free to slide on an axis perpendicular to the scene being captured. As the sliding is done at known distances and the images captures are from single camera, they depict stereo image pair. This approach proved to be more accurate in terms of depth computation, as the stereo computation could be done over multiple images captured at discrete known distances.
Shafer [10], [11] improvised Moravec’s algorithm by utilizing the features error covariance matrix for motion estimation. This extra information demonstrated superior results in pose estimation and motion correction for rovers used in space exploration. Olson et al. [12], [48] approached the problem with a separate hardware sensor to measure the orientation of the camera sensor and used Forester corner detector for feature detection as they are much faster over Moravec’s operator. They described issues with egomotion estimation and the problem of error accumulation over time. This error from each estimation process, however small it may be, over time gets accumulated and would completely corrupt the position information. Lacroix et al. [14] described the importance of the key points in his implementation of stereo visual odometry for planetary exploration rovers. They used a dense stereo matching approach to cluster regions with similar depth and to track the motion of this region. The idea behind this approach was that the background can be classified into regions like buildings and trees and then tracking these regions would result in better accuracies. Features were clustered by their depth with the neighboring pixels as in [15], [34] as the shape of the correlation curve and the standard deviation of features depth are directly proportional. Cheng et al. [17], [18] implemented visual odometry onboard the Mars rovers, utilizing the same approach. The approach worked better as more information of the feature pertaining to its correlation function was utilized and the use of RANdom SAmple Consensus (RANSAC) [6] for outlier rejection. Milella and Siegwart [13] proposed a different approach using the Shi-Tomasi approach [19] for corner detection. This approach weighted features based on a score which depicted the robustness and reliability of the feature in predicting motion estimation. Using least squares, motion estimation was solved and then the Iterative Closest Point (ICP) algorithm [20] was used for pose refinement.
Visual Odometry was termed by Nister et al. [3]. He proposed real time implementation of motion estimation with robust outlier rejection algorithm. In this approach features were not tracked over consecutive frames rather they are detected for every stereo pair. Their approach estimated the camera pose as a 3-D-to-two-dimensional (2-D) problem and rejected outliers using RANSAC.
reducing computation time and speeds the estimation process. One key assumption that is considered in this approach is that the regions segmented in the image have a uniform motion, which may not always be true. Also this approach fails to work for scenes with a lot of regions like densely crowded city streets.
Huang et al. [24] developed Fast Visual odometry from Vision which is very similar to the approach proposed in this thesis but the process of estimation motion uses the sum of squared pixel error between frames. Frames in real-time are prone to exposure, white balance and many other illumination changes. This approach assumes that the image from two consecutive time instances will have the same intensity values shifted by a pose constant. The approach tracks pixels to estimate visual odometry. Since this approach assumes the pixel intensity to be its feature descriptor, feature matching will be inefficient as the intensity values change over time with varying pose.
Pomerleau and Magnenat [25] published another approach named point matcher. Though the process is modular and efficient for real-time videos, the approach lacks reliability as many of the error minimizers and parameters are hard coded. This approach is similar to approaches described above, in terms of feature registration and tracking. The visual odometry estimation process involves a lot of hard coded functions for selecting inliers and outliers. These hardcoded regions from where the features are selected are kept constant throughout the process and works well for select databases. Such restrictions cannot be applied to real-time visual odometry estimation process as the environmental conditions vary and the approach mush be adaptive to the environment. For real-time visual odometry, methods should be independent, reliable and robust.
Chapter 3
: Datasets
[image:17.595.201.429.455.659.2]The process of estimating egomotion in this thesis uses stereo images captured from a stereo camera setup. The setup has to meet the stereo camera setup requirements. The datasets used for this research are the KITTI datatset and the New Collage dataset.
Figure 3-1 Sequence path traced in KITTI dataset [47].
The KITTI dataset was formed by students from Karlsruhe Institute of technology in collaboration with Toyota Technological Institute, Chicago. The dataset was acquired with in the streets of Karlsruhe, in a modified car as shown in the image below. The dataset consists of stereo along with Velodyne laser data of up to 165GB. The dataset also consists of precise geographical locations of every image being captured. The modified car is equipped with two stereo cameras each for color and gray scale images with matched intrinsic and extrinsic parameters in a lossless PNG format.
Figure 3-2 Setup used for data collection in KITTI dataset [47].
algorithm. 11 paths (11-21) do not have ground truth and are used for testing.
[image:18.595.148.483.215.468.2]The New College Vision and Laser Dataset from Oxford contain 30Gb of data that is aimed at researchers working on outdoor 6 D.O.F navigation and mapping. The ground truth data is constructed using information from Global Positioning System (GPS) and Inertial Measuring Unit (IMU). The robot used for capturing the stereo and laser data along with the path traversed in shown in Figure 3.3.
Figure 3-3 Path traced by the robot in New college dataset [46].
[image:18.595.191.441.505.731.2]Chapter 4
: Methodology
[image:19.595.90.555.289.683.2]We assume the stereo camera rig consists of two identical cameras, and that the images from these cameras are calibrated to an epipolar plane. The input is a sequence of gray scale frames, taken over fixed intervals of time. Left and right frames, captured at time t and t+1 is referred as 𝐿𝑡,𝐿(𝑡+1),𝑅𝑡 and 𝑅(𝑡+1). These frames are the input to the algorithm and the motion trajectory between the t and t+1 frame is expected as the output. Each and every feature is weighted for its contribution of information to infer this result, so that when the same feature is tracked to future frames, its correctness can be validated by their previous predictions.
4.1. Proposed Algorithm
The stereo image sets are rectified to satisfy epipolar geometry and the images are converted to gray scale for faster processing. Since the feature detection is only intensity level based, gray scale images provide sufficient information.
1. If the stereo image set is the first in its sequence, then the image is only used to generate a 3D feature set as shown in figure 4.1. Initial Feature generation stage is also performed if the tracking information is lost. In this stage,
a. The image is first divided into segments by windowing the image.
b. Each window will have an initial Fast Threshold value, which will be adaptively updated based on the number of features generated in that window. Using the Adaptive Fast Threshold value, generate fast features in each window separately as described in section 4.4.
c. Match these features from left image to the right image in the Image stereo set to get feature correspondence and to generate the feature depth using (4.1) and (4.4) also described in section 4.6. Their location is made precise by using sub pixel interpolation. With the features location and depth, it becomes a three-dimensional feature.
𝑑𝑖𝑠𝑝𝑎𝑟𝑖𝑡𝑦= 𝑋𝑙𝑒𝑓𝑡− 𝑋𝑟𝑖𝑔ℎ𝑡 (4.1)
𝑋𝑟𝑒𝑎𝑙𝑤𝑜𝑟𝑙𝑑 = 𝑑𝑖𝑠𝑝𝑎𝑟𝑖𝑡𝑦𝑥−𝑐𝑥 ∗ 𝑇 (4.2)
𝑌𝑟𝑒𝑎𝑙𝑤𝑜𝑟𝑙𝑑 = 𝑑𝑖𝑠𝑝𝑎𝑟𝑖𝑡𝑦𝑦−𝑐𝑦 ∗ 𝑇 (4.3)
𝑍= 𝑓𝑝∗ 𝑑𝑖𝑠𝑝𝑎𝑟𝑖𝑡𝑦𝑇 (4.4)
Where: 𝑑𝑖𝑠𝑝𝑎𝑟𝑖𝑡𝑦 = 𝑑𝑒𝑝𝑡ℎ𝑜𝑓𝑡ℎ𝑒𝑓𝑒𝑎𝑡𝑢𝑟𝑒𝑠𝑖𝑛𝑍𝑑𝑖𝑟𝑒𝑐𝑡𝑖𝑜𝑛.
𝐶𝑥= 𝑋𝑎𝑥𝑖𝑠𝑣𝑎𝑟𝑖𝑎𝑡𝑖𝑜𝑛𝑜𝑓𝑡ℎ𝑒𝑖𝑚𝑎𝑔𝑒𝑝𝑙𝑎𝑛𝑒
𝐶𝑦 =𝑌𝑎𝑥𝑖𝑠𝑣𝑎𝑟𝑖𝑎𝑡𝑖𝑜𝑛𝑜𝑓𝑡ℎ𝑒𝑖𝑚𝑎𝑔𝑒𝑝𝑙𝑎𝑛𝑒
𝑓= 𝑓𝑜𝑐𝑎𝑙𝑙𝑒𝑛𝑔𝑡ℎ𝑜𝑓𝑏𝑜𝑡ℎ𝑡ℎ𝑒𝑐𝑎𝑚𝑒𝑟𝑎𝑠
𝑇= 𝑑𝑖𝑠𝑡𝑎𝑛𝑐𝑒𝑏𝑒𝑡𝑤𝑒𝑒𝑛𝑡𝑒ℎ𝑐𝑎𝑚𝑒𝑟𝑎𝑠
2. If the stereo image set is not the first in its sequence then,
a. The three dimensional features from the previous image set are tracked to the current stereo sets, left image using KLT optical flow described in section 4.5.
b. Follow step 1c to find feature correspondence between the left and the right images of the stereo image sets. Only features that are tracked from the previous results to the current frame are considered.
3. By now we should have two sets of three dimensional features corresponding to two consecutive frames. Now the problem is much more simplified in way to find the orientation and translational changes between the three-dimensional feature set. At first we divide the three dimensional features into subsets and perform RANSAC using Horn’s Method to find out the weighted closed form solutions for absolute orientation. The band of results is considered to find the median pose.
4. After the Motion estimation step using Horn’s method, the features are weighted based on their contribution towards the final result.
4.2.
Lens Distorsion:
Cameras capture visual information where the amount of visual information that can be captured is limited by the aperture size of the camera. Increasing the aperture size overexposes the scene and hence is not optimal to capture more information. Wide angle lenses in conjunction with large aperture sizes are widely used these days. With the help of these lenses, the same camera with exactly the same aperture size can capture more information by wrapping the visual information into a sphere.
Though these wide angle lenses help in capturing more visual information, the transformation the visual information goes through is a nonlinear transformation. This nonlinear transformation, provides more visual information, but increases the complexity for visual odometry estimation as it destroys the epipolar geometry of the cameras. Undistorting the image will provide more visual information and also bring the images back to epipolar geometry and hence is a balanced solution generally followed today. A modified version of Brown’s model for undistortion is used. This model uses barrel distortion approach to undistort the images using the distortion center of the image sets 𝑋𝑐. The distortion function is formulated in (4.5).
𝑋𝑈 = 𝑋𝐷+ 𝐿(𝑟)∙(𝑋𝐷− 𝑋𝐶) (4.5)
𝐿(𝑟) = 𝐾1𝑟2+𝐾2𝑟4… (4.6)
𝑟= �(𝑥𝐷−𝑥𝐶)2+ (𝑦𝐷− 𝑦𝐶)2 (4.7)
where : 𝑋𝐷(𝑥𝐷,𝑦𝐷) = Distorted image points
𝑋𝐶(𝑥𝐶,𝑦𝐶) = Image’s distortion center
𝑋𝑈(𝑥𝑈,𝑦𝑈) = Undistorted image points
Figure 4-2 Checkerboard pattern before and after removing lense distortion.
1. Offline stage:
a. Modelling and estimation of distortion parameters using equation 4.5 and checker board image sets (make use of the stereo properties to correct the checker board pattern [Figure 4.2] to have straight lines). b. As the distortion function is nonlinear, the unwrapping of pixels into
the new location in the image has to be done manually (calculating the new pixel location). Hence a look-up table for the new pixel location is calculated to reduce the computation load and execution time in real-time.
2. Online stage:
4.3.
Rectification/ Calibration
:
[image:24.595.100.500.168.416.2]The stereo camera consists of two cameras mounted rigidly with a known baseline distance between them. These cameras may not be perfectly aligned to each other. This alignment is very necessary as the epipolar geometry that results from the camera alignment simplifies stereo matching and other complex processes.
Figure 4-3 Stereo camera setup.
Aligning cameras perfectly using fixtures or hardware mounts is more complex than performing software optimizations. One commonly used alternative is to correct one frame from either of the cameras so that images would depict perfect alignment of the cameras. The process of calculating the alignment parameters is called calibration and then correcting the images based on the calibration parameters is called rectification.
Figure 4-4 Stereo camera pose rectification.
After the transformation is made, the feature correspondence from the left to the right image is usually only in the x axis with an error of ± 1 pixels. A feature match after the rectification process is shown in Figure 4.5. The calibration process to identify the
H2 projection matrix to bring both the images into the same plane is a complex problem, and uses the pattern in the checker board image. For calibration, the checker board pattern is matched between the stereo image sets, to find out the projection matrix by minimizing the distortion caused due to the separation of cameras in the stereo camera rig.
Let H be a projection transform that transforms the image to lie on the epipole
[image:25.595.99.500.69.278.2]e. Then the transformation 𝐻2for the second camera might be chosen so as to minimize the sum of squared distances∑ 𝑑𝑖 (𝐻2𝑥𝑖,𝐻𝑥𝑖′)2.
The procedure to find the transformation matrix 𝐻2 to transform the images to an epipole is summarized below.
1. Find the correspondence features from left to the right images in the checker board pattern. This step searches for correspondence in two dimensions.
2. Compute the transformation matrix for these correspondence feature sets.
3. Computer the transformation matrix 𝐻2 that maps the feature to the epipole e.
4. Iterate through all the features to get matrix 𝐻2, to minimize the distortion due to the transformation.
5. Transform the first image to the H plane using matrix 𝐻2 and the second image to H plane using matrix 𝐻2.
[image:26.595.171.465.426.666.2]This procedure is performed more than once by changing the orientation of the checkerboard to so that an optimal transformation matrix is obtained as shown in Figure 4.6.
4.4. Feature Detection
[image:27.595.96.557.379.635.2]Rosten and Drummond [27] proposed an intensity based interest point detection algorithm for images called Features from Accelerated Segment Test (FAST). Features in an image are interest points which characterizes an image and can be uniquely identified. Features are rich in local information and hence this information should be traceable in consecutive frames. Hence features are widely used in applications like image matching, object recognition, tracking etc. As discussed earlier, feature detection was first conceptualized by the early computer vision research on Moravec corners. Harris corner [49] and SUSAN corner detectors are few amongst the early interest point detection algorithms. Though these algorithms were very successful in detecting key interest points, they are time consuming and were not optimal solutions for real-time applications. Thus FAST was introduced which was robust, intensity based, and less time consuming.
The FAST algorithm is explained below:
1. Consider a pixel p, at any given location x,y in the image plane with intensity
IP. Pixel p is to be identified as an interest point or not. (Refer to Figure 4.7) 2. Assume a threshold intensity value (generally 20% of IP) to be T.
3. Consider all the neighboring 16 pixels that lie in a circular fashion around pixel p (Bresenham circle [4] of radius 3).
4. For pixel p to be considered as an interest point, N neighboring pixels need to be either above IP+T or below IP-T (in [27] N =12) of the 16.
5. To speed up the process, first priority is given to pixels I1, I5, I9 and I13 of the circle. They are compared with IP. If at least three out of four pixels satisfy the condition, only then the procedure is continued for the other 16 pixels. Else the pixel p is rejected as a possible interest point.
6. Repeat the procedure for all the pixels in the image.
This algorithm will not work well if N<12, as in this case the number of possible interest points will increase drastically. Also the speed of the algorithm is determined by the orientation in which the 16 pixels are queried
To make the algorithm faster, a machine learning approach was proposed in [3] [5].
𝑆𝑝→𝑥 = �
𝑑, 𝐼𝑝→𝑥 ≤ 𝐼𝑝− 𝑇 (𝑑𝑎𝑟𝑘𝑒𝑟)
𝑠, 𝐼𝑝− 𝑇 <𝐼𝑝→𝑥 < 𝐼𝑝+𝑇 (𝑠𝑖𝑚𝑖𝑙𝑎𝑟)
𝑏, 𝐼𝑝+𝑇 ≤ 𝐼𝑝→𝑥 (𝑏𝑟𝑖𝑔ℎ𝑡𝑒𝑟)
(4.8)
where : 𝑆𝑝→𝑥 = is the state
𝐼𝑝→𝑥 = is the intensity of the pixel x
Figure 4-8 Pixel p and its neighboring pixels in a vector form [5].
The machine learning approach speeds up the process by training on asset of images. The process involves considering a set of pixels’ p and a vector of neighboring intensities P for every pixel p. Each neighboring pixel in the vector P can take one of the three states, i.e brighter, darker or same intensity as IP. By using this information as training data and the ground truth being the decision whether the pixel was a key point or not, a decision tree classifier (ID3 algorithm) is trained.
Another major drawback in early corner detection algorithms was that corners were detected close to each other and were coagulated near high intensity variations. This was later resolved by using a Non Maximal Suppression for removing adjacent corners [4]. This approach scored each corner with a score function V for each detected corner. The score function was the sum of absolute differences between the intensity IP and the intensities of the neighboring pixels in the arc. Corners adjacent to each other were scanned and the ones with lower V scores were discarded.
𝑉 =𝑚𝑎𝑥 �∑∑((𝑝𝑖𝑥𝑒𝑙𝑝 − 𝑝𝑖𝑥𝑒𝑙𝑣𝑎𝑙𝑢𝑒𝑠 − 𝑝𝑣𝑎𝑙𝑢𝑒𝑠) ) 𝑖𝑓𝑖𝑓 ( (𝑣𝑎𝑙𝑢𝑒 − 𝑝𝑝 − 𝑣𝑎𝑙𝑢𝑒) >) >𝑇𝑇
(4.9)
where 𝑝 = pixel of intrest (center pixel)
𝑇 = threshold used for detection
Figure 4-9 Fast features, green dots show the Non-maximally suppressed corners [5].
Fast feature detection with non-maximal suppression is robust and provided reliable features at lesser computation time as compared to Scale invariant feature transform (SIFT) [28] or Histogram of Oriented Gradients [29].Feature detectors operating on the entire image generates coughed features in the highlights than in shadows. This is due to the dynamic variance of the brightness in the image. For Visual Odometry, Interest points should be spread throughout the image to track the egomotion with respect to every corner in the image. This issue is clearly shown in image figure 4.11.
Figure 4-11 Image bucketing or windowing.
1. Divide the image into windows of equal sizes as shown in figure 4.12. 2. Treat each window in an image as separate image.
3. Using FAST feature with non-maximal suppression generate interest points. 4. If the number of features in a window decreases below a threshold t, increase
the Fast feature detector threshold T, else if the number of features in window is more than the threshold t, reduce the Fast feature detector threshold T. 5. Always check for the Fast detector threshold T to be within the limit (𝑇𝑚𝑎𝑥
and 𝑇𝑚𝑖𝑛).
[image:31.595.78.503.294.494.2]constant stream of robust features and feature count is nearly constant.
Figure 4-12 Features generated from ddaptive feature generation.
Figure 4-13 Graph showing no. of feature generted by using fixed FAST thresholding.
Figure 4-14 Graph showing no. of features generted by using adaptive FAST thresholding. 0 200 400 600 800 1000
0 500 1000 1500 2000 2500 3000
Number of detected features
Fixed threshold 0 5000 10000 15000 20000 25000 0
115 230 345 460 575 690 805 920
1035 1150 1265 1380 1495 1610 1725 1840 1955 2070 2185 2300 2415 2530 2645 2760 2875 2990
Number of detected Features
4.5. Feature Description and Matching
[image:33.595.93.507.214.488.2]Feature tracking provides key information about the motion of features between time intervals. This information after rejecting outliers is what is used to estimate visual odometry. The traceability of a feature over multiple frames provides an overall picture of how the background is moving with respect to the object as shown in Figure 4.16.
Figure 4-15 Feature tracking.
These features have x,y and z information in them and hence are 3D points.
For the approach proposed in this thesis, Kanade–Lucas–Tomasi feature tracker (KLT tracker) [30] was used to track features from frame t-1 to t. Feature tracking is also referred to as optical flow, and makes some assumptions which are summarized below.
• The intensity invariance. “Image intensities in small regions will remain the same although their location may change”. This can be expressed in (4.10), where I is the pixel intensity at x,y,z position.
• The spatial coherence. “Neighboring pixels belongs to same surface and hence have similar motions”.
• The temporal persistence: “Image motion of a surface patch change gradually over time”.
Smaller movements can be liberalized using the Taylor series as shown in (4.11).
I(x +δx, y +δy, t +δt) = I(x, y, t) +𝜕x𝜕I𝜕x +𝜕y𝜕I𝜕y +𝜕I𝜕t𝜕t + H. O. T. (4.11)
Where: I(x +δx, y +δy, t +δt) = Intensities of the new image.
I(x, y, t) = Intensities of the previous images.
The higher order terms in (4.11) can be neglected when we consider the intensity invariance and the temporal persistence assumption and see that the pixel intensities remain the same with variation in the pixel location (The differential location term). With all the assumptions, (4.11) reduces to (4.12).
∂I ∂x ∂x ∂t+ ∂I ∂y ∂y ∂t+ ∂I
∂t= 0 with optical flow d = �
∂x ∂t,
∂y
∂t� (4.12)
𝐸(𝛿𝑥,𝛿𝑦) =∑ ∑𝑢𝑦+𝑤𝑦 �𝐼(𝑥,𝑦)− 𝐼�𝑥+𝛿𝑥,𝑦+𝛿𝑦, 𝑡+𝛿𝑡��2
𝑦=𝑢𝑦−𝑤𝑦
𝑢𝑥+𝑤𝑥
𝑥=𝑢𝑥−𝑤𝑥 (4.13)
The KLT tracker uses (4.13) to estimate the optical flow vector. Optical flow only tracks features. So, at some point in time, features are lost, because they move out of the window. To keep a constant number of features in the image, the feature list needs to be updated from time to time. Also features are lost due to intensity variations when the camera gets over exposed or underexposed as the intensity of the features change. In the approach proposed in this thesis, only features with good FAST scores are tracked. Further, once features with good FAST scores are lost, we search for the same feature in the next five frames before it is dropped. The idea is that like the human eye, the camera’s auto exposure needs some time adapt to the changes in the light coming in.
After all the optimization, the features that are tracked are shown below in Figure 4.18. The green dots indicate where the features were located in the previous frame and the end of the arrow is where the features are in the current frame.
4.6. Depth Computation
Given a pair of images from a stereo camera, the disparity map is the measure of motion at pixel level with respect to change in perspective of the camera. The motion of the pixels is relative to its depth in world coordinates, and hence features near the camera have large movement, while features far from the camera have little or no motion. This characteristic property of interest points is exploited to measure the depth in real world co-ordinate system. Depth information provides that extra dimensionality to the data for visual odometry and is the key distinguishing factor between monocular and stereo visual odometry. In cases where ratio of baseline distance to the distance from the scene is low, the same extra dimensionality will not add any information, as the motion of these pixels is too small to be registered.
[image:36.595.94.520.301.434.2]Figure 4.19 shows a conceptual view of the right and the left images of a stereo camera overlapped and its calculated disparity. This is a dense disparity map as the depth measurement is done to the whole frame. Dense disparity- depth measurements are suited for applications that rely on blocks of neighboring pixels for gathering information, like detecting moving objects in a scene in 3D. Dense disparity – depth measurements have been used for visual odometry estimation, by considering motion of blocks in the disparity. These approaches would produce good results in static scenes where the background has no other moving objects. For our approach we relied on sparse disparity – depth measurement for motion estimation, as the motion estimation information can be gathered in bits and pieces from selective features throughout the image. Sparse disparity-depth calculation is also less time consuming as the process of disparity and depth measurement is only done on selective features pixel location and not on the complete frame.
This concept can be used to compute the depth of the frame being captured. A feature in the real world coordinate system bearing X1 coordinates along X axis in the left image and the same feature if found in the right image at X2 location, the Z distance can be computed using (4.14). The Y values remains constant due to epipolar geometry.
Disparity is only computed for sparse features considered for motion estimation, as the approach is execution time critical. The spatial disparity map only computes the disparity of the interest points. For this process a four stage Difference of Gradient (DOG) pyramid [40] the stereo pair is used. Each interest point traverses through the pyramid in a top-down approach to refine the location of the intrest point using Sum-of-Absolute-Differences (SAD) and Normalised Cross Corellation (NCC). Later using normalized cross correlation, the local variation of +/- 1-3 horizontal rows is computed. Later the pixel location is refined by using sinusoidal sub pixel Figure 4-18 A disparity map computed on frames from KITTI VO dataset [50].
interpolation. The same location is traversed to lower layers of the pyramid to make a more precise measure of the location of the pixel in the right image.
[image:38.595.177.411.235.439.2]The difference in the horizontal location gives the disparity value of the particular interest point. This disparity value, when combined with the camera base line distance and its focal length, results in actual depth, providing each interest point with a 3rd dimension, z.
Figure 4-21 Feature matching from left to right pyramid.
Figure 4.23 shows the region that’s being covered during the search for the correspondence feature. Assuming that the image is of size 20×20, then their corresponding pyramid sizes will be 10×10, 5×5 and 3×3 respectively. Let’s assume that there is a feature in (10,10), of the left image, then in the top of its pyramid the feature will be in (1.25,1.25). Assuming that the feature shows very less variance in its location at the top level of the pyramid, the feature is first assumed to be in the exact same location in the top level of the right pyramid. Due to epipolar geometry, the feature would lie on the same row, but would vary along the column index. Searching for three pixels around the known location would actually be a full image search as the three columns of the same row depicts a compressed version of the whole image. If the image size increases to 100×100, then the ±3-pixel search on the top would result in 56-pixel search, which is half the image. The blue region in the image shows a projection of the search area from its upper pyramid levels. The black window shows the current search window.
F
eat
u
re m
at
ch
in
g
s
co
res
Pixel location along x axis
and will be able to search feature matching pair with half the image size variance while the brute force operation count keeps increasing. Hence the computation time for finding the feature correspondence, is much smaller and the efficiency is much higher. This efficiency can be further enhanced by using sub-pixel interpolation.
Figure 4-22 Sinusoidal Sub pixel interpolation.
Assuming that the cameras are calibrated and the images from those cameras are rectified; defining the disparity at an exact pixel location is characterized by the motion of these pixels for the change in perspective. In Figure 4.23 P1 and P2 are two interest points in a scene. If P1 is closer to the stereo camera setup than P2, then the motion of these points in the stereo image set will be inversely proportional to their real world distance. The farthest points will show smaller distance and the closer points show huge distance.
To find out the mathematical relation between the motion of the pixel to the real world depth at every feature, let’s assume a stereo camera setup as shown in Figure 4.24.
Figure 4-24 Geometrical representaion of sterero camera setup.
As clearly indicated in the image 𝑥𝐿 and 𝑥𝑅 are the horizontal distances of the interest point. It can be seen that two congruent triangles are formed, and that the ratio of their side will be equal.
Figure 4-25 Triangular congruency in the stereo camera setup.
Hence
𝑏 𝑍=
(𝑏+𝑥𝑅)−𝑥𝐿
𝑍−𝑓 ⟹ 𝑑= 𝑥𝐿− 𝑥𝑅 = 𝑓∙𝑏
𝑍
(4.14)
Z = real world depth
(𝑥𝐿 − 𝑥𝑅) = disparity of the interest point
f = focal length of the cameras
𝑥𝐿,𝑥𝑅 = x distance of the features from the origin of the image
plane
4.7. Pose Estimation
By now we have two sets of 3D features, one set from the present and one set from the previous frame. Finding out the incremental change in pose of the tracked feature set from the previous frame to the current frame is the next task. The change in pose from frame t-1 to frame t can be formulated as shown in (4.15).
𝑃𝑁𝑒𝑤 = 𝑆 ∙ 𝑅 ∙ 𝑃𝑂𝑙𝑑+𝑇
(4.15)
Where 𝑃𝑁𝑒𝑤 = Pose of the current frame
𝑃𝑂𝑙𝑑 = Pose of the old frame
S = Scale
R = rotation
T = translation
Equation (4.15) shows that the new pose is a function of translation, rotation and scaling parameters, each of which need to be estimated. Horn’s method for absolute orientation [1] will be used to estimate these parameters using the point cloud information from the current previous frames. Horn’s method uses weighted least squares and quaternions to find a closed solution of absolute orientation. There are seven unknowns in this problem: scaling(S), x-axis translation (𝑇𝑥), y-axis translation (𝑇𝑦), z-axis translation (𝑇𝑧), x-axis rotation (𝑅𝑥), y-axis rotation (𝑅𝑦) and z-axis rotation (𝑅𝑧). Rotation along each axis can also be called yaw, pitch and roll. To solve for the seven unknowns, we need at least three 3D points. For example, if we used three points, we have nine values to solve for our seven unknowns. More 3D features reduce error and increases accuracy.
The general approach for solving the scaling, rotation and translation values is summarized below.
1. Compute the mean of the point cloud pc1 and pc2 each for the current frame and the previous frame.
2. Compute the mean center for both pc1 and pc2. 3. Compute the co-variance matrix for both pc1 and pc2.
4. Apply singular value decomposition to the covariance matrix. 5. Calculate the rotation matrix using the SVD parameters.
In our approach, we use a RANSAC based method to find out the mean pose for all the point cloud features. We divide the point cloud into subsets and calculate the pose matrix for each subset. The median pose matrix from various feature subsets is chosen. This step avoids any sudden motion until and unless the majority of features induce motion. This approach helps in rejecting outliers. Each feature subset will then then receive a weight for their contribution to the mean pose value as shown in (4.16).
𝑤𝑖 = � 1
‖𝑐𝑖‖, 𝑖𝑓‖𝑐𝑖‖<𝑟 𝑐𝑖 = 𝑃�𝑝𝑟𝑒𝑑𝑖𝑐𝑡𝑒𝑑,𝑖 − 𝑝𝑁𝑒𝑤,𝑖
0 , 𝑜𝑡ℎ𝑒𝑟𝑤𝑖𝑠𝑒 (4.16)
where:
𝑝̂𝑝𝑟𝑒𝑑𝑖𝑐𝑡𝑒𝑑,𝑖 = pose prediction from feature i for previous frame
𝑃𝑁𝑒𝑤,𝑖= pose prediction from the current frame by feature i
𝑐𝑖 = prediction error .
𝑤𝑖 = weighting factor for feature i
Each feature can be predicted for its new pose based on the pose matrix of the previous frame. The error in the actual pose and the predicted pose of each feature can be used to know the quality of information that the feature can contribute to the overall pose. Features on static backgrounds will have less error and contribute heavily towards the overall pose. If the error is small, the 3D point cloud pair is assumed to have good quality and the weight factor becomes higher. This means, that this point pair will have more influence in the egomotion estimation. The bigger the error, the smaller the weight and the smaller the influence of the 3D point cloud pair on the pose estimation process. If the error is too big, then we remove the point pair completely by setting its weight to 0.
Feature points with higher the information content indicate the feature lies on a static background and is within the traceable distance of the stereo camera. Such features are very important as they provide more information (more information in the context refers to the covariance of the features pose matrix to the overall pose matrix, more like K-nearest neighbors (KNN) [31] clustering of features). Features that provide less information, or that have a motion opposing the overall motion of the frame, can be considered to be outliers, as depicted in Figure 4.27.
Chapter 5
: Experiments
A variety of experiments very carried out for visual odometry estimation. These experiments are validated numerically by using ground truth provided from standard datasets and visually by implementing the algorithms to an autonomous golf cart. (The autonomous golf cart at RIT is a multi-year senior design project directed by Professor Raymond W Ptucha.) The experimentation investigates the ability of the proposed algorithms to tackle issues such as separating static and dynamic background for accurate visual odometry estimation, removing outlier feature points from moving objects in the scene, and reducing error accumulation over time without the use of loop closure, additional sensors or localization techniques.
The first set of experimentation aimed at solving issues related to obtaining a constant stream of features that could be processed. Use of adaptive feature detection along with windowing allowed the algorithm to get a constant stream of uncoagulated information in the form of features. These features were spread across the images. Figures 4.14 and 4.15 show that the proposed algorithm produced a constant number of reliable and robust features from most of the images and that these features were sparse.
Figure 4.14 shows the feature count varying drastically over consecutive frames and depicts variable flow of information to be processed for visual odometry estimation. Figure 4.15 shows that the information flow is constant for almost all the frames. This experiment was done on 28000 frames. The time for execution of each step in the process is tabulated for all the frames of KITTI dataset, to provide an analyses of the how fast is the process in Table 5-1.
The second set of experiments was done to see to increase the stereo matches and to get their accurate location by using sub pixel interpolation to find the location of matched feature pairs. The pixel location of FAST features was kept to whole numbers and then the number of features that were matched between left and right frames during depth measurement and between t and t-1 frames via optical flow was kept track of.
Table 5-1 Subpixel regression Statistics.
Regression Statistics
Integer disparity Sub-pixel disparity
Multiple R 0.992927627 0.998857408
R Square 0.985905273 0.997716121
Adjusted R Square 0.984898507 0.997552987
Standard Error 2.224600023 0.836599709
Observations 16 16
The sub pixel interpolation also helps in disparity accuracy. Figure 5.1 shows a distribution of depth measurements. The black line shows the actual depth, while the blue and the red spots mark the depth measurement made using sub-pixel and the integer pixel locations. The estimated depth should lie closer to the black line and the sub pixel location’s depth calculations lie closer to the black line as the depth increases. Table 5.1 shows the same compared using the regression statistics. These different approaches show a reduction in the depth measurement errors across increasing depths.
Table 5-2 Execution time for each step.
Max Nr. Features 1000 features 9600 features
Rectify Image 9.98 ms 9.98 ms
Image Pyramid 8.56 ms 8.56 ms
Optical flow 1.21 ms 6.86 ms
Disparity 2.12 ms 12.90 ms
Disparity to 3D 0.28 ms 1.32 ms
Horn’s method 0.60 ms 3.75 ms
Detect New features 1.91 ms 8.58 ms
Features weighs and motion
refinement 0.80 ms 5.66 ms
Min distance enforcement 0.09 ms 2.08 ms
Complete algorithm 25.91 ms 61.2263 ms
Average fps 38.59 fps 16.33 fps
This was because of the adaptive feature detector was capable enough to generate features for various contrast regions in the image. And during the over exposure/under exposure situations there were enough new features generated which could be tracked more efficiently than the traditional approach. Such optimizations to the algorithm have made it less time consuming and fast enough to be real-time compliant. The execution time for each stage in the proposed algorithm is shown in table 5.2. The Image corrections and creating the DOG pyramid is more time consuming, but the overall time for execution is around 25ms. Less execution helps us process more frames per second and hence increase the sensitivity of the algorithm to small motion changes (More frames can track motion more accurately).
processed. To minimize this error with visual information, the transformation matrix from previous m frames is used to estimate the current frames transformation matrix. This approach is depicted in Figure 5.2.
[image:49.595.122.499.151.438.2]Figure 5.1 Disprity results by using sub pixel location to intergral location.
Figure 5.2 Transformation matrix between m frames.
In Figure 5.2, m depicts the number of frames that are considered to possess some visual information that could optimize the current transformation matrix and give more accurate results. Here, Ti represents the transformation matrix between
frames. The error between the point cloud information and the transformed point cloud is to be minimized as per (5.1).
0 10 20 30 40 50 60 70
0 10 20 30 40 50 60
Est
im
at
ed
d
is
tan
ce
s in
m
Measured distance in m
∑ �𝐹𝑖− 𝑇𝑒𝑖𝑗𝐶𝑗�
2
𝑒𝑖𝑗 (5.1)
Figure 5.3 Vx,Vy and Vz result comparision for KITTI dataset. -1.5 -1 -0.5 0 0.5 1 1.5 2
0 50 100 150 200 250 300
m
/s
Frame
V
x Series2Vx -0.5 0 0.5 1 1.5 2
0 50 100 150 200 250 300
Frame
V
y Series2 Vy 0 1 2 3 4 50 50 100 150 200 250 300
Figure 5.4 Yaw, Pitch and Roll results comparision for KITTI dataset. -1.5 -1 -0.5 0 0.5 1 1.5
0 50 100 150 200 250 300
d
eg
ree/
s
Frame
Pitch rate
Series2Pitch -2 -1.5 -1 -0.5 0 0.5 1 1.5
0 50 100 150 200 250 300
Frame
Yaw rate
Series2Yaw -1 -0.5 0 0.5 1 1.5
0 50 100 150 200 250 300
Frame
Roll rate
Series2Roll True
True
The RMS error for the KITTI dataset based on the date when the data was captured can be seen in table 5-3.
Table 5-3 RMS Error for data based on date
RMS Error Vx Vy Vz Pitch Yaw Roll
2011-09-26 1.8190038
02 1.374765862 0.628549021 0.043933793 0.055646991 0.248387552
2011-09-28 0.0832047
98 0.034568495 0.043196555 0.001673344 0.003127362 0.001403155
2011-09-29 0.2090805
14 0.059380969 0.169566996 0.003253539 0.00775988 0.002787566
2011_09_30 0.3643520
81 0.73545988 0.222077774 0.00747232 0.010497656 0.006130403
2011_10_03 0.4101251
17 0.574803923 0.428756564 0.012539607 0.019349872 0.025116358
On close investigation, the results of data captured on 09/26/2011 have the highest error over data captured on other days. The least error is seen on 09/28/2011. These effects are because of the data length. Motion estimation gets better over consecutive frames and more the number of consecutive frames, the error in incremental motion estimation reduces. This error is not the same as the error accumulation of the overall trajectory rather is the error in the motion estimation between frames. As 09/28/2011 has more images per session, than having more sessions itself as in the case of 09/26/2011, the RMS error reduces over time. The RMS error for the same dataset segmented based on the content is tabulated in table 5-4.
Table 5-4 RMS Error for data based on content.
RMS Error Vx Vy Vz Pitch Yaw Roll
City 1.502489948 1.25750709 0.37928101 0.010902831 0.014910277 0.007565111
Residential 1.096476491 0.946146191 0.464352015 0.032525413 0.041257366 0.183368332
Highway 0.628319795 0.551897685 0.526633115 0.015644485 0.02508115 0.035588564
Campus 0.09860991 0.028252349 0.058620277 0.00186406 0.004048608 0.001901811
Person 0.011367087 0.023763893 0.014772203 0.000469363 0.00080434 0.000363688
The results for the KITTI data set for various sequences having city and highway images are shown in Table 5-5. One key observation to be made is that on the highway image sequences, the velocity information is less accurately estimated because of the high velocity and a greater distance travelled by the car between frames. In the case of city dataset, the results are better for velocity as the translational motion is small and is sufficiently recorded in the smaller frame rate. In the city image sequence, the outliers are high when compared to the highway image sequence, but still manage to produce good results because of the outlier rejection.
For the oxford dataset
Table 5-5 Translational and rotational result for all the sequences of KITTI dataset.
[image:54.595.120.464.310.534.2]Figure 5.5 Vx,Vy and Vz results for New college Dataset. -1.5 -1 -0.5 0 0.5 1
150 170 190 210 230 250 270 290
m/
s
Frame
Vx
Vx True
-0.25 -0.15 -0.05 0.05 0.15 0.25
150 170 190 210 230 250 270 290
m/
s
Frame
Vy
Vy True
0 2 4 6 8 10 12
150 170 190 210 230 250 270 290
m/
s
Frame
Vz
VzFigure 5.6 Yaw, Pitch and Roll results for New College dataset. -0.07 -0.05 -0.03 -0.01 0.01 0.03 0.05 0.07 0.09
150 170 190 210 230 250 270 290
degr
ee/
s
Frame
Pitch rate
TruePitch -0.1 0 0.1 0.2 0.3 0.4 0.5
150 170 190 210 230 250 270 290
degr
ee/
s
Frame
Yaw rate
TrueYaw -0.05 -0.03 -0.01 0.01 0.03 0.05
150 170 190 210 230 250 270 290
degr
ee/
s
Frame
Roll rate
TrueTable 5-6 New college dataset results fro translation and rotation. New College Dataset
Motion Accuracy
Vx 32.29%
Vy 89.03%
Vz 86.52%
Pitch 80.27%
Yaw 87.32%
Roll 83.10%
A comparison of our results with the best approaches is shown in the Table 5.7.
Table 5-7 Result comparision with state of the art approaches. Method Approach Execution
time (ms) Results ORB SLAM [32]
(2015) Tracking 74 72.33%
ORB SLAM 2 [32] [33] (2016)
Tracking + loop closure detection + global relocalization
100 98.85%
SOFT [26] (2016)
Tracking + loop closure detection
+ IMU integration
100 98.97%
ROOC [35] (2016) Tracking 21 78.56%
[image:57.595.90.507.412.689.2]Chapter 6
: Conclusion
In the past year alone, six publications have been published describing the importance of features in visual odometry estimation. It’s also evident that motion tracking using block of regions or pixels would result is efficient detection and rejection of outliers but would also suffer from issues such as less information content (less feature count). Such approaches must use either inertial sensors or post processing techniques to obtain enough data to estimate accurate motion. Alternatively, the use of a sparse set of features is always prone to outliers and will eventually accumulate error over consecutive motion estimation processes.
A perfect balance between both approaches is proposed in this thesis. Efficient outlier rejection is achieved by feature profiling and feedback motion correction. An adaptive feature generation and windowing approach helps in generating sufficient features over time. The use of sub pixel interpolation helps the process of tracking and hence provides more accurate motion tracking.
Bibliography
1. Horn, P. K. B., "Closed-Form Solution of Absolute Orientation Using Unit Quaternion,'' JOSA A, V4, N4, 1987.
2. C.Forster, M. Pizzoli, and D. Scaramuzza. SVO: Fast semi-direct monocular visual odometry. In ICRA, 2014.
3. H. Longuet-Higgins, “A computer algorithm for reconstructing a scene from two projections,” Nature, vol. 293, no. 10, pp. 133–135, 1981.
4. C. Harris and J. Pike, “3d positional integration from image sequences,” in Proc. Alvey Vision Conf., 1988, pp. 87–90.
5. J.-M. Frahm, P. Georgel, D. Gallup, T. Johnson, R. Raguram, C. Wu,Y.-H. Jen, E. Dunn, B. Clipp, S. Lazebnik, and M. Pollefeys, “Building Rome on a cloudless day,” in Proc. European Conf. Computer Vision, 2010, pp. 368–381.
6. B. Triggs; P. McLauchlan; R. Hartley; A. Fitzgibbon (1999). "Bundle Adjustment — A Modern Synthesis". ICCV '99: Proceedings of the International Workshop
on Vision Algorithms. Springer-Verlag. pp. 298–372.
7. L. Matthies and S. Shafer, “Error modeling in stereo navigation,” IEEEJ. Robot. Automat., vol. 3, no. 3, pp. 239–248, 1987.
8. H. Moravec, “Towards automatic visual obstacle avoidance,” in Proc. 5th Int. Joint Conf. Artificial Intelligence, Aug. 1977, p. 584.
9. W. Forstner, “A feature based correspondence algorithm for image matching,” Int. Arch. Photogrammetry, vol. 26, no. 3, pp. 150–166, 1986.
10.L. Matthies, “Dynamic stereo vision,” Ph.D. dissertation, Carnegie Mellon Univ., Pittsburgh, PA, 1989.
11.S. Lacroix, A. Mallet, R. Chatila, and L. Gallo, “Rover self-localization in planetary-like environments,” in Proc. Int. Symp. Articial Intelligence, Robotics, and Automation for Space (i-SAIRAS), 1999, pp. 433–440.
12.M. Hannah, “Computer matching of areas in stereo images,” Ph.D. dissertation, Stanford Univ., Stanford, CA, 1974.
13.A. Milella and R. Siegwart, “Stereo-based ego-motion estimation using pixel tracking and iterative closest point,” in Proc. IEEE Int. Conf. Vision Systems, pp. 21–24, 2006.
Pattern Recognition, 2000, pp. 453–458.
15.A. Howard, “Real-time stereo visual odometry for autonomous ground vehicles,” in Proc. IEEE/RSJ Int. Conf. Intelligent Robots and Systems, 2008, pp. 3946– 3952.
16.Y. Cheng, M. W. Maimone, and L. Matthies, “Visual odometry on the mars exploration rovers,” IEEE Robot. Automat. Mag., vol. 13, no. 2, pp. 54–62, 2006. 17.M. Maimone, Y. Cheng, and L. Matthies, “Two years of visual odome
![Figure 3-1 Sequence path traced in KITTI dataset [47].](https://thumb-us.123doks.com/thumbv2/123dok_us/40342.3274/17.595.201.429.455.659/figure-sequence-path-traced-kitti-dataset.webp)
![Figure 3-3 Path traced by the robot in New college dataset [46].](https://thumb-us.123doks.com/thumbv2/123dok_us/40342.3274/18.595.191.441.505.731/figure-path-traced-robot-new-college-dataset.webp)

![Figure 4-9 Fast features, green dots show the Non-maximally suppressed corners [5].](https://thumb-us.123doks.com/thumbv2/123dok_us/40342.3274/30.595.90.520.70.439/figure-fast-features-green-dots-maximally-suppressed-corners.webp)