EVALUATION OF EFFECT OF THREE DIFFERENT
SOLUTIONS ON MECHANICAL PROPERTIES OF HEAT
CURED AND MICRO WAVE CURED DENTURE BASE
RESIN-IN VITRO STUDY
A Dissertation Submitted to the
Tamil Nadu Dr. M.G.R. Medical University
In partial fulfillment of the requirement for the degree of
MASTER OF DENTAL SURGERY
(BRANCHI)
(PROSTHODONTICS AND CROWN & BRIDGE)
CERTIFICATE
This is to certify that this dissertation titled “EVALUATION OF EFFECT OF
THREE DIFFERENT SOLUTIONS ON MECHANICAL PROPERTIES OF HEAT CUREDAND MICRO WAVE CURED DENTURE BASE RESIN-IN VITRO STUDY” a bonafide record of work done by Dr.P.Mohankumarunder my guidance during his postgraduate period 2010-2013. This dissertation is submitted to
Tamilnadu Dr. MGR Medical University, Chennai in partial fulfillment, for the degree of Master of Dental Surgery in Prosthodontics and Crown and Bridge (Branch-1).
It has not been submitted (partial or full) for the award of any other degree or
diploma. Guided By
Dr. C. Thulasingam, M.D.S.
Professor and Head of the Department
Department of Prosthodontics
Tamilnadu Government Dental College
& Hospital, Chennai- 600003
Head of institute
Prof. Dr K.S.G.A. NASSER, M.D.S.
ACKNOWLEDGEMENT
I consider it my utmost privilege and honour to express my most sincere and heartful
gratitude to my chief Dr.C.THULASINGAM, M. D. S., Professor and Head,
Department of Prosthodontics, Tamilnadu Government Dental College and Hospital for
his wholehearted support, filial attitude, encouragement and never ending patience
without which this study would not have been possible and also for constant inspiration
throughout the period of my post graduate course.
I take this opportunity to convey my everlasting thanks and sincere gratitude to
Dr. K.S.G.A. NASSER, M. D. S., Principal, Tamilnadu Government Dental College and Hospital, Chennai for permitting me to utilize the available facilities in this institution.
I would like to express my most sincere thanks and I am extremely grateful to
ProffessorsDr.C.SABARIGIRINATHAN M.D.S., and Dr.A.MEENAKSHI M.D.S., Department of Prosthodontics, Tamilnadu Government Dental College and Hospital, for
all the invaluable suggestions, motivations, guidance, help and support they provided
throughout my post graduation.
I am thankful to my Assistant Professors, DR.P. RUPKUMAR M.D.S.,
Dr.T.JEYANTHIKUMARI M.D.S, Dr. G. SRIRAMPRABHU M.D.S., Dr. S.VINAYAGAM M.D.S.,Dr.G.GOMATHI M.D.S., Dr.K.RAMKUMAR M.D.S., Dr. M.KANMANI M.D.S., and Dr.V.HARISHNATH M.D.S., for their suggestions, encouragement and guidance throughout this study.
I thank, Mr.SARAVANAN CIPET, Guindy, Chennai-32 for their technical
I offer my sincere thanks to specially thank my Bio statistician,
Dr.R.RAVANAN, Associate professor, Department of Statistics, Presidency College, Chennai for helping me with the statistical analyses for this study.
I owe my sincere thanks to all my senior postgraduates and junior postgraduate
students in the department for their constant encouragement and timely help.
I specially thank to my Assistant professors Dr. G. SRIRAMPRABHU M.D.S.,
and DR.P. RUPKUMAR M.D.S., for their valuable advice, guidance, help and support
to complete this study.
My special thanks to my parents, and my wife for their moral support, motivation, and
encouragement.
Last but not the least; I would like to seek the blessings of the ALMIGHTY
without whose grace this endeavour would not have been possible.
DECLARATION
I, Dr.P.Mohankumar, do hearby declare that the dissertation “EVALUATION
OF EFFECT OF THREE DIFFERENT SOLUTIONS ON MECHANICAL PROPERTIES OF HEAT CUREDAND MICRO WAVE CURED DENTURE BASE RESIN-IN VITRO STUDY” was done in the Department of Prosthodontics, Tamilnadu Government Dental College & Hospital, Chennai- 600003. I have utilized the
facilities provided in the Government Dental College for this study in partialfulfillment of
the requirements for the degree of Master of Dental Surgery in Prosthodontics and Crown
and Bridge (Branch -1) during the course period 2010-2013 under the conceptualization
and guidance of my dissertation guide Dr. C. Thulasingam, M.D.S.
I declare that no part of the dissertation will be utilized for gaining financial
assistance for research or other promotions without obtaining prior permission from
theTamilnadu Government Dental College & Hospital, Chennai- 600003
I also declare, that no part of this work will be published either in the print or
electronic media except with those who have been actively involved in this dissertation
work, and I firmly affirm that the right to preserve or publish this work rests solely with
the permission of the Principal, Tamilnadu Government Dental College & Hospital,
Chennai- 600003, but with the vested right that I shall be cited as the author(s).
Signature of the PG Student
Signature of the HOD
TRIPARTITE AGREEMENT
This agreement herein after the “Agreement” is entered into on this day 25th Dec 2011 between the Tamilnadu Government College and Hospital represented by its Principal having address at Tamilnadu Government College and Hospital, Chennai – 600003,( hereafter referred to as, ‘the college’)
And Dr.C.Thulasingam working as Professor and Headin the Department of Prosthodontics, Tamilnadu Government College and Hospital, having residence address at No. 10/35 Venkier street,Chennai-79.(herein after referred to as the ‘Principal Investigator’)
And Dr.P.Mohankumar currently studying as Post Graduate Student in Department of Prosthodontics, Tamilnadu Government College and Hospital, Chennai – 3 (herein after referred to as the ‘PG Student and co-investigator’)
Whereas the PG Student as part of his curriculum undertakes to research on “EVALUATION OF EFFECT OF THREE DIFFERENT SOLUTIONS ON MECHANICAL PROPERTIES OF HEAT CUREDAND MICRO WAVE CURED DENTURE BASE RESIN-IN VITRO STUDY” for which purpose the principal investigator shall act as principal investigator and the college shall provide the requisite infrastructure based on availability and also provide facility to the PG Student as to extent possible as a Co-investigator.
Whereas the parties b this agreement have mutually agreed to the various issues including particular the copyright and confidentiality issues that arise in this regard.
Now this agreement witness as follow
1. The parties agree that all the research material and ownership therein shall become the vested right of the college, including in particular all the copyright in the literature including the study, research and all other related papers.
2. To the extent that the college has legal right to do go, shall grant to license or assign the copyright so vested with it for medical and/or commercial usage of interested persons/entities subject to a reasonable terms/conditions including royalty as deemed by the college.
3. The royalty so received by the college shall be shared equally by all the three parties.
5. The PG Student and Principal investigator undertake not to divulge (or) cause to be divulged any of the confidential information or, know-how to anyone in any manner whatsoever and for any purpose without the express written consent of the college.
6. All expenses pertaining to the research shall be decided upon by the principal investigator/Co-investigator or borne sole by the PG Student (Co-investigator). 7. That college shall provide all infrastructure and access facilities within and in
other institutes to the extent possible. This includes patient interactions, introductory letters, recommendation letters and such other acts required in this regard.
8. The Principal investigator shall suitably guide the student research right from selection of the research topic and area till its completion. However the selection and conduct of research, topic and area of research by the student researcher under guidance from the principal investigator shall be subject to the prior approval, recommendation and comments of the Ethical committee of the college instituted for this purpose.
9. It is agreed that as regards other aspects not covered under this agreement, but which pertain to the research undertaken by the PG Student under guidance from the Principal investigator, the decision of the college shall be binding and final. 10.If any dispute arises as to the matters related or connected to this agreement
herein, it shall be referred to arbitration in accordance with the provisions of the Arbitration and Conciliation Act, 1996.
In witness where of the parties hereinabove mentioned have on this the day month and year herein above mentioned set their hands to this agreement in the presence of following two witnesses.
College represented by its Principal Student guide
PG Student Witness
1.
CONTENTS
S.NO.
TOPIC PAGE
NO
1 INTRODUCTION 1
2 AIM AND OBJECTIVES 4
3 REVIEW OF LITERATURE 5
4 MATERIALS AND METHODS 19
5 RESULTS 28
6 DISCUSSION 46
7 SUMMARY AND CONCLUSION 53
8 ANNEXURES 54
LIST OF PHOTOGRAPHS
S.NO PHOTOGRAPHS
1.
FIG- I HEAT CURE DENTURE BASE RESIN2.
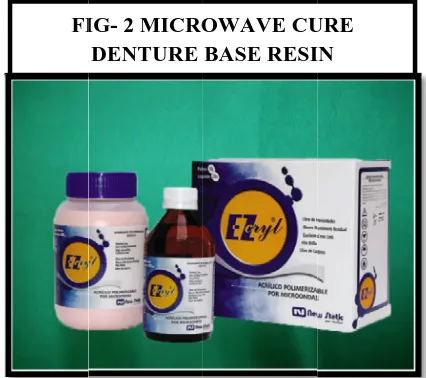
FIG- 2 MICROWAVE CURE DENTURE BASE RESIN3.
FIG- 3 ARMAMEMENTARIUM4.
FIG- 4 STEEL METAL DIE5.
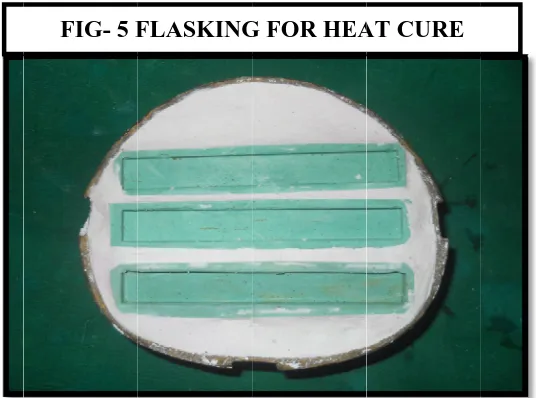
FIG- 5 FLASKING FOR HEAT CURE RESIN6.
FIG- 6 FLASKING FOR MICRO WAVE CURERESIN7.
FIG- 7 ACRYLISER8.
FIG- 8 MICRO WAVE OVEN9.
FIG- 9 HEAT CURED RESIN10.
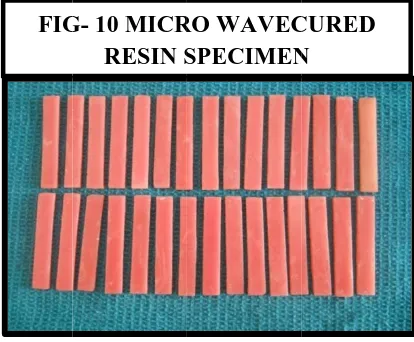
FIG- 10 MICRO WAVE CURED RESIN SPECIMEN11.
FIG- 11 CONTROL12.
FIG- 12 CHLORINATED WATER13.
FIG- 13 COFFEE14.
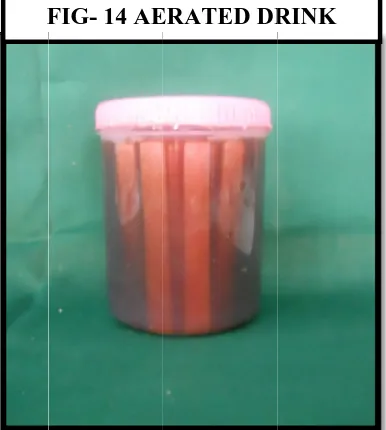
FIG- 14 AERATED DRINK15.
FIG- 15 UNIVERSAL TESTING MACHINE16.
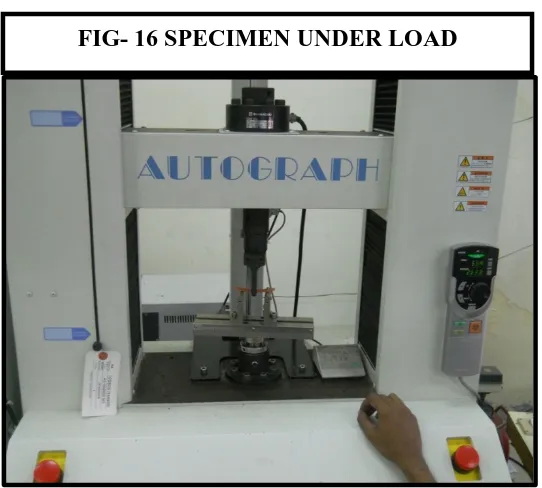
FIG- 16 SPECIMEN UNDER LOAD17.
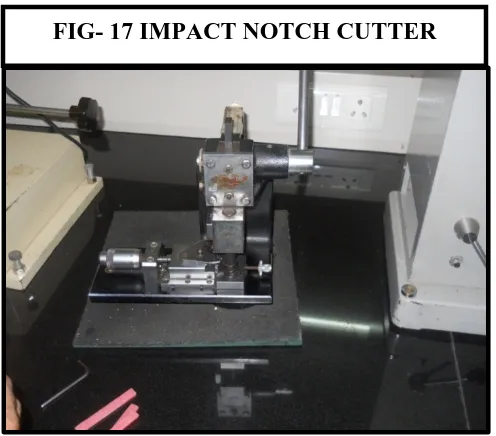
FIG- 17 IMPACT NOTCH CUTTER18.
FIG- 18 CHARPY IMPACT TESTER [image:9.612.102.545.87.718.2]LIST OF TABLES
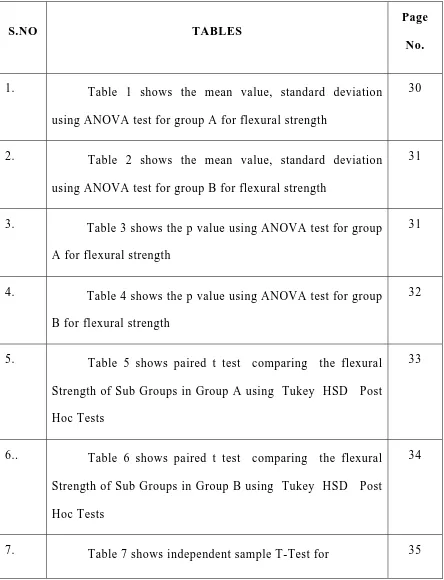
S.NO TABLES
Page No.
1. Table 1 shows the mean value, standard deviation
using ANOVA test for group A for flexural strength
30
2. Table 2 shows the mean value, standard deviation
using ANOVA test for group B for flexural strength
31
3. Table 3 shows the p value using ANOVA test for group
A for flexural strength
31
4. Table 4 shows the p value using ANOVA test for group
B for flexural strength
32
5. Table 5 shows paired t test comparing the flexural
Strength of Sub Groups in Group A using Tukey HSD Post
Hoc Tests
33
6.. Table 6 shows paired t test comparing the flexural
Strength of Sub Groups in Group B using Tukey HSD Post
Hoc Tests
34
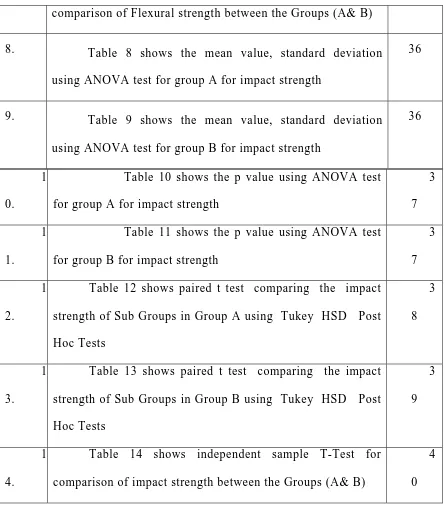
[image:10.612.103.547.118.698.2]comparison of Flexural strength between the Groups (A& B)
8. Table 8 shows the mean value, standard deviation
using ANOVA test for group A for impact strength
36
9. Table 9 shows the mean value, standard deviation
using ANOVA test for group B for impact strength
36
1
0.
Table 10 shows the p value using ANOVA test
for group A for impact strength
3
7
1
1.
Table 11 shows the p value using ANOVA test
for group B for impact strength
3
7
1
2.
Table 12 shows paired t test comparing the impact
strength of Sub Groups in Group A using Tukey HSD Post
Hoc Tests
3
8
1
3.
Table 13 shows paired t test comparing the impact
strength of Sub Groups in Group B using Tukey HSD Post
Hoc Tests
3
9
1
4.
Table 14 shows independent sample T-Test for
comparison of impact strength between the Groups (A& B)
4
0
[image:11.612.103.548.67.585.2]LIST OF BAR DIAGRAMS
S.No Bar Diagrams
1
Bar diagram shows comparison of sub groups in group A for
Flexural strength
2
Bar diagram shows comparison of sub groups in group B for
Flexural strength
3
Bar diagram shows inter comparison of group A and B for Flexural
strength
4
Bar diagram shows comparison of sub groups in group A for
Impact strength
5
Bar diagram shows comparison of sub groups in group B for
Impact strength
6
Bar diagram shows inter comparison of group A and B for Impact
strength
7
Bar diagram shows inter comparison of group A and B for Flexural
strength and Impact strength
ABSTRACT
Title
:EVALUATION OF EFFECT OF THREE DIFFERENT SOLUTIONS ON
MECHANICAL PROPERTIES OF HEAT CURED AND MICRO WAVE CURED
DENTURE BASE RESIN-IN VITRO STUDY
Aims andObjectives.To evaluate the mechanical properties of heat cured and micro wave cured denture base resin after immersing in different fluids routinely used in day to day
life. To find out the effect of fluids used in day to day life on the Flexural strength of the
heat cured resin and micro wave cured resin.To find out the effect of fluids on the Impact
strength of the heat cured resin and micro wave cured resin.
Method: Eighty samples of heat cured acrylic resin and microwave cured resin were prepared .Then they were divided into four subgrouped which were immersed in
chlorinatedwater,coffee and aerated drink.After which they were subjected to flexural and
impact strength analysisusing universal testing machine and Charpyimpact tester.
Results: Flexural and impact strength were measured and the mean values obtainedfor heat cured and microwaved cured resins using SPSS software statistical analysis was
done. It shows specimen immersed in aerated drink has significant difference in values
than other sub groups.
Conclusion: Micro wave cured resin has showed a significant increase in flexural strength and Impact strength than heat cured resin. The aerated drink has more
deleterious effect on the impact and flexural strength of samples of micro wave cured and
INTRODUCTION
Replacement of missing natural tooth had been started in 17 thcentury itself. So
many workers tried so many materials starting from animal bone to Polymers. Various
materials such as Charles Goodyear’s discovery of vulcanized rubber in 1840. John Hyatt
discovery of the first plastic molding material celluloid in1868, Dr. Leo Bakeland
discovered phenol formaldehyde resins such as Bakelite in 1909, were developed for
denture fabrication later metals and metal alloys were also tried.1
The poly methyl methacrylate was introduced by Dr. Walter, Wright1 and the
Vernon brothers in 1937 which is then brought about improvement in denture
construction with good esthetics, dimensional stability, ease of processing and accurate
fit.1,3Since then poly methyl methacrylate resin polymers made a remarkable
improvements in the construction of denture bases 95% of all dentures are now
constructed by poly methyl methacrylate polymers.2,3
The excellent working characteristics of poly methyl methacrylate made its usage
as a wide open in the Dental and Medical field.
The polymerization of poly methyl methacrylate involves a series of chemical
reactions such as initiation, propagation, termination and chain transfer.4
Polymerization of poly methyl methacrylate is initiated by breaking down the
benzoyl peroxide to form free oxygen radicals by heat or chemical source. These act
upon the vinyl group of methyl methacrylate opening the double bond causing formation
of a new single carbon bond. This is known as a free radical addition polymerization
During the polymerization process two or more polymer chains may get initiated
depending on the quantity of glycol dimethacrylate a crosslinking agent included in the
mixture. The opening of each double bond results in production of another free radical,
which in turn attack and join another double bond. This results in production of another
free radical and continuation of the reaction. This repeated reaction is referred to as chain
propagation.5
The free radicals attack at this point and link the methyl methacrylate molecules
together by methylene bridges (–CH2-). These chains carrying active free radical are
referred to as growing or live chains.6,5
Chain termination can occur at any time and is dependent upon the quantity of
available free radicals.Chain termination results from the depletion of all free radicals.
These free radicals maybe released from a chain or from the initiator. The transfer of a
hydrogen atom (hydrogen abstraction) in the system to the attacking free radical (terminal
position of the chain) results in termination of one chain reaction.7
This new chain reaction may or may not be on an existing polymer chain The
free radical formed from the methyl methacrylate double bond is not symmetrical. This
results in a carbon atom that also has an asymmetrical environment after reaction.
The presence of Saliva and Oral fluids and the oral consumption of the individuals
may have their impact on the denture base and tooth. Variations of PH and temperature of
these fluids have been considered as the causative factors. They have a tendency to
interfere or weakened the chains which are already formed by means of polymerization.8,9
Sorption is a process of absorption and adsorption of liquids and oral fluids. The
Solubility is the soluble substances leached out during storage in water and in the
oral fluids. The phenomena of sorption and solubility producing deleterious effects.
These effects may include volumetric changes such as swelling, physical changes such as
plasticization and softening, and chemical changes such as oxidation and
hydrolysis.8,9,10,11
The effect of various beverages and medicaments has not been studied in detail in
the past. Keeping this as a background this in vitro study is proposed with following aims
AIMS
AND
AIM:
To evaluate the mechanical properties of heat cured and micro wave cured denture
base resin after immersing in different fluids routinely used in day to day life.
OBJECTIVES:
1) To evaluate the Flexural strength and Impact strength of heat cured denture
base resin after immersed in three different fluid medium.
2) To evaluate the Flexural strength and Impact strength of microwave cured
denture base resin after immersed in three different fluid medium.
3) To compare the Flexural strength of heat cured and microwave cured
denture base resin after immersion in three different fluid medium.
4) To compare the Impact strength of heat cured and microwave cured
denture base resin after immersion in three different fluid medium.
REVIEW
OF
LITERATURE
REVIEW OF LITERATURE
Nishii M (1968)18 Introduced denture base polymerization through microwave
irradiation and became increasingly popular as an alternative to conventional water bath
processing and microwave polymerization has several advantages.
J.P.DeClerck (1987)19Concluded in his study that microwave processing has a
potential for saving time and money in processing dentures. Microwave oven cured resin
has a lower residual monomer ratio and the same physical properties as conventionally
cured resin. It requires at least special flasks and programmable microwave oven, but
specially designed equipment will give the best results.
Jun-ichi OKU (1989)20Conducted a study to find the temperature dependence of
the impact strength, resilience, and toughness of the heat cured and chemical cured
acrylic denture base resins. Impact strength was examined using a impact testing
machine. He concluded that impact strength may depend intensely on the motion of
molecules as increase in temperature.
1)The impact strength of all the acrylic denture base resins tested were decreased with
increase in temperature (23Ԩ to 60Ԩ).
(2)There was a good association between the impact strength and the
quantity of the residual monomer The coefficient of correlation was-0.95 for the
resilience, 0.92 for the impact strength and 0.94 for the toughness.
(3)In the chemical cured resins, the elastic modulus calculated from the result of the
(4)While chewing, the impact strength of denture base resins was very vulnerable to
temperature change and or the residual monomer.
Levin B, et al(1989)21Demonstrated the importance of physical characteristics of
microwave-cured resin are roughly the same as heat cured denture base resin cured.Their
results showed no statistically significant differences between dentures cured by either
method. The dentures cured by microwave energy has the benefits of reduced curing
time, ease, and cleanliness.
Shlosberg SR, et al (1989)22Conducted several physical property tests to compare
microwave energy and conventional thermal water bath curing techniques. Both the
methods of polymerization produced similar dimensional accuracy in complete denture
bases. No changes were found in transverse strength, Knoop hardness, density, and
residual monomer content from the tested samples. No porosity was observed in
removable partial denture bases and complete denture bases polymerized by either
technique.
Uchida K et al (1989)23 Compared the dimensional accuracy of microwave-cured denture base resin was with pour-type resin, heat-cured resin and heat-shock resin. From the test, the
following results were obtained. Dimensional accuracy of microwave-cured denture base resin
was better than that of heat-cured resin and heat-shock resin, and was similar to that of pour-type
resin. Dimensional accuracy of microwave-cured denture base resin by slow cooling method was
same with that rapid cooling method. These results suggest that microwave-cured denture base
resin is better when compared to other type of resin in clinic.
Alkhatib MB et al (1990)24Compared the transverse strength, hardness and
with thermal curing. No significant changes were found in transverse strength or hardness
between the tested samples.
Bafile M et al (1991)25Compared porosity of microwave cured denture resin and
heat cured denture base resin method. They concluded that no substantial differences
were found in mean porosity between the four groups of microwave-cured resin the
control group of methyl methacrylate monomer.
Sanders et al (1991)26Comparedthree denture base resin cured by water bath and
by microwave energy. The adaptation of the record bases to a standard cast was measured
to find if there were any significant changes in the fit that could be attributed to the
differences in curing methods and the brands of resin. The results showed statistically
significant difference for the heat cured resin generally, but clinically there were no
appreciable differences in the adaptation of the record bases with both the resins. The
adaptation of artificial dentures made from acrylic resin is clinically acceptable with
either microwave curing or the water bath method.
Salim S et al (1992)27Evaluated the dimensional accuracy of acrylic resin
specimens processed by three methods the SR- Ivocap system, conventional method, ,
and a microwave curing method. The dimensional accuracy was measured by the change
of the distance vector V, which is calculated from the dimensions of the distances
between fixed points on test specimens.The specimen cured by the conventional and the
microwave curing methods is more than the SR-Ivocap system. But SR-Ivocap system
S.G. Ilbay et al (1994)28 Investigated the hardness, mechanical and physical
properties of microwave cured denture base with respect to polymerization method,.
Twenty-one different polymerization methods were used by varying watt power and
curing time. The Vickers hardness test was used. Mechanical and physical tests were
carried for testing the samples which were cured by the recommended polymerization
method. The results showed that microwave cured acrylic resin cured is more resistant to
mechanical failure than heat cured acrylic resin.
Polyzois GLet al (199529) Measured the repair strength of denture base resins
repaired with heat cured resin, microwave cured resin, and chemical cured resin.
Transverse bend and impact strength tests were used for comparison. The results showed
that the transverse strength and impact strength of the microwave cured resin specimens
than others.
Vaidyanathan et al (1995)30Studied the clinical durability and performance of a
denture fabricated from heat cured resin, microwave cured resin and light cured resin.
Dynamic mechanical analysis was done using a flexural mode of deformation to
characterize the viscoelastic properties of denture base resins. The results indicate that the
microwave cured and heat cured resins are considerably different in their viscoelastic
properties from the light cured denture base resins
May KB, Shotwell JR(1995)31Evaluated the color stability of seven conventional
and one microwave processed heat cured denture base. The samples were exposed to
conditions of accelerated aging to test for color stability. The results of this study showed
Sadamori S et al (1997)32Studied the influence of thickness on changes in a heat cured and microwave cured denture base resin. These findings suggested that the
processing method and thickness of denture base resin determines the dimensional
change of acrylic resin dentures and also affected by localized changes.
Vlissidis D et al (1997)33 Investigated the effect of alcohol on the dynamic
strength and static strength of denture base resin. Wetting tensile specimens with alcohol
showed static strength by 16.1% and their fatigue strength by 14.3%. Polished specimens
immersed in various concentrations over 40% alcohol revealed considerable surface
corrosion which will reduce the fatigue strength of the denture base material.
T.Kanie et al(2000)34Determined the reinforcing effect of woven glass fibers on
flexural strength deflection, flexural modulus and impact strength of acrylic denture base
resin. Specimens were made by heating the denture cure resin dough containing glass
fibers. Specimens with four different thicknesses and of five different types were made.
He concluded that the impact strength for specimens reinforced with silanized glass fiber
of 2 mm thickness was significantly higher than unreinforced test specimens. Reinforcing
effect increased with the increase in number of glass fibers.
Mohammed Sohail and NorsiahYunus (2001)35Compared the impact and
transverse strengths and the flexural modulus of a relatively new microwave-polymerized
injection-molded polymer, conventional microwave cured denture resin and a heat cured
resin. Impact strength was measured using a Charpy-type impact tester and the transverse
strength and the flexural modulus were measured with a three-point bending test. The
For impact and flexural strengths the microwave-polymerized, injection-molded,
polyurethane-based polymer presented no significant change over the heat- and
microwave cured denture base polymers.
Celia Marisa Rizzatti-Barbosa et al (2001)36Analyzed water sorption by
polymerized acrylic resins under different pressure, temperature and time treatments. A
heat cured acrylic resin was processed at 73 °C for nine hours. Among forty-five samples
the control group samples were stored in a distilled water for 30 days, and specimen
groups were placed in a curing device with adjustable pressure, time and temperature. He
concluded that the alterations in temperature influenced the water sorption and pressure
did not affect water sorption level.
Yannikakis S, Zissis A, et al (2002)37Investigated the effect of microwave energy
on the porosity of heat-activated denture base resins. Conventional (Paladon 65) and
microwave polymerization (Acron MC), were used for this study.The result showed
minor porosity was identified in thin sections and more severe porosity in thicker areas of
specimens that cured by microwave energy.
Radhwan H Hasanet al (2003)38 Evaluated the porosity and transverse strength
for microwave cured acrylic resin using new Iraqi micro wavable flask. For transverse
strength test, 20 acrylic samples were prepared. Ten samples were processed by hot water
bath technique, while the other 10 samples were prepared by microwave energy
technique. Results showed no statistically significant differences.
GianlucaZappiniet al (2003)39Determined the fracture toughness of denture base
resins and to compare the results with impact strength. Heat-polymerized denture base
configuration influenced the impact strength. The fracture toughness method appears to
be more appropriate than impact strength measurements to determine the effects of resin
modifications.
Keenan PL et al (2003)40Compared differences in dimensional changes of
simulated maxillary complete dentures during polymerization and storage in water after
injection molding, conventional polymerization, or microwave polymerization .In this
study injection molding resulted in a slightly increase of vertical dimension of occlusion
than conventional resin.
Azzarri MJet al (2003)41Evaluated the effect of the different conditions of curing
on the residual monomer levels, impact strength, hardness of a microwave cured acrylic
resin. The material was cured in a microwave oven in four different conditions of watt
power and curing time. They concluded that from the appropriate selection of power and
time of curing of the resin, it is probable to optimize the level of residual monomer with
low cytotoxicity without altering the mechanical properties.
Marco Antonio Compagnoni et al (2004)42Evaluated the effect of different
polymerization cycles on the porosity of a acrylic denture base resin intended for
microwave polymerization. In this study, a denture base resin specifically intended for
microwave polymerization was not affected by different polymerization cycles. The
results suggest that microwave cured resin had the same level conventional water bath
Keyf Fet al (2004)43Determined the gloss changes resulting from the testing process in four different beverages in heat-polymerized denture base resin and chemical
cured denture base repair resin. The samples were immersed in water, tea, coffee, cola
and cherry juice solutions. The samples was measured with the glossmeter at 45th day
and 135th day of testing. It showed both are tested agents, and the four beverages
demonstrated noticeable gloss changes. Cherry juice demonstrated the least change,
while tea exhibited the greatest change.
C.-P. Lai , M.-H. Tsai , M. Chen et al( 2004)44Examined the influence of
microwave energy levels on the morphology and impact strength of denture base resin.
Statistical differences was noted in morphology and flexural properties favor of the
conventional water-bath method. Microwave power and polymerization time is
significant in order to decrease porosity to a minimum level and increase the domain size
and volume of the rubber phase.
Iara Augusta Orsiet al (2004)45The purpose of this study was to assess the effect
of immersion in different chemical disinfectants for variable time periods on the
transverse strength of chemically and mechanically polished heat-polymerized acrylic
resins. Data were analyzed using ANOVA and Student t test. He concluded that the
acrylic resins which was polished either mechanically or chemically did not demonstrate
significant changes in transverse strength.
Thomas R.Meng et al (2005)46 Determined the Izod impact strength, the flexural strength, the flexural modulus, and the yield distance for denture resins. Flexural strength,
strength was determined using an Izod tester on un-notched specimens. He concluded
that Flexural modulus had an inverse relationship to the impact strength, flexural
strength, and yield distance.
Fernanda Faotet al (2006)47This study evaluated the impact strength and fracture
morphology of denture base acrylic resins processed by microwave energy and hot water
bath. The impact strength was evaluated in an impact testing machine using the Charpy
method. Acrylic resins exhibited a high number of brittle fractures irrespective of the
processing technique.
Camilo Machado (2007)48This study was carried out to compare the transverse
strength of three denture base materials, namely heat cured resin Lucitone 199 and light
cured resin( Triad VLC, Eclipse). The transverse strength values showed substantial
differences between the three denture base materials. Eclipse showed the highest
transverse strength among the materials tested. Thus it may provide a better alternative to
traditional denture base resins.
Rosangela et al(2007) 49Evaluated the effect of hot water and microwave
post-polymerization treatments on the flexural strength and Vickers hardness of four chemical
reline resins and heat-polymerized acrylic resin. He took thirty specimens for each
material and divided into 3 groups Data were analyzed by two-way ANOVA followed by
Tukey’s HSD test. He concluded that the hardness of the tested materials was not
influenced by the post-polymerization treatments and used to improve the flexural
strength.
Al- Nori and RejabLT(2007)50 Evaluated the effect of the different curing
different types of heat–cured acrylic resins .Water sorption and solubility were measured
by means of mass change in the materials after water saturation and dehydration. It
showed that curing method and immersion period have a significant effect on the water
sorption and solubility ratios of the resins. Curing by microwave energy method and
increasing immersion period caused increasing in the ratios. The type of heat–cured
acrylic resin has an effect but the difference was not significant.
Débora Barros Barbosa (2007)51 Evaluated the influence of microwave polymerization on the flexural strength of a conventional heat-polymerized, a microwave polymerized and a auto polymerizing acrylic resins. The microwave polymerized resin showed the highest means for flexural strength and there were no significant differences among them. The heat-polymerized group showed the lowest flexural strength means ,and differ significantly from all groups.
RejabL (2008)52 Evaluated the effect of the thermo press curing technique on the
water sorption and solubility of the chemical–cured and heat cured acrylic resins He
compared with the bench curing technique used for the cold cured resin and with the
conventional water bath curing technique for the heat cured resin. There is a significant
differences between the water sorption and solubility of resin that cured by the different
curing methods and different curing cycle times. The water sorption and solubility of
resin specimens that cured by thermo press have the higher values. And also curing under
higher pressure produces specimens with lower water sorption and solubility values.
Mithaq R. Mohammed (2008)53 The aim of this study was to compare the effect
of chlorehexidine and sodium hypochlorite as a disinfectant solutions on the surface
roughness of acrylic materials was not affected by immersion in any disinfectant solution
this is due to the effect of glutaraldehyde base disinfectants (alkaline, phenol buffered) on
surface morphology of denture base resin and also the disinfectant solution was able to
reduce the pathogenicity and colorization of micro organism present on the surface of the
material.
Nadia A et al (2008)54 Conducted the two folded study: an in vivo study aimed to
compare between the clinical efficiency of heat-cured and microwave-cured over denture
bases, In-vitro study to relate the chemical, physical and mechanical properties, to the
clinical performance of these over dentures. In vivo study the mandibular over dentures
were weighed and their thicknesses were measured at predetermined fixed points on
denture bases. In-vitro study result showed that heat cured acrylic resins exhibited higher
wear resistance, and also their over denture bases showed decreased in weight in contrast
to microwave cured bases which showed slight increase in weight and decrease in wear
resistance over the follow up periods.
Ana M. Diaz-Arnold et al (2008)55 Evaluated the static and dynamic flexure
properties of a heat-polymerized resin and visible light cured resins. The visible
light-polymerized urethane dimethacrylate resin showed greater flexural strength than all
heat-polymerized resins for both static and cycled groups. The Eclipse material had lower load
limits, and demonstrated brittle-type behavior.
SuleymanHakan Tuna et al (2008)56 Studied heat cure resin and chemical cured
resin to evaluate water sorption and water solubiity. The results of the water sorption and
harmony with the ISO specification. No correlation found between water sorption and
water solubility values.
Helena de Freitas Oliveira (2009)57Evaluated the color stability, surface
roughness and flexural strength of a microwave-polymerized acrylic resin after
immersion in sodium hypochlorite (NaOCl), simulating 20 min of disinfection daily
during 180 days. The flexural strength was measured using a 3-point bending test in a
universal testing machine. He concluded that immersion in NaOCl solutions simulating
short-term daily use during 180 days did not influence the color stability, surface
roughness and flexural strength of a microwave-polymerized acrylic resin.
Fernanda Faot, Leonardo H V Panza, (2009)58 Evaluate the impact and flexural
strength and analyzed the fracture behavior of various heat cured acrylic resins. The
impact strength was evaluated in notched specimens and flexural strength in unotched
specimens. Fragments from mechanical tests were observed by SEM. Impact resin
showed improved mechanical properties with high capacity of stress absorption and
energy dissipation before fracture than conventional heat cure resin.
Mohammed NZ (2010)59Determined the effect of thickness and additives such as
Nigella Stavia oil and Thymol oil on water sorption and solubility of heat cured acrylic
resin denture base. Additive materials (0.5%) each of Nigella Stavia oil and Thymol oil
were added . Water sorption and solubility of specimens were measured by mean of mass
change in material after water saturation and dehydration. Increase thickness causes
Rajlakshmi Banerjee and Sujoy Banerjee (2010)60 Compared the flexural fatigue
strength of denture base resins polymerized by the conventional water bath, microwave,
and pressure cooker polymerization techniques. Flexural fatigue strength were measured
using a cyclic 3-point loading method on a dynamic universal testing machine. Flexural
fatigue strength of samples processed by hot water bath processing and the microwave
technique showed statistically significant results. He concluded that polymerization
procedure plays important role in influencing the flexural fatigue strength of denture base
resins.
Rola W. Abdul-Razaqet al (2011)61Investigated the effect of Pepsi solution on
tensile bond strength with and without surface treatment of the denture base material. The
results revealed that there was no significant difference in tensile bond strength, for all
test specimens stored in water while there was highly significant difference for the test
specimens stored in Pepsi.
Pooran Chand, Chandra Bhusan Singh Patel(2011)62 Evaluated the transverse
deflection and transverse strength of four commercial brands of heat cure acrylic resin
using Instron testing machine. Trevalon "HI" also had minimum value of mean transverse
strength among different brands of acrylic resins. There was no statistically significant
difference between Stellon, Acrylin-H and Trevalon. The heat cure denture base material
D (Trevalon "HI") was the strongest and C (Trevalon) was the weakest among all
materials used in this study.
Amanda FucciWady (2011)63Studied the effect of water storage on the impact
Charpy impact test after immersion in water for 7, 90 and 180 days. Result showed
difference in Impact strength values for acrylic resins when immersed in Water at
inconstant time and also suggested that adhesion between the denture base and reline
materials at their interface may influence the resistance to fracture of relined denture
bases.
Hae-Hyoung LEE, Chung-Jae LEE(2012)64 Measured various mechanical
properties including flexural modulus, flexural strength, fracture toughness, Barcol and
Vickers hardness and correlations between them. Data from the mechanical tests were
examined using correlation tests. The flexural modulus value showed reasonable positive
association with those of proportional limit, flexural strength, and surface hardness.
MATERIALS
AND
METHODOLOGY
MATERIALS AND METHODS
The present study was conducted to evaluate the effect of different liquids
consumed by the common man in his routine life on the impact and flexural
strength of heat cured and microwave cured acrylic resins. The materials and
the armamentarium used in this study were shown below.
S.NO NAME OF THE
MATERIAL
COMMERCIAL
NAME
MANUFACTURER
1
Heat polymerizing poly methyl methacrylate resin
Hi flex Hi flex,Prevest DenproLtd,INDIA
2 Micro wave resin EC –CRYL (EC –CRYL) Private Ltd, Columbia
3 Aerated drink Coca –cola Hindustan Coca –cola beverages,INDIA
4 Coffee Nescafe Nestle,Private Ltd INDIA.
STUDY DESIGN
DENTURE
BASE
RESIN
RESULTS
IMMERSION
IN,
CONTROL,
CHLORINATED
WATER,
COFFEE,
AERATED
DRINK
HEAT
CURED
RESIN
MICRO
WAVE
SUBGROU CONTR
SUBGROU CONTR
UP A OL
UP A OL F SUBGROU CHLORINA WATER SUBGROU CHLORINA WATER FLOWCHA GROUP
(HEAT CUR
RESIN)
UP B ATED
R
GROUP
(MICRO W
CURED RE
UP B ATED R ART: A RED ) SUBGROU COFFEE B WAVE ESIN) SUBGROU COFFE
UP C E
UP C E
SUBGROU AERATED D
SUBGROU AERATED D
UP D DRINK
The table showing immersion media used in the present study showing
the quantity generally used for single use, approximate time spent for
single use and the duration adopted which is equivalent to three years.
Solution Amount
consumed /day
Approx. time
spent/dose
Duration equivalent
to 3 years
Chlorinated water 1 litre 1 min 18 hours
Coffee 120 ml 3 min 55 hours
Aerated drink 300 ml 5 min 91 hours
Armamentarium used for the study 1. Custom fabricated stainless steel dies
2. Glass plate
3. Rubber bowl
4. Plaster mixing Spatula
5. Camel hair brush
6. Bard Parker knife
7. Conventional metallic flasks with clamp
8. Cement mixing stainless steel spatula
9. Porcelain jar
10.Fibre reinforced Plastic flask
11.Metallic flask(brass)
12. Acrylizer
13.Acrylic trimmers
14. Tungsten carbide bur
15.Micro motor
16. Silicon carbide paper
PREPARATION OF THE SAMPLES & GROUPING:
The samples for this in vitro study was prepared according to ISO specification
(1567).A total number of 160 samples were prepared with dimension of
80x10x3millimetre.Out of which 80 samples were prepared from heat cured acrylic resin
(group A) and the other 80 samples were prepared from micro wave cured resin (group
B).Each category of acrylic resin and microwave polymerization were again divided into
four sub groups as follows sub group I, II, III, IV. The group I samples were used as
control group. Twenty samples were allotted for each sub group out of which 10 samples
were taken up from (group A) and another 10 samples were taken from
( group B).
PREPARATION OF STAINING SOLUTIONS
The coffee solution was prepared by adding 20g of coffee powder (Nestle India
LTD, New Delhi ,India) into 1000ml of boiled distilled water and stirred until they
cooled down to 370C and then poured into a jar. Aerated drink (Hindustan Coca cola
Beverages Private LTD, India) and Chlorinated water are poured into separate jar and
the acrylic specimens fabricated were immersed in the solutions respectively.
PREPARATION OF TEST SAMPLES
A rectangular steel die was milled from a metal blank measuring 80x10x3 mm
to simulate the bar .This steel die bar was used to create a stone mold by investing in a
type III dental stone (Kalabhai, Mumbai, India) according to manufacturer’s instruction.
Stone mold was separated and trimmed to remove the excess, mold was filled
gold Asian chemicals, Mumbai). After dewaxing procedure, heat cured acrylic resin
samples were prepared in a usual manner following the normal processing procedure.
According to manufacturer’s instructions powder and liquid were taken in a ratio
of 3:1by volume. First the monomer is poured into a porcelain jar, powder was added in
slow steady manner until dry powder appears on the surface. Then the jar was tapped for
4-5 times until the saturation of both powder and liquid .Then the mix was thoroughly
mixed with spatula for 1 minute, then the jar was closed until the dough stage to
reach.13When the dough stage was reached, the resins were packed into the molds by
compression molding technique. After trial packing the flasks were closed and allowed for
bench curing for 30 minutes.14
Samples of resin were cured at 70 degree centigrade for one and half hours
followed by terminal boiling for one hour. After processing all of the flasks were allowed
to bench cool for 30 minutes, followed by immersion in running water for 15 minutes.
After deflasking the rectangular resin samples were retrieved from the mold and immersed
in distilled water at 37 ± 1°C for 50 ± 2 hours for residual Flash and excess resin were
removed and trimming was done with aluminium carbide acrylic trimmers. Each specimen
were finished using 600, 800 grit silicon carbide paper and polished with pumice slurry.
For micro wave cured resin the stone mold with wax pattern was invested in a
plaster and stone mix 50% of each according to manufacturer’s instructions in a
polycarbonate flask reinforced with fiber glass15, after the setting of plaster separating
media petroleum jelly was applied over stone mold. Then the flask is closed by replacing
counterpart. Dewaxing was done in microwave oven at 750 watt for a period of one
cotton and again kept in oven for 1 minute for the removal residual wax, Later the flask
was allowed to bench cool for 10 min, then the isolant was applied over the mold space.16
According to the manufacturer’s instructions 23.5gms of powder and 10 ml of
liquid were taken, the monomer is poured into a porcelain jar then powder was added in
slow steady manner until dry powder appears on the surface. Then the jar was tapped for
4-5 times until the saturation of both powder and liquid. Then the mix was thoroughly
mixed with spatula for one minute, then the jar was closed to reach the dough stage.
When the dough stage was reached, the resins were packed into the molds with 2
bar/pressure after trial packing the screw was tightened.16
Calibration of microwave oven
Micro wave resin with turning table were used for even distribution of microwave
energy over flask with 10% increment in adjustment, it is calibrated for processing by
keeping 1 liter of water at room temperature in the oven allow to raise in temperature by 2
degree in 1 min then it is calculated for percentage.
After calibration the polycarbonate flask was kept in oven for nine minutes at
750 Watts. Micro wave oven should not be opened for next 10-15
minutes since secondary microwave energy will act on it afterwards the flask was
removed and immersed in water at room temperature for 10 minutes. Then specimens
were recovered with plastic hammer or horn mallet and immersed in distilled water at 37
± 1°C for 50 ± 2 hours for residual monomer release.16,17
The specimens were trimmed using stones, trimmers and finished by 400,600,800
grit sand papers pumice slurry was used for polishing for the specific dimensions of
In each subgroup,10 specimens were tested for impact strength, flexural strength
for three different medium for both heat cure resin and microwave cured resin after
immersion in different media.
All the prepared specimens were then subjected for Impact strength, Flexural
strength tests in the testing machine.
Impact strength of the acrylic resin was calculated using 300 joules capacity
impact testing machine (Notched Impact Tester ASTM D-256, Tinius Olsen USA).
Impact strength was tested by the Charpy system .when the hammer of the impact testing
machine hits the specimen, reading at which the specimen breaks gives the impact
strength it is the pendulum type and the impact strength values were obtained directly in
the machine scale. mpact strength was expressed in gram force-centimeter (gf-cm).
For flexural strength the specimens were submitted to 3-point bending test in a
universal testing machine (Shimadzu Tokyo JAPAN) with a maximum capacity of 50
kilo newton and cross cut speed of 1.3millimetre/min. The flexural strength value was
obtained using the formula
F=3WL/2bd2
Where F=flexure strength
W=ultimate load before the failure (KN)
L=distance between the support points (50 mm)
b=specimen width (10 mm)
d=specimen thickness (3 mm)
Results were obtained in Mpa by multiplying the values in KN/mm2 by the
FIG- I H
FIG- 3 HEAT CURE BASE RES 3 ARMAMEM E DENTURE SIN MENTARIU E UM FI FI
IG- 2 MICRO DENTURE
IG- 4 STEE
[image:45.612.109.312.89.282.2]
[image:46.612.217.485.78.277.2]
FI
FIG- 5 F
IG- 6 FLAS
FLASKING
KING FOR CURERES
G FOR HEA
R MICRO W SIN
AT CURE
[image:47.612.110.580.93.582.2]
F
[image:47.612.362.580.96.278.2] [image:47.612.364.571.397.568.2]FIG- 9
FIG- 7 ACRY
HEAT CUR
YLISER
RED RESIN
N
FI
FIG
IG- 8 MICR
G- 10 MICR RESIN S
RO WAVE
RO WAVEC SPECIMEN
OVEN
F
F
[image:48.612.111.564.70.388.2]FIG- 11 CO
FIG- 13 CO
S
ONTROL
OFFEE
SPECIMEN IMMMERSION
FIG- 12
F
[image:48.612.111.326.454.686.2]2 CHLORIN
FIG- 14 AE
NATED WA
ERATED DR ATER
RINK
[image:48.612.376.569.465.680.2]
[image:49.612.130.457.107.376.2]
[image:49.612.209.480.414.658.2]
FIG- 15 UNIVERSAL TESTING MACHINE
[image:50.612.246.494.91.309.2]
FIG- 17 IMPACT NOTCH CUTTER
[image:50.612.131.585.364.569.2]RESULTS
This study was performed to evaluate the mechanical properties of heat cured and
micro wave cured denture base resin after immersing in different fluids routinely used in
day to day life.
The results were obtained after subjecting the samples to a universal testing
machine for flexural strength and Charpys impact tester for impact strength. In this study
the denture base resins were grouped into A, and B .For each group four observations
were made for control, chlorinated water, coffee, and aerated drink. The basic data of the
results are shown in Annexure.
Results of this study are shown below
Table 1 shows the mean value, standard deviation using ANOVA test for group
A. for flexural strength.
Table 2 shows the mean value, standard deviation using ANOVA test for group B
for flexural strength.
Table 3 shows the p value using ANOVA test for group A for flexural strength.
Table 4 shows the p value using ANOVA test for group B for flexural strength.
Table 5 shows paired t test comparing the flexural Strength of Sub Groups in
Group A using Tukey HSD Post Hoc Tests.
Table 6 shows paired t test comparing the flexural Strength of Sub Groups in
Table 7 shows independent sample T-Test for comparison of Flexural strength
between the Groups (A& B).
Table 8 shows the mean value, standard deviation using ANOVA test for group
A. for Impact strength.
Table 9 shows the mean value, standard deviation using ANOVA test for group B
for impact strength.
Table 10 shows the p value using ANOVA test for group A for impact strength.
Table 11 shows the p value using ANOVA test for group B for impact strength.
Table 12 shows paired t test comparing the Impact Strength of Sub Groups in
Group A using Tukey HSD Post Hoc Tests.
Table 13 shows paired t test comparing the Impact Strength of Sub Groups in
Group B using Tukey HSD Post Hoc Tests.
Table 14 shows independent sample T-Test for comparison of Impact strength
between the Groups (A& B).
Bar diagram 1 shows comparison of sub groups in group A for Flexural strength.
Bar diagram 2 shows comparison of sub groups in group B for Flexural strength.
Bar diagram 3 shows inter comparison of group A and B for Flexural strength.
Bar diagram 5 shows comparison of sub groups in group B for Impact strength.
Bar diagram 6 shows inter comparison of group A and B for Impact strength.
Bar diagram 7 shows inter comparison of group A and B for Flexural strength and Impact
strength
[image:54.612.102.529.319.450.2]Group A FLEXURAL STRENGTH
Table 1 shows the mean value, standard deviation using ANOVA test for group A
S.NO SUB GROUP N MEAN SD
1. Control 10 74.60 6.60
2. Chlorinated water 10 74.58 5.74
3. Coffee 10 74.40 6.96
Group B FLEXURAL STRENGTH
Table 2 shows the mean value, standard deviation using ANOVA test for group B
S.NO SUB GROUP N MEAN SD
1. Control 10 84.30 8.47
2. Chlorinated water 10 81.90 6.37
3. Coffee 10 81.86 6.54
4. Aerated Drink 10 71.49 6.26
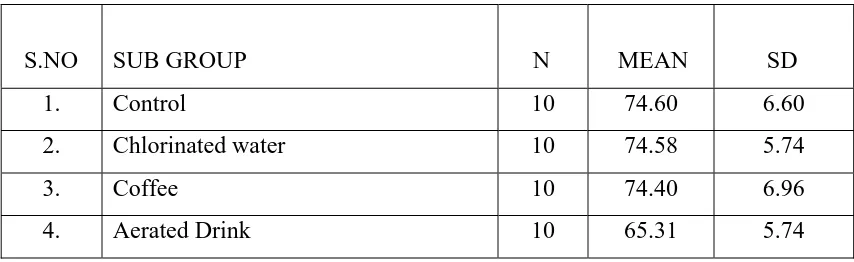
Table 3 shows the p value using ANOVA test for group A for flexural strength,
S.NO SUB GROUP N MEAN SD
1. Control 10 74.60b 6.60
2. Chlorinated water 10 74.58b 5.74
3. Coffee 10 74.40b 6.96
4. Aerated Drink 10 65.31a 5.74
F Ratio = 5.390
P Value<o.oo5
Note:
If P value is 0.000 to 0.010 then denoted by ** => Significant at 1 % level
If P value is 0.011 to 0.050 then denoted by * => Significant at 5 % level
Different alphabets between groups denote significance at 5% as per post hoc test
TukeyHSD.The subsets are denoted by alphabets and the alphabets denote values in
increasing order.
[image:55.612.103.529.355.533.2]Table 4 shows the p value using ANOVA test for group B for flexural strength.
S.NO SUB GROUP N MEAN SD
1. Control 10 84.30b 8.47
2. Chlorinated water 10 81.90b 6.37
3. Coffee 10 81.86b 6.54
4. Aerated Drink 10 71.49a 6.26
F Ratio = 6.727
P Value<o.oo1
Table 5 shows paired t test comparing the flexural Strength of sub Groups in
Group A using Tukey HSD Post Hoc Tests
(I) Sub Group (J) Sub Group Mean Differenc
e (I-J)
Std. Error Sig.
95% Confidence Interval
Lower Bound Upper Bound Control Chlorinated water
-.19695 2.8097 1.000 -7.764371 7.370471
Coffee -.17765 2.8097 1.000 -7.745071 7.389771 Aerated Drink 9.0980(*) 2.8097 .013 1.531399 16.666241
Chlorinated water
Control .196950 2.8097 1.000 -7.370471 7.764371 Coffee .019300 2.8097 1.000 -7.548121 7.586721 Aerated Drink 9.2950(*) 2.8097 .011 1.728349 16.863191
Coffee Control .177650 2.8097 1.000 -7.389771 7.745071
Chlorinated water
-.019300 2.8097 1.000 -7.586721 7.548121
Aerated Drink 9.2764(*) 2.8097 .011 1.709049 16.843891 Aerated Drink Control
-9.0980(*)
2.8097 .013 -16.666241 -1.531399
Chlorinated water
-9.2950(*)
2.8097 .011 -16.863191 -1.728349
Coffee -9.2760(*)
2.8097 .011 -16.843891 -1.709049
[image:56.612.104.578.326.700.2]Table 6 shows paired t test comparing the flexural Strength of sub Groups in
Group B using Tukey HSD Post Hoc Tests
(I) Sub Group (J) Sub Group
Mean Difference
(I-J)
Std.
Error Sig.
95% Confidence Interval Lower
Bound
Upper Bound
Control Chlorinated water
2.3929 3.1159 .868 -5.999078 10.785018
Coffee 2.4333 3.1159 .863 -5.958778 10.825318 Aerated Drink 12.809(*) 3.1159 .001 4.417322 21.201418
Chlorinated water
Control -2.3929 3.1159 .868 -10.785018 5.999078 Coffee .040300 3.1159 1.000 -8.351748 8.432348 Aerated Drink 10.416(*) 3.1159 .010 2.024352 18.808448
Coffee Control -2.4332 3.1159 .863 -10.825318 5.958778 Chlorinated
water
-.04030 3.1159 1.000 -8.432348 8.351748
Aerated Drink 10.376(*) 3.1159 .010 1.984052 18.768148 Aerated Drink Control -12.809*) 3.1159 .001 -21.201418 -4.417322
Chlorinated water
-10.416(*) 3.1159 .010 -18.808448 -2.024352
Coffee -10.370(*) 3.1159 .010 -18.768148 -1.984052
Table 7 shows independent sample T-Test for comparison of Flexural strength
between the Groups (A& B)
Flexural Strength Levene's Test for Equality of Varianc es
t-test for Equality of Means
F Sig. T df
Sig (2tai led) Mean Diffe rence Std. Error Differenc e 95% Confidence Interval of the
Difference
Lower Upper
(Control) Equal variance s assumed .113 .741 -2.85
18 .011 -9.89 3.46 -17.17 -2.6
Equal variance s not assumed -2.85
17.3 .011 -9.89 3.46 -17.19 -2.58
(Chlorina ted water) Equal variance s assumed
.099 .757
-2.51 18 .021 -7.30 2.9 -13.39 -1.2
Equal variance
s not assumed
-2.51 17.9 .021 -7.3 2.9 -13.39 -1.2
(Coffee)
Equal variance
s assumed
.152 .701
-2.64 18 .016 -7.28 2.75 -13.06 -1.5
Equal variance
s not assumed
-2.6 17.7 .017 -7.28 2.75 -13.06 -1.4
(Aerated Drink) Equal variance s assumed
.032 .859 -2.3 18 .033 -6.18 2.68 -11.82 -.53
Equal variance
s not assumed
-2.3 17.8 .034 -6.18 2.68 -11.82 -.53
GROUP A IMPACT STRENGTH
Table 8 shows the mean value, standard deviation using ANOVA test for group A
S.NO SUB GROUP N MEAN SD
1. Control 10 26.35 2.97
2. Chlorinated water 10 24.58 1.41
3. Coffee 10 24.55 1.88
4. Aerated Drink 10 18.50 2.15
[image:59.612.103.530.371.501.2]GROUP B IMPACT STRENGTH
Table 9 shows the mean value, standard deviation using ANOVA test for group B
S.NO SUB GROUP N MEAN SD
1. Control 10 30.14 1.69
2. Chlorinated water 10 28.62 6.59
3. Coffee 10 28.45 1.30
4. Aerated drink 10 23.58 1.53
Table 10 shows the p value using ANOVA test for group A for Impact strength
S.NO SUB GROUP N MEAN SD
1. Control 10 26.35b 2.97
2. Chlorinated water 10 24.58b 1.41
3. Coffee 10 24.55b 1.88
4. Aerated Drink 10 18.50a 2.15
F Ratio 24.799
[image:59.612.100.533.535.712.2]Table 11 shows the p value using ANOVA test for group B for Impact strength,
S.NO SUB GROUP N MEAN SD
1. Control 10 30.14b 1.69
2. Chlorinated water 10 28.62b 6.59
3. Coffee 10 28.45b 1.30
4. Aerated Drink 10 23.58a 1.53
F Ratio 6.442
P Value<o.oo1
Table 12 shows paired t test comparing the Impact Strength of sub Groups in
Group A using Tukey HSD Post Hoc Tests
(I) Sub Group (J) Sub Group
Mean Differenc e (I-J) Std. Error Sig.
95% Confidence Interval
Lower Bound Upper Bound Control Chlorinated water
1.7695 .97489 .283 -.856090 4.395150
Coffee 1.7963 .97489 .271 -.829280 4.421960 Aerated Drink 7.845(*) .97489 .000 5.219530 10.470770
Chlorinated water
Control -1.7695 .97489 .283 -4.395150 .856090
Coffee .026810 .97489 1.00 -2.598810 2.652430 Aerated Drink 6.0756(*) .97489 .000 3.450000 8.701240
Coffee Control -1.7963 .97489 .271 -4.421960 .829280 Chlorinated
water
-.02681 .97489 1.000 -2.652430 2.598810
Aerated Drink 6.0488(*) .97489 .000 3.423190 8.674430 Aerated Drink Control
-7.8450(*)
.97489 .000 -10.470770 -5.219530
Chlorinated water
-6.0750(*)
.97489 .000 -8.701240 -3.450000
Coffee -6.0410(*)
.97489 .000 -8.674430 -3.423190
[image:60.612.105.583.366.678.2]Table 13 shows paired t test comparing the Impact Strength of sub Groups in
Group B using Tukey HSD Post Hoc Tests
(I) Sub Group (J) Sub Group Mean Differenc
e (I-J)
Std. Error
Sig.
95% Confidence Interval
Lower Bound Upper Bound Control Chlorinated water
-.16346 1.5860 1.00 -4.434978 4.108058
Coffee -1.6916 1.5860 .712 -5.963208 2.579828 Aerated Drink 4.8666(*) 1.5860 .020 .595142 9.138178
Chlorinated water
Control .16346 1.5860 1.000 -4.108058 4.434978
Coffee -1.5282 1.5860 .771 -5.799748 2.743288 Aerated Drink 5.0301(*) 1.5860 .016 .758602 9.301638
Coffee Control 1.6916 1.5860 .712 -2.579828 5.963208 Chlorinated
water
1.52823 1.5860 .771 -2.743288 5.799748
Aerated Drink 6.5583(*) 1.5860 .001 2.286832 10.829868 Aerated Drink Control
-4.8666(*)
1.5860 .020 -9.138178 -.595142
Chlorinated water
-5.0301(*)
1.5860 .016 -9.301638 -.758602
Coffee -6.5583(*)
1.5860 .001 -10.829868 -2.286832
* The mean difference is significant at the .05 level.
Table 14 shows Independent sample un paired T-Test for comparison of Impact
strength between the Groups (A& B)
Impact Strength Levene's Test for Equality of Variances
t-test for Equality of Means
F Sig. T df
Sig. (2-tailed ) Mean Differenc e Std. Error Differenc e 95% Confidence Interval of the
Difference Lowe r Uppe r Control Equal variance s assumed 5.5 7 .03 0 -1.9 4
18 .067 -2.10 1.08 -4.37 .166
Equal variance s not assumed -1.9 4 14. 2
.071 -2.10 1.08 -4.41 .209
Chlorinate d Water Equal variance s assumed 31. 5 .00 0 -1.8 9
18 .074 -4.03 2.13 -8.51 .439
Equal variance s not assumed -1.8 9 9.8
1 .088 -4.03 2.13 -8.79 .722
Coffee Equal variance s assumed 1.1 0 .30 7 -7.7 3
18 .000 -5.59 .723 -7.11 -4.07
Equal variance s not assumed -7.7 3 16.
0 .000 -5.59 .723 -7.12 -4.05
Aerated drink Equal variance s assumed 2.1 1 .16 3 -6.0 8
18 .000 -5.08 .835 -6.83 -3.32
Equal variance s not assumed -6.0 8 16.
2 .000 -5.08 .835 -6.85 -3.31
Statistical analysis of the results
The collected data for the heat cured resin and micro wave cured resin were
analyzed using SPSS 16.000 Software. To describe the descriptive statistics mean,
standard deviation were used. The overall group comparison was done using one-way
ANOVA (Analysis of Variance) with a significant level of 1% followed by inter group
comparison which was done using multiple comparison post hoc TUKEY HSD test with
a significant level of 5%.To find significance paired T test between the groups were used.
Table I – shows the mean and standard deviation of flexural strength for the heat cured polymerized resin. On evaluation the specimens immersed in aerated drink show
decreased flexural strength of 65.31 Mpa and standard deviation of 5.74 and control