STUDY OF RELATIONSHIP BETWEEN PLASMA
HOMOCYSTEINE LEVELS AND GESTATIONAL
HYPERTENSION
A DISSERTATION SUBMITTED TO THE TAMILNADU Dr M.G.R. MEDICAL UNIVERSITY
IN PARTIAL FULFILLMENT OF THE REGULATIONS FOR THE AWARD OF DEGREE OF
M.D (BRANCH II) OBSTETRICS AND GYNAECOLOGY
COIMBATORE MEDICAL COLLEGE
COIMBATORE-641018
CERTIFICATE
This is to certify that this dissertation entitled “STUDY OF RELATIONSHIP BETWEEN PLASMA HOMOCYSTEINE LEVELS AND
GESTATIONAL HYPERTENSION” is a bonafide work done by
Dr.NIVEDHITHA AARTHY.G under my guidance and supervision in the department of Obstetrics and Gynaecology during the period of her post graduate study at Coimbatore Medical College, Coimbatore for the Degree of M.D. Obstetrics and Gynaecology from 2009-2012.
Dr.R.NALLICHANDRA, M.D.O.G. Dr. M. SUTHANDRA DEVI, M.D., D.G.O.
Assistant Professor, Professor & Head of Department, Dept. of Obstetrics and Dept. of Obstetrics and
Gynaecology, Gynaecology,
Coimbatore Medical College, Coimbatore Medical College Coimbatore. Coimbatore
Prof. Dr. R. VIMALA, M.D.,
Dean,
DECLARATION
I hereby solemnly declare that the dissertation titled “STUDY OF RELATIONSHIP BETWEEN PLASMA HOMOCYSTEINE
LEVELS AND GESTATIONAL HYPERTENSION” has been prepared
by me.
This is submitted to THE TAMILNADU Dr M.G.R.
MEDICAL UNIVERSITY, CHENNAI in partial fulfillment of the
requirements for the award of M.D., Degree examination (Obstetrics and Gynaecology) to be held in April 2012.
Place: Coimbatore
ACKNOWLEDGEMENT
I express my sincere thanks
to
Prof. Dr.R.VIMALA, M.D.,Dean, Coimbatore Medical College, Coimbatore for granting me the permission to use the facilities of the institution and hospital for the study.
I wish to express my sincere gratitude to the Head of department of Obstetrics and Gynaecology, Prof. Dr. M. SUTHANDRA DEVI M.D., DGO., for her able and dynamic guidance, which helped me in completion of this dissertation work.
I express my sincere thanks and gratitude to my institutional Co-Guide Dr. R. NALLICHANDRA, M.D.O.G., Assistant Professor, for her valuable guidance, moral support, constructive criticism and constant encouragement throughout this dissertation work.
I thank all my Associate Professors Dr. P.SUNDARI M.D., DGO., Dr. S. USHA RANI M.D., DGO., DNB., Dr. S. VIJAYA M.D.,
DGO., Dr.T. G. REVATHY M.D., DGO.,and all my Assistant Professors,
I would like to thank all the Post – Graduates in the Department of Obstetrics and Gynaecology, for their kind support for helping me in my dissertation.
I am deeply indebted to my parents Mr. GOPALSAMY and
Mrs.RENUKA GOPALSAMY and my spouse Dr.V.M.VIJAYANANDH
whose support is my biggest asset.
Last but not the least I thank the patients for their kind cooperation in carrying out the study scrupulously and successfully.
CONTENTS
S. No. Title Page
No.
1. INTRODUCTION 1
2. AIMS AND OBJECTIVES 4
3. REVIEW OF LITERATURE 5
4. MATERIALS AND METHODS 38
5. RESULTS AND ANALYSIS 41
6. DISCUSSION 67
7. SUMMARY 73
8.
CONCLUSION 75
10. BIBLIOGRAPHY
11. ANNEXURE
i) PROFORMA
ii) MASTER CHART
STUDY OF RELATIONSHIP BETWEEN PLASMA
HOMOCYSTEINE LEVELS AND GESTATIONAL
HYPERTENSION
KEYWORDS: Homocysteine, Hypertension, Pregnancy.
ABSTRACT:
OBJECTIVE:
To find out the relationship between plasma homocysteine levels
and occurrence of gestational hypertension.
METHODS:
A case control study with 50 cases who were postnatal patients with
gestational hypertension and 61 controls who were postnatal patients with
uncomplicated obstetric histories. Of the 50 cases, 16 had gestational hypertension,
26 had preeclampsia and 8 had Eclampsia. Plasma homocysteine was determined
by Chemi luminescence immunoassay method. For statistical analysis chi square
test and the student t test were used. Pearson co-relation coefficient was used to
RESULTS:
Mean Plasma homocysteine levels were found to be
significantly higher in cases compared to controls. Mean Plasma homocysteine
levels in normal mothers was 10.50µmol/L, in mothers with gestational
hypertension was 16.43µmol/L and in preeclampsia was 20.23µmol/L. There was
significant association between positive family history of cardiovascular disease
and gestational hypertension (p<0.001). There was also significant association
between plasma homocysteine and positive family history of cardiovascular
disease (p<0.05). Significant association existed between plasma homocysteine
levels and gestational hypertension (p<0.001). Plasma homocysteine levels in
preeclampsia are higher than that in gestational hypertension (p<0.001). Positive
correlation was found between plasma homocysteine levels and Mean Arterial
Pressure (r=0.447, p=0.000), Systolic Blood Pressure (r=0.559, p=0.000) and
Diastolic Blood Pressure (r=0.334, p=0.000).
CONCLUSION:
A
relationship exists between plasma homocysteine levels and gestational hypertension. Higher levels of plasma homocysteine levels are foundin women with gestational hypertension compared to normotensive pregnant
INTRODUCTION
Hypertensive disorders represent the most common medical complication of pregnancy with a reported incidence between 5 and 10 percent. The term hypertension in pregnancy is commonly used to describe a wide spectrum of patients who may have only mild elevations in blood pressure or severe hypertension with various organ dysfunctions.
The three most common forms of hypertension are gestational hypertension, preeclampsia and chronic essential hypertension.
Hypertensive disorders together with haemorrhage and infection form a deadly triad that contribute greatly to maternal morbidity and mortality. In India it accounts for 24% of all maternal deaths. Among the three leading causes of the maternal death, Hypertensive disorders top the list. It is also a major cause of preterm birth, intrauterine growth restriction and perinatal mortality.
problems in Obstetrics. The risk factors are still not well understood, so there is lack of sensitive tests.
Recent research also reveals that many changes precede any increase in BP and though the symptoms and signs usually become apparent in the third trimester, the underlying pathophysiological mechanisms appear between 8-18 weeks of gestation.
Endothelial damage has been implicated in the etiology of gestational hypertension. Homocysteine is a non protein sulphur containing aminoacid which is notorious for causing endothelial damage. It has been proved that homocysteine has a definite role in the setting of coronary artery disease, peripheral arterial disease, Cerebrovascular disease, DVT and Neural tube defects.
The incidence of gestational hypertension is high about 15% to 18% in Coimbatore. The reason could be its unique climate because of the
AIMS AND OBJECTIVES
Aims:
This study is designed to find out the relationship between plasma homocysteine levels and occurrence of gestational hypertension.
Objectives:
To measure plasma homocysteine levels in normotensive and gestational hypertension patients.
To compare plasma homocysteine levels in both the groups.
To establish a relationship between plasma homocysteine and gestational hypertension.
REVIEW OF LITERATURE
GESTATIONAL HYPERTENSION
HISTORICAL PERSPECTIVE
Gestational hypertension contributes to the ancient times. Eclampsia was identified by the pre Hippocratic Kahun papyrus from Egypt 3000 years back. PIH was recognized by ancient Greeks. They believed that in pregnant women, the appearance of heaviness, drowsiness and headaches is not a good sign and that they have the possibility to develop some kinds of seizures.
Galen’s commentary on Hippocrates aphorisms recommends that he was familiar with the aggressive features in pregnant women1, 2.
Technical description on PIH actually started indirectly in 17th century. The term eclampsia appeared in a treatise on Gynaecology written by Varandaeus in 1619. It was coined by Hippocrates, meaning flash1, 35, 42.
Blundell, Mauriceau and Bartonand, all these three have documented the signs of PIH. In the year 1840, Rayer detected protein in urine of three pregnant women with edema who had PIH. Old time practitioners of medicine though crude by today’s standard, had documented raised blood pressure in women with PIH by examining their stiff bounding pulses.
In 1884, Vinay used ancient sphygmomanometer to measure BP. Further research was conducted in the ensuing years and now it is at the current scenario.
TERMINOLOGY & CLASSIFICATION
The term gestational hypertension was chosen by Dr. Jack Pritchard to describe any new onset uncomplicated hypertension during pregnancy when no evidence of the preeclampsia syndrome was apparent.
The working group classification of hypertensive disorders complicating pregnancy describes four types of hypertensive disease3:
1. Gestational Hypertension- Formerly termed pregnancy induced Hypertension. If preeclampsia syndrome does not develop and hypertension resolves by 12 weeks postpartum, it is redesignated as transient hypertension.
2. Preeclampsia & eclampsia syndrome
3. Preeclampsia syndrome superimposed on chronic hypertension 4. Chronic hypertension
An important feature of this classification is differentiating preeclampsia & eclampsia from other hypertensive disorders because former two are potentially more ominous.
Gestational Hypertension:
No proteinuria
BP returns to normal before 12 weeks postpartum
Final diagnosis made only postpartum
May have other signs & symptoms of preeclampsia. For example epigastric discomfort, thrombocytopenia 3,6,11.
Preeclampsia
Minimum criteria
BP>140/90mmHg after 20 weeks gestation, proteinuria > 300mg/24hours or > 1+ dipstick.
Increased certainty of preeclampsia:
BP > 160/110mmHg
Proteinuria 2.0g/24hours or > 2+ dipstick
Serum creatinine >1.2mg/dl unless known to be previously elevated
Platelets <1,00,000/µl
Microangiopathic hemolysis – increased LDH
Elevated serum transaminase levels-ALT\AST
Persistent headache or other cerebral or visual disturbance.
Preeclampsia is best described as a pregnancy specific syndrome that can affect virtually every organ system.
Some women may have a typical preeclampsia with all aspects of syndrome but without hypertension or proteinuria or both11,12,14.
Indicators of severity of Gestational Hypertensive disorders. Abnormality Non severe Severe
Diastolic BP <110mm Hg >110mm Hg
Systolic BP <160mm Hg >160mm Hg
Proteinuria <2+ >3+
Headache Absent Present
Visual disturbances Absent Present
Upper Abdominal Pain Absent Present
Oliguria Absent Present
Convulsion Absent Present
Thrombocytopenia Absent Present
Serum Transaminase elevation
Minimal Marked
Fetal growth restriction Absent Obvious
Pulmonary Edema Absent Present
The differentiation between non severe & severe gestational hypertension or preeclampsia can be misleading because what might be apparently mild disease may progress rapidly to severe disease.
ECLAMPSIA
SUPERIMPOSED PREECLAMPSIA ON CHRONIC
HYPERTENSION:
New onset proteinuria >300mg/24hours in hypertensive women but no proteinuria before 20 weeks gestation.
A sudden increase in proteinuria or blood pressure or platelet count <1,00,000/µl in woman with hypertension & proteinuria before 20 weeks gestation.
CHRONIC HYPERTENSION
BP>140/90mm Hg before pregnancy or diagnosed before 20 weeks gestation not attributable to gestational trophoblastic disease.
(or)
RISK FACTORS FOR HYPERTENSIVE DISORDERS IN
PREGNANCY20,21:
Genetic Factors:
Genetic pre-disposition
Race & ethnicity- more common in Blacks & Asians
Family History of preeclampsia
Pregnancy by ovum donation
Age and parity:
Teenage pregnancy
Age more than 40 years
Long interval between pregnancies
Nulliparity
Partner related factors:
Change of partner
Partner who fathered a pre-eclamptic pregnancy in another woman
Pregnancy due to donor insemination
Presence of underlying disorder:
Chronic hypertension
Diabetes mellitus
Renal disease
Obesity (body mass index > 35kg/m2)
Maternal low birth weight
Polycystic ovarian syndrome
Migraine
Collagen vascular disorders
Uncontrolled hyperthyroidism
Factor V Leiden deficiency
Activated protein C deficiency
Thrombophilia
Sickle cell disease & other hemoglobinopathies
Antiphospholipid antibodies
HYPERHOMOCYSTEINEMIA
Protein S deficiency
Women with excessive snoring
Pregnancy related risk factor:
Multiple pregnancies
Hydatidiform mole
Hydrops fetalis
Congenital & chromosomal fetal anomalies ( Trisomy 13 and Triploidy)
Urinary tract infection
Miscellaneous factors
Smoking (reduced risk)
Psychological strain & stress at work place
Previous history of preeclampsia
PATHOGENESIS
Hypertensive disorder of pregnancy continues to be a disease of theories & no one theory can explain its etiopathogenesis probably more than one theory works. As Boyd stated it remains
“die krankheit der theorien “
– The disease of theories.
Any satisfactory theory must account for the observation that gestational hypertensive disorders are more likely to develop in women who 42
Are exposed to chorionic villi for the first time
Are exposed to super abundance of chorionic villi
Have preexisting renal or cardio vascular disease
Are genetically predisposed to hypertension developing during pregnancy
cascade of events that lead to preeclampsia syndrome are characterized by a host of abnormalities that result in endothelial damage, vasospasm, transudation of plasma, ischemic & thrombotic sequeale4,5.
INFLAMMATION
Pregnancy imposes a substantial systemic inflammatory stress on all pregnant women in the second half of pregnancy. The inflammatory stimulus may arise from debris shed into maternal circulation from the syncytiotrophoblast which if excessive may signal danger to the maternal innate immune system8,10.
The two stage model of preeclampsia envisages that preeclampsia arises in various ways including from placental ischemia reperfusion injury secondary to deficient placentation. Poor placentation defines the first stage which would appear to have a different origin. The first stage decidual immune response account for the primipaternity & possible partner specificity of preeclampsia 4, 5.
THE TWO STAGES OF PRE-ECLAMPSIA
sFlt-1 and other syncytiotrophoblast derived factors
Stage 2 Second half of pregnancy
No symptoms Stage 1 First half of
pregnancy
Poor
Placentation
Overt pre-eclampsia Placental oxidative stress
and inflammation
Maternal systemic inflammatory stress
Clinical signs of
TWO STAGE THEORY OF PRE-ECLAMPSIA
PLACENTAL MATERNAL
PRE-ECLAMPSIA PRE-ECLAMPSIA
High
ABNORMAL NORMAL PLACENTA PLACENTA
Intensity of
NORMAL systemic
PREGNANCY inflammatory PREGNANCY
Response
(Chronic systemic NON- Inflammation)
PREGNANCY
Low
ENDOTHELIAL CELL ACTIVATION
The endothelium is one of the key organs involved in the pathophysiology of preeclampsia as evidenced by the prostacyclin (PGI2) thromboxane (TXA2) imbalance, impairment of nitric oxide – cyclic guanosine monophosphate pathway & series of markers indicating endothelial activation. Glomerular endotheliosis but also ultrastructural changes in the placental bed & uterine boundary vessels, provides morphologic evidence of endothelial cell injury.
IMPAIRED CYTOTROPHOBLAST INVASION IN SPIRAL ARTERIES
In normal pregnancies endovascular cytotrophoblasts replace endothelial cells in the spiral arteries, this invasion results in destruction of the medial elastic, muscular & neural tissue. These so called physiologic changes normally reach the inner third of the myometrium.
Uterine natural killer (NK) cells produce a series of cytokines involved in angiogenesis and vascular stability including vascular endothelial growth factor (VEGF),placental growth factor (PLGF) and angiopoietin 2 and play a pivotal role in regulating trophoblastic invasion & maternal placental bed vascular changes7,9,23,24,40.
PRO AND ANTIANGIOGENIC PROTEINS
VEGF & PLGF induce vasodilator autacoids including NO & PGI2 in endothelial cells & play a major role in pregnancy associated vasodilation & increase in GFR. VEGF &PLGF are produced by villous, extravillous CTB, STB & decidual leucocytes. The receptors for VEGF fms like tyrosine kinase – 1& kinase insert domain containing receptors are both expressed on human trophoblast in addition to endothelial cells32,34,35,47. VEGF is upregulated by hypoxia & provide an important mechanism through which the placenta develops according to metabolic requirements. PLGF is downregulated by hypoxia. sFlt-1, a soluble version of VEGF receptor generated by alternative splicing of Flt-1 gene is a major endogenous angiogenesis inhibitor because it retains the ability to bind to VEGF & PLGF while preventing VEGF & PLGF binding to cell surface receptors. The subsequent deficiency of free VEGF & PLGF leads to a state of endothelial dysfunction48,49,53.
A novel soluble form of endoglin of placental origin present in sera of pregnant women is elevated in preeclampsia & amplifies endothelial dysfunction. A recent development was discovery of sFlt-1433,39.
IMMUNOLOGICAL BASIS
The invasion of trophoblast into the deciduas & myometrium appears to be primarily controlled by immune mechanisms. STB do not express HLA antigen. CTB expresses HLA-G & HLA-E. It was thought that HLA-G offered maternal tolerance to fetus through failing to be perceived as foreign while still protecting from NK cell mediated cytotoxicity34.
Decidua predominantly contains NK cells. NK cells express inhibitory and activatory killer cell immunoglobulin like receptors (KIRS) capable of recognizing HLA class I molecules. All women express KIRs on decidual NK cells for HLA-C alleles & because HLA-C is polymorphic, each pregnancy will involve different combinations of paternally derived fetal HLA-C & maternal KIRs .Therefore each pregnancy is based on a unique couple specific immune interaction not necessarily involving T cells but NK cells interacting with paternal HLA. Mothers belonging to HLA-C2 group & lacking most or all activating KIRs when fetus has HLA-C are at risk of preeclampsia53.
Regulatory T cells are also involved in specific immune tolerance. Sexual intercourse provokes a cascade of inflammatory response. TGF-beta 1 is the critical seminal factor which initiates a type 2 immune response. This prevents the induction of type 1 response against semiallogenic conceptus that are associated with poor placental & fetal development35,39.
PLACENTAL ISCHEMIA/ PLACENTAL DEBRIS HYPOTHESIS
Increased deportation of placental tissue in future preeclamptics is already detectable at 16 to 18 weeks. The increased STB deportation is explained by the presence of syncytial sprouds that may be elongated on long pedicles. Apoptosis plays a central role in the formation of STB from underlying villous CTB. Apoptosis is increased in preeclampsia.
GENETIC CONFLICT HYPOTHESIS
According to Haigs genetic conflict theory fetal genes will be selected to increase the transfer of nutrients to the fetus and maternal genes will be selected to limit transfers. Genomic imprinting means that within fetal cells a similar conflict exists between genes that are maternally derived & genes that are paternally derived28,30. Placental factors (fetal genes) will act to increase maternal BP whereas maternal factors will act to reduce BP. This theory predicts that fetal genes will enhance flow of maternal blood through the intervillous space by increasing maternal BP (perfusion pressure)51,52,53.
PREDICTION OF HYPERTENSION IN PREGNANCY
A review of world literature reveals that more than 100 clinical, biophysical & biochemical tests have been recommended to predict or identify the patient at risk. The results of the pooled data for the various tests & the lack of agreement between serial tests suggest that none of these clinical tests is sufficiently reliable for use as screening.
The biochemical markers were generally chosen on the basis of specific pathophysiologic abnormalities that cause preeclampsia. Hence markers of placental dysfunction, endothelial & coagulation activation, angiogenesis & systemic inflammation are used. The research in this aspect is still going on27,31,32.
PREVENTIVE ASPECTS
HOMOCYSTEINE
Homocysteine is a non protein sulphur containing amino acid with the formula HSCH2 CH2 CH (NH2) CO2H.
Homologue of the amino acid cysteine differing by an additional methylene group.
It is biosynthesized from methionine by removal of terminal C methyl group
It can be recycled into methionine or converted to cysteine.
It exists at neutral PH values as zwitterions55,56.
BIOSYNTHESIS & BIOCHEMICAL ROLES
Homocysteine is not obtained from the diet. Instead it is biosynthesized from methionine in a multiple step process. First methionine receives an adenosine group from ATP, a reaction catalyzed by adenosyl methionine synthetase to give rise to s-adenosyl methionine. SAM then transfers the methyl group to an acceptor molecule. The adenosine is then hydrolyzed to yield L-Homocysteine .L- Homocysteine has two primary fates.
BIOSYNTHESIS OF CYSTEINE
Mammals biosynthesis the amino acid cysteine via Homocysteine. Cystathionine beta synthase catalyses the condensation of Homocysteine & serine to give Cystathionine. This reaction uses pyridoxine (vit B6) as a cofactor. Cystathionine beta lyase then converts this double amino acid to cysteine, ammonia & alpha ketobutyrate.
METHIONOINE SALVAGE
Homocysteine is remethylated by methyl tetrahydrofolate catalyzed by methionine synthase, a vitamin B12 dependent enzyme.
FOLATE TRAP
As depicted above the enzyme MTHFR is essential to convert 5, 10, methylene THF to methyl THF which is essential for conversion of homocysteine into methionine.
FOLATE TRAP
As depicted above the enzyme MTHFR is essential to convert 5, 10, methylene THF to methyl THF which is essential for conversion of homocysteine into methionine.
RISKS OF HYPERHOMOCYSTEINEMIA
Homocysteine degrades & inhibits the formation of the three main structural components of the artery- collagen, elastin and proteoglycans. It permanently degrades cysteine disulphide bridges & lysine amino acid residues in proteins gradually affecting function and structure. Simply put it is a ‘corrosive’ of long living proteins. It is linked to high concentrations of endothelial asymmetric dimethylarginine which causes endothelial dysfunction 22,26.
peripheral arterial disease, DVT, neural tube defects in fetus and preeclampsia57,58.
HYPERHOMOCYSTEINEMIA
Elevations of Homocysteine are associated with defects in 3 genes
1. Cystathionine Beta synthase 2. MTHFR
3. Methionine synthase
Of these the first two are clinically important. CBS gene defects leads to hyperhomocysteinemia & homocystinuria. MTHFR gene defects lead only to hyperhomocysteinemia. Heterozygotes do not have any manifestations. Homozygotes have clinical manifestations. The thermolabile variant of MTHFR is quite common.
higher in serum than in plasma, in men than in women, in women on HRT/OCP, in elderly persons55,56.
PLASMA HOMOCYSTEINE LEVELS
NORMAL - 5-15 µmol/L
HYPERHOMOCYSTEINEMIA
MILD - 15-25 µmol/L MODERATE - 25-50 µmol/L SEVERE - >50 µmol/L
degree of PIH. Higher levels of Homocysteine statistically significant were present in all risk groups.
Steegers Theunissen et al 68 (2004) conducted a study to assess associations between vitamin dependent Homocysteine metabolism and vascular related pregnancy complications by considering interval between delivery and postpartum investigation and maternal age. It was found hyperhomocysteinemia was associated with an approximately 2 fold to 3 fold increased risk for PIH, abruption & IUGR. Cobalamin deficiency was associated with HELLP syndrome, abruptio placenta, IUGR & IUD. Pyridoxal 5 phosphate deficiency increased risk of PIH. These associations lost the significance after adjustment for time interval & maternal age. High red cell folate was associated with a decreased risk for abruptio placentae and IUGR. An increased creatinine concentration was associated with PIH, preeclampsia, HELLP & abruption.
that plasma homocysteine significantly increased in early onset severe preeclampsia and it might contribute in the pathophysiology of the disease
Vincent et al71 (2009) conducted a study in Nigeria. A total of 150 subjects consisting of 100 primigravidae & 25 diagnosed cases of pre-eclampsia/eclampsia and 25 non pregnant females were enrolled in the study. There was positive and significant correlation between plasma homocysteine in the eclamptic group & mean MCV & between plasma homocysteine, systolic & diastolic blood pressure of the eclamptic group.
Raijmakers et al63(2001) investigated the role of Hyperhomocysteinemia in preeclampsia by measuring plasma levels of homocysteine and studying the prevalence of 677(C->T) polymorphism in the 5-10 MTHFR gene. Plasma samples of 10 healthy non pregnant women, 10 normotensive pregnant women & 20 women with preeclampsia were analysed for homocysteine levels.
healthy non pregnant controls .Women with preeclampsia showed higher concentration of homocysteine. There was no difference in 677(C->T) polymorphism in preeclampsia and normal women.
Powers et al64 (2001) conducted a study to confirm that endothelial dysfunction is present in preeclampsia and absent in transient hypertension of pregnancy & to determine whether homocysteine is associated with the degree of endothelial dysfunction in 17 women with preeclampsia, 16 women with transient hypertension of pregnancy & 34 normal pregnant women. It was concluded that cellular fibronectin was found to be significantly increased in women with preeclampsia compared to subjects with transient hypertension of pregnancy or normal pregnant women. Similarly plasma homocysteine was also significantly increased in women with preeclampsia compared to others. There was no apparent association between cellular fibronectin and homocysteine.
with preeclampsia. There was no association between low vitamin B12 levels and preeclampsia.
MATERIALS AND METHODS
Our study was a case control study. The cases of our study were postnatal patients who had gestational hypertension. The controls were postnatal patients who were comparable with the patients’ groups with regard to social class, geographical area and age. They were friends or acquaintances of the patients and had uncomplicated pregnancies.
From October 2009 to November 2010 our study was conducted in the department of Obstetrics and Gynaecology, Coimbatore medical college hospital, Coimbatore on 111 patients. Gestational hypertension was defined as systolic BP> 140mm Hg & diastolic BP> 90mm Hg detected for the first time during pregnancy after 20 weeks of gestation. Preeclampsia was defined as gestational hypertension with proteinuria. Eclampsia defined as seizures that cannot be attributed to other causes in a woman with preeclampsia. Proteinuria is defined as >1+ dipstick.
For the measurement of BP, conventional sphygmomanometer was used. BP was measured after it was made sure that the women were relaxed & resting for at least half an hour before blood pressure measurement. It was measured in the sitting position with the forearm horizontal & well supported and the upper arm at the level of the heart. The cuff was long enough to encircle the arm and wide enough to cover at least two thirds of the upper arm. The disappearance of korotkoff phase V was used to define diastolic pressure. Two measurements at least 6 hours apart were taken. Mean arterial pressure is defined as systolic BP + 2/3 diastolic BP.
All participants were explained about the study and consent was obtained. After exclusion of users of vitamin B, folic acid, pharmacologic agents, restricted diets, women with disorder like chronic hypertension, diabetes mellitus, gastrointestinal, endocrine disorder, twin pregnancies, the study group consisted of 50 cases & 61 controls. Of the cases 16 had gestational hypertension, 26 had preeclampsia and 8 had Eclampsia. Controls had uncomplicated obstetric histories. The participants were subjected to detailed history elicitation & physical examination.
DISTRIBUTION OF SYSTOLIC BLOOD PRESSURE
BETWEEN NORMAL MOTHERS AND MOTHERS WITH
GESTATIONAL HYPERTENSION
The figure shows that mean SBP in normal mother 119.67mmHg, in mothers with gestational hypertension is 139.38mmHg, in preeclampsia is 151.69mmHg and in Eclampsia is 169.25mmHg.
0 20 40 60 80 100 120 140 160 180 Normal
Mothers Mothers with Gestational Hypertension
FIGURE-1
DISTRIBUTION OF SYSTOLIC BLOOD PRESSURE
BETWEEN NORMAL MOTHERS AND MOTHERS WITH
GESTATIONAL HYPERTENSION
The figure shows that mean SBP in normal mother 119.67mmHg, in mothers with gestational hypertension is 139.38mmHg, in preeclampsia is 151.69mmHg and in Eclampsia is 169.25mmHg.
Mothers with Gestational Hypertension Pre-Eclampsia Eclampsia
SBP
SBPDISTRIBUTION OF SYSTOLIC BLOOD PRESSURE
BETWEEN NORMAL MOTHERS AND MOTHERS WITH
The figure shows that mean SBP in normal mothers is 119.67mmHg, in mothers with gestational hypertension is 139.38mmHg, in
DISTRIBUTION OF DIASTOLIC BLOOD PRESSURE
BETWEEN NORMAL MOTHERS AND MOTHERS WITH
GESTATIONAL HYPERTENSION
The figure shows that mean DBP in normal mothers is 80.16 mmHg, in mothers with gestational hypertension is 98.13 mmH preeclampsia is 98.38 mmHg and in Eclampsia is 107.75 mmHg.
0 20 40 60 80 100 120
Normal Mothers Mothers with Gestational Hypertension
FIGURE-2
ISTRIBUTION OF DIASTOLIC BLOOD PRESSURE
BETWEEN NORMAL MOTHERS AND MOTHERS WITH
GESTATIONAL HYPERTENSION
The figure shows that mean DBP in normal mothers is 80.16 mmHg, in mothers with gestational hypertension is 98.13 mmH preeclampsia is 98.38 mmHg and in Eclampsia is 107.75 mmHg.
Mothers with Gestational Hypertension
Pre-Eclampsia Eclampsia
DBP
ISTRIBUTION OF DIASTOLIC BLOOD PRESSURE
BETWEEN NORMAL MOTHERS AND MOTHERS WITH
The figure shows that mean DBP in normal mothers is 80.16 mmHg, in mothers with gestational hypertension is 98.13 mmHg, in
DISTRIBUTION OF MEAN ARTERIAL PRESSURE
BETWEEN NORMAL MOTHERS AND MOTHERS WITH
GESTATIONAL HYPERTENSION
The figure shows that mean M
mmHg, in mothers with gestational hypertension is 111.88 mmHg, in preeclampsia is 118.72 mmHg and in Eclampsia is 128.25mmHg.
0 20 40 60 80 100 120 140 Normal
Mothers Mothers with Gestational Hypertension
Mean Arterial Pressure
FIGURE-3DISTRIBUTION OF MEAN ARTERIAL PRESSURE
BETWEEN NORMAL MOTHERS AND MOTHERS WITH
GESTATIONAL HYPERTENSION
The figure shows that mean MAP in normal mothers is 93.33 mmHg, in mothers with gestational hypertension is 111.88 mmHg, in preeclampsia is 118.72 mmHg and in Eclampsia is 128.25mmHg.
Mothers with Gestational Hypertension
Pre-Eclampsia Eclampsia
Mean Arterial Pressure
Mean Arterial Pressure
DISTRIBUTION OF MEAN ARTERIAL PRESSURE
BETWEEN NORMAL MOTHERS AND MOTHERS WITH
AP in normal mothers is 93.33 mmHg, in mothers with gestational hypertension is 111.88 mmHg, in preeclampsia is 118.72 mmHg and in Eclampsia is 128.25mmHg.
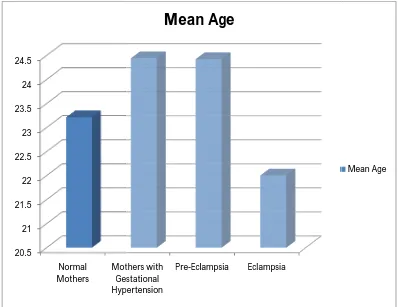
DISTRIBUTION OF AGE BETWEEN NORMAL MOTHERS
AND MOTHERS WITH GESTATIONAL HYPERTENSION
The figure shows that mean age in normal mothers is 23.21 years, in mothers with gestational hypertension is 24.44 years, in preeclampsia is 24.42 years and in Eclampsia is 22 years
20.5 21 21.5 22 22.5 23 23.5 24 24.5 Normal
Mothers Mothers with Gestational Hypertension
FIGURE-4
DISTRIBUTION OF AGE BETWEEN NORMAL MOTHERS
AND MOTHERS WITH GESTATIONAL HYPERTENSION
The figure shows that mean age in normal mothers is 23.21 years, in mothers with gestational hypertension is 24.44 years, in preeclampsia is 24.42 years and in Eclampsia is 22 years
Mothers with Gestational Hypertension
Pre-Eclampsia Eclampsia
Mean Age
DISTRIBUTION OF AGE BETWEEN NORMAL MOTHERS
AND MOTHERS WITH GESTATIONAL HYPERTENSION
The figure shows that mean age in normal mothers is 23.21 years, in mothers with gestational hypertension is 24.44 years, in
DISTRIBUTION OF PLASMA HOMOCYSTEINE
BETWEEN NORMAL MOTHERS AND MOTHERS WITH
GESTATIONAL HYPERTENSION
The figure shows that mean plasma homocysteine in normal mothers is 10.50µmol/L, in mothers with gestational hyperten
16.43µmol/L, in preeclampsia is 20.23µmol/L and in Eclampsia is 20.10µmol/L. 0 5 10 15 20 25 Normal
Mothers Mothers with Gestational Hypertension
Plasma Homocysteine
FIGURE-5ON OF PLASMA HOMOCYSTEINE
BETWEEN NORMAL MOTHERS AND MOTHERS WITH
GESTATIONAL HYPERTENSION
The figure shows that mean plasma homocysteine in normal mothers is 10.50µmol/L, in mothers with gestational hyperten
16.43µmol/L, in preeclampsia is 20.23µmol/L and in Eclampsia is Mothers with Gestational Hypertension Pre-Eclampsia Eclampsia
Plasma Homocysteine
Plasma HomocysteineON OF PLASMA HOMOCYSTEINE
BETWEEN NORMAL MOTHERS AND MOTHERS WITH
The figure shows that mean plasma homocysteine in normal mothers is 10.50µmol/L, in mothers with gestational hypertension is 16.43µmol/L, in preeclampsia is 20.23µmol/L and in Eclampsia is
FIGURE-6
DISTRIBUTION OF AGE
It is inferred from the figure that of the total 111 participants 84 of them are in the age group < 25 years, 22 of them are in the age group between 25-30 years and 5 of them are in the age group above 30 years.
No. of Mothers
Less than 25 years
Between 25 - 30 years
ASSOCIATION BETWEEN FAMILY HISTORY OF
CARDIOVASCULAR DISEASE AND GESTATIONAL
The figure depicts that positive family history of cardiovascular disease is found more in mothers with gestational hypertension, preeclampsia and Eclampsia than in normal mothers.
0 10 20 30 40 50 60 70 Normal Mothers Mothers with Gestational Hypertension FIGURE-7
ASSOCIATION BETWEEN FAMILY HISTORY OF
CARDIOVASCULAR DISEASE AND GESTATIONAL
HYPERTENSION
figure depicts that positive family history of cardiovascular disease is found more in mothers with gestational hypertension, preeclampsia and Eclampsia than in normal mothers.
Mothers with Gestational Hypertension
Pre-Eclampsia Eclampsia
ASSOCIATION BETWEEN FAMILY HISTORY OF
CARDIOVASCULAR DISEASE AND GESTATIONAL
figure depicts that positive family history of cardiovascular disease is found more in mothers with gestational hypertension,
TABLE-1
The table shows the minimum, maximum, mean and standard deviation values of all variables.
DESCRIPTIVE STATISTICS
111 18 38 23.59 3.602 111 110 180 133.59 17.666 111 70 130 89.01 15.523 111 83.33 176.67 104.4685 15.07492 111 1.40 3.70 2.8080 .34712 111 6 54 14.32 7.899 111
Age SBP DBP
Mean Arterial Pressure Birth Weight of Child P.Homocysteine Valid N (list wise)
TABLE-2
ASSOCIATION BETWEEN AGE AND GESTATIONAL
HYPERTENSION
The Chi square value of age and gestational hypertension is 5.160 and p= 0.523, so it can be inferred that there is no association between the two.
48 11 18 7 84
57.1% 13.1% 21.4% 8.3% 100.0%
78.7% 68.8% 69.2% 87.5% 75.7%
12 3 6 1 22
54.5% 13.6% 27.3% 4.5% 100.0%
19.7% 18.8% 23.1% 12.5% 19.8%
1 2 2 0 5
20.0% 40.0% 40.0% .0% 100.0%
1.6% 12.5% 7.7% .0% 4.5%
61 16 26 8 111
55.0% 14.4% 23.4% 7.2% 100.0%
100.0% 100.0% 100.0% 100.0% 100.0%
Count % within Age % within Diagnosis Count
% within Age % within Diagnosis Count
% within Age % within Diagnosis Count
% within Age % within Diagnosis Less than 25 years
Between 25 - 30 years
TABLE-3
ASSOCIATION BETWEEN PARITY AND GESTATIONAL
HYPERTENSION
The Chi square value of parity and gestational hypertension is 11.713 and p= 0.230, so it can be inferred that there is no association between the two.
32 11 16 7 66 48.5% 16.7% 24.2% 10.6% 100.0% 52.5% 68.8% 61.5% 87.5% 59.5%
25 5 5 1 36
69.4% 13.9% 13.9% 2.8% 100.0% 41.0% 31.3% 19.2% 12.5% 32.4%
3 0 4 0 7
42.9% .0% 57.1% .0% 100.0% 4.9% .0% 15.4% .0% 6.3%
1 0 1 0 2
50.0% .0% 50.0% .0% 100.0% 1.6% .0% 3.8% .0% 1.8%
61 16 26 8 111 55.0% 14.4% 23.4% 7.2% 100.0% 100.0% 100.0% 100.0% 100.0% 100.0% Count
% within Parity % within Diagnosis Count
% within Parity % within Diagnosis Count
% within Parity % within Diagnosis Count
% within Parity % within Diagnosis Count
TABLE-4
ASSOCIATION BETWEEN No. OF LIVE BIRTHS AND
GESTATIONAL HYPERTENSION
The Chi square value of no of live births and gestational hypertension is 23.286 and p< 0.05, so it can be inferred that there is an association between the two.
0 3 1 2 6
.0% 50.0% 16.7% 33.3% 100.0% .0% 18.8% 3.8% 25.0% 5.4%
33 7 17 5 62
53.2% 11.3% 27.4% 8.1% 100.0% 54.1% 43.8% 65.4% 62.5% 55.9%
24 4 4 1 33
72.7% 12.1% 12.1% 3.0% 100.0% 39.3% 25.0% 15.4% 12.5% 29.7%
3 2 3 0 8
37.5% 25.0% 37.5% .0% 100.0% 4.9% 12.5% 11.5% .0% 7.2%
1 0 1 0 2
50.0% .0% 50.0% .0% 100.0% 1.6% .0% 3.8% .0% 1.8%
61 16 26 8 111 55.0% 14.4% 23.4% 7.2% 100.0% 100.0% 100.0% 100.0% 100.0% 100.0% Count
% within Live % within Diagnosis Count
% within Live % within Diagnosis Count
% within Live % within Diagnosis Count
% within Live % within Diagnosis Count
% within Live % within Diagnosis Count
TABLE-5
ASSOCIATION BETWEEN No. OF ABORTIONS AND
GESTATIONAL HYPERTENSION
The Chi square value of no of abortions and gestational hypertension is 6.426 and p= 0.377, so it can be inferred that there is no association between the two.
58 15 21 7 101 57.4% 14.9% 20.8% 6.9% 100.0% 95.1% 93.8% 80.8% 87.5% 91.0%
3 1 4 1 9
33.3% 11.1% 44.4% 11.1% 100.0% 4.9% 6.3% 15.4% 12.5% 8.1%
0 0 1 0 1
.0% .0% 100.0% .0% 100.0% .0% .0% 3.8% .0% .9%
61 16 26 8 111 55.0% 14.4% 23.4% 7.2% 100.0% 100.0% 100.0% 100.0% 100.0% 100.0% Count
% within Abortion % within Diagnosis Count
% within Abortion % within Diagnosis Count
% within Abortion % within Diagnosis Count
TABLE-6
ASSOCIATION BETWEEN MATERNAL BLOOD GROUPS
AND GESTATIONAL HYPERTENSION
The Chi square value of maternal blood groups and gestational hypertension is 10.099 and p= 0.343, so it can be inferred that there is no association between the two.
19 6 8 1 34
55.9% 17.6% 23.5% 2.9% 100.0% 31.1% 37.5% 30.8% 12.5% 30.6%
16 7 8 4 35
45.7% 20.0% 22.9% 11.4% 100.0% 26.2% 43.8% 30.8% 50.0% 31.5%
26 2 9 3 40
65.0% 5.0% 22.5% 7.5% 100.0% 42.6% 12.5% 34.6% 37.5% 36.0%
0 1 1 0 2
.0% 50.0% 50.0% .0% 100.0% .0% 6.3% 3.8% .0% 1.8%
61 16 26 8 111 55.0% 14.4% 23.4% 7.2% 100.0% 100.0% 100.0% 100.0% 100.0% 100.0% Count
% within Blood Group % within Diagnosis Count
% within Blood Group % within Diagnosis Count
% within Blood Group % within Diagnosis Count
% within Blood Group % within Diagnosis Count
TABLE-7
ASSOCIATION BETWEEN FAMILY HISTORY OF
CARDIOVASCULAR DISEASE AND GESTATIONAL
HYPERTENSION
The Chi square value of family history of cardiovascular disease and gestational hypertension is 19.533 and p< 0.001, so it can be inferred that there is an association between the two.
58 13 15 5 91 63.7% 14.3% 16.5% 5.5% 100.0% 95.1% 81.3% 57.7% 62.5% 82.0%
3 3 11 3 20
15.0% 15.0% 55.0% 15.0% 100.0% 4.9% 18.8% 42.3% 37.5% 18.0% 61 16 26 8 111 55.0% 14.4% 23.4% 7.2% 100.0% 100.0% 100.0% 100.0% 100.0% 100.0% Count
% within Family History % within Diagnosis Count
% within Family History % within Diagnosis
Count
TABLE-8
ASSOCIATION BETWEEN SEX OF CHILD AND
GESTATIONAL HYPERTENSION
The Chi square value of sex of child and gestational hypertension is 2.388 and p=0.496, so it can be inferred that there is no association between the two.
33 10 17 3 63 52.4% 15.9% 27.0% 4.8% 100.0% 54.1% 62.5% 65.4% 37.5% 56.8%
28 6 9 5 48
58.3% 12.5% 18.8% 10.4% 100.0% 45.9% 37.5% 34.6% 62.5% 43.2%
61 16 26 8 111 55.0% 14.4% 23.4% 7.2% 100.0% 100.0% 100.0% 100.0% 100.0% 100.0% Count
% within Child Sex % within Diagnosis Count
% within Child Sex % within Diagnosis Count
TABLE-9
ASSOCIATION BETWEEN BIRTH WEIGHT OF CHILD AND
GESTATIONAL HYPERTENSION
The Chi square value of birth weight of child and gestational hypertension is 11.389 and p=0.077, so it can be inferred that there is no association between the two.
19 5 3 0 27
70.4% 18.5% 11.1% .0% 100.0%
31.1% 31.3% 11.5% .0% 24.3%
28 9 20 7 64
43.8% 14.1% 31.3% 10.9% 100.0%
45.9% 56.3% 76.9% 87.5% 57.7%
14 2 3 1 20
70.0% 10.0% 15.0% 5.0% 100.0%
23.0% 12.5% 11.5% 12.5% 18.0%
61 16 26 8 111
55.0% 14.4% 23.4% 7.2% 100.0%
100.0% 100.0% 100.0% 100.0% 100.0%
Count % within Weight % within Diagnosis Count
% within Weight % within Diagnosis Count
% within Weight % within Diagnosis Count
% within Weight % within Diagnosis Less than 2.5 Kg
2.5 - 3 Kg
TABLE-10
ASSOCIATION BETWEEN PLASMA HOMOCYSTEINE AND
GESTATIONAL HYPERTENSION
The Chi square value of plasma homocysteine and gestational hypertension is 40.954 and p<0.001, so it can be inferred that there is an association between the two.
57 8 9 2 76
75.0% 10.5% 11.8% 2.6% 100.0%
93.4% 50.0% 34.6% 25.0% 68.5%
4 8 17 6 35
11.4% 22.9% 48.6% 17.1% 100.0%
6.6% 50.0% 65.4% 75.0% 31.5%
61 16 26 8 111
55.0% 14.4% 23.4% 7.2% 100.0%
100.0% 100.0% 100.0% 100.0% 100.0%
Count
% within Plasma Homocysteine % within Diagnosis Count
% within Plasma Homocysteine % within Diagnosis Count
TABLE-11
CORRELATION BETWEEN FACTORS
**correlation is significant at the 0.01 level
The table depicts the positive correlation between Family history of cardiovascular disease, SBP, DBP, MAP and plasma homocysteine.
Parity Family
History MAP SBP DBP
P.Homocys teine
Parity Pearson correlation(r) Significance(p) N. 1 111 098 .306 111 .042 .663 111 .089 .353 111 .111 .244 111 .010 .919 111 Family History Pearson correlation(r) Significance(p) N. .098 .306 111 1 111 .360** .000 111 438** .000 111 .276** .003 111 .181 .058 111
MAP Pearson correlation(r) Significance(p) N. 042 .663 111 .360** .000 111 1 111 .872** .000 111 .960** .000 111 . .447** .000 111
SBP Pearson correlation(r) Significance(p) N. .089 .353 111 438** .000 111 .872** .000 111 1 111 .701** .000 111 .559** .000 111
[image:73.612.117.486.356.579.2]
TABLE-12
ASSOCIATION BETWEEN AGE AND PLASMA
HOMOCYSTEINE
The chi square value of age and plasma homocysteine is 0.323 and p=0.851, so it can be inferred that there is no association between the two.
57 27 84 67.9% 32.1% 100.0% 75.0% 77.1% 75.7% 15 7 22 68.2% 31.8% 100.0%
19.7% 20.0% 19.8%
4 1 5
80.0% 20.0% 100.0% 5.3% 2.9% 4.5%
76 35 111 68.5% 31.5% 100.0% 100.0% 100.0% 100.0% Count
% within Age % within Plasma Homocysteine Count % within Age % within Plasma Homocysteine
Count % within Age % within Plasma Homocysteine
Count % within Age % within Plasma Homocysteine Less than 25 years
Between 25 - 30 years
Above 30 years Age
Total
Normal Abnormal Plasma Homocysteine
TABLE-13
ASSOCIATION BETWEEN PARITY AND PLASMA
HOMOCYSTEINE
The chi square value of parity and plasma homocysteine is 2.385 and p=0.496, so it can be inferred that there is no association between the two.
43 23 66 65.2% 34.8% 100.0% 56.6% 65.7% 59.5% 27 9 36 75.0% 25.0% 100.0% 35.5% 25.7% 32.4%
4 3 7
57.1% 42.9% 100.0% 5.3% 8.6% 6.3%
2 0 2
100.0% .0% 100.0% 2.6% .0% 1.8% 76 35 111 68.5% 31.5% 100.0% 100.0% 100.0% 100.0% Count
TABLE-14
ASSOCIATION BETWEEN No. OF LIVE BIRTHS AND
PLASMA HOMOCYSTEINE
The chi square value of no of live births and plasma homocysteine is 7.066 and p=0.132, so it can be inferred that there is no association between the two.
3 3 6
50.0% 50.0% 100.0% 3.9% 8.6% 5.4% 42 20 62 67.7% 32.3% 100.0% 55.3% 57.1% 55.9% 26 7 33 78.8% 21.2% 100.0% 34.2% 20.0% 29.7%
3 5 8
37.5% 62.5% 100.0% 3.9% 14.3% 7.2%
2 0 2
100.0% .0% 100.0% 2.6% .0% 1.8% 76 35 111 68.5% 31.5% 100.0% 100.0% 100.0% 100.0% Count
TABLE-15
ASSOCIATION BETWEEN No. OF ABORTIONS AND
PLASMA HOMOCYSTEINE
The chi square value of no of abortions and plasma homocysteine is 3.023 and p=0.221, so it can be inferred that there is no association between the two.
71 30 101 70.3% 29.7% 100.0% 93.4% 85.7% 91.0%
5 4 9
55.6% 44.4% 100.0% 6.6% 11.4% 8.1%
0 1 1
.0% 100.0% 100.0% .0% 2.9% .9%
76 35 111 68.5% 31.5% 100.0% 100.0% 100.0% 100.0% Count
% within Abortion % within Plasma Homocysteine Count
% within Abortion % within Plasma Homocysteine Count
% within Abortion % within Plasma Homocysteine Count
TABLE-16
ASSOCIATION BETWEEN MATERNAL BLOOD GROUPS
AND PLASMA HOMOCYSTEINE
The chi square value of maternal blood groups and plasma homocysteine is 5.360 and p=0.147, so it can be inferred that there is no association between the two.
20 14 34 58.8% 41.2% 100.0% 26.3% 40.0% 30.6% 22 13 35 62.9% 37.1% 100.0% 28.9% 37.1% 31.5% 32 8 40 80.0% 20.0% 100.0% 42.1% 22.9% 36.0%
2 0 2
100.0% .0% 100.0% 2.6% .0% 1.8% 76 35 111 68.5% 31.5% 100.0% 100.0% 100.0% 100.0% Count
% within Blood Group % within Plasma Homocysteine Count
% within Blood Group % within Plasma Homocysteine Count
% within Blood Group % within Plasma Homocysteine Count
% within Blood Group % within Plasma Homocysteine Count
TABLE-17
ASSOCIATION BETWEEN FAMILY HISTORY OF
CARDIOVASCULAR DISEASE AND PLASMA
HOMOCYSTEINE
The chi square value of family history of cardiovascular disease and plasma homocysteine is 3.854 and p<0.05, so it can be inferred that there is an association between the two.
66 25 91 72.5% 27.5% 100.0% 86.8% 71.4% 82.0% 10 10 20 50.0% 50.0% 100.0% 13.2% 28.6% 18.0% 76 35 111 68.5% 31.5% 100.0% 100.0% 100.0% 100.0% Count
% within Family History % within Plasma Homocysteine Count
% within Family History % within Plasma Homocysteine Count
TABLE-18
ASSOCIATION BETWEEN SEX OF CHILD AND PLASMA
HOMOCYSTEINE
The Chi square value of sex of child and plasma homocysteine is 0.127 and p=0.721, so it can be inferred that there is no association between the two.
44 19 63 69.8% 30.2% 100.0% 57.9% 54.3% 56.8% 32 16 48 66.7% 33.3% 100.0% 42.1% 45.7% 43.2% 76 35 111 68.5% 31.5% 100.0% 100.0% 100.0% 100.0% Count
% within Child Sex % within Plasma Homocysteine Count
% within Child Sex % within Plasma Homocysteine Count
TABLE-19
ASSOCIATION BETWEEN BIRTH WEIGHT OF CHILD AND
PLASMA HOMOCYSTEINE
The Chi square value of birth weight of child and plasma homocysteine is 8.093 and p<0.01, so it can be inferred that there is an association between the two.
23 4 27 85.2% 14.8% 100.0% 30.3% 11.4% 24.3% 37 27 64 57.8% 42.2% 100.0% 48.7% 77.1% 57.7% 16 4 20 80.0% 20.0% 100.0% 21.1% 11.4% 18.0% 76 35 111 68.5% 31.5% 100.0% 100.0% 100.0% 100.0% Count
% within Weight % within Plasma Homocysteine Count
% within Weight % within Plasma Homocysteine Count
% within Weight % within Plasma Homocysteine Count
% within Weight % within Plasma Homocysteine Less than 2.5 Kg
2.5 - 3 Kg
Above 3 Kg Weight
Total
Normal Abnormal Plasma Homocysteine
DISCUSSION
Our study was conducted in the Department of Obstetrics and Gynaecology, Coimbatore Medical College hospital ,Coimbatore, of Tamilnadu Dr M.G.R. Medical university with the aim of finding a relationship between plasma homocysteine levels and gestational hypertension with 111 participants.
The results were expressed as means, standard deviation. For groups chi square test and the student t test were used. Pearson co-relation coefficient was used to detect the correlation between different variables. The level of significance was 0.05.
was 151.69mmHg and in Eclampsia was 169.25mmHg as shown in figure-1.The mean DBP in normal mothers was 80.16 mmHg, in mothers with gestational hypertension was 98.13 mmHg, in preeclampsia was 98.38 mmHg and in Eclampsia was 107.75 mmHg as shown in figure-2.
Mean MAP in normal mothers was 93.33 mmHg, in mothers with gestational hypertension was 111.88 mmHg, in preeclampsia was 118.72 mmHg and in Eclampsia was 128.25 mmHg as shown in
figure-3. The mean SBP, DBP& MAP were significantly higher in cases
than in controls.
Mean plasma homocysteine in normal mothers was 10.50µmol/L, in mothers with gestational hypertension was 16.43µmol/L, in preeclampsia was 20.23µmol/L and in Eclampsia was 20.10µmol/L as shown in figure-5. Mean Plasma homocysteine levels were found to be significantly higher in cases compared to controls.
no significant association (p=0.377) between no. of abortions and gestational hypertension as shown in table-5.
There was no significant association between maternal blood group, child’s sex and gestational hypertension (p values 0.496, 0.343 respectively) as seen in tables-6, 8. There was significant association between family history of cardiovascular disease and gestational hypertension (p<0.001) as in table-7. It was found that there was no significant association between the child’s birth weight and gestational hypertension (p=0.077) as shown in table-9. There was a significant association between plasma homocysteine levels and gestational hypertension (p<0.001).
Positive correlation was found between plasma homocysteine levels and MAP(r=0.447, p=0.000), SBP(r=0.559, p=0.000), DBP(r=0.334, p=0.000). There was also positive relationship between family history and MAP, SBP, DBP(r=0.360, p=0.000, r=0.438, p=0.000, r=0.276, p=0.003 respectively) as depicted in table-11.
It was found in the study that there was no significant association between plasma homocysteine levels and age (p=0.851),
child’s sex(p=0.721) and blood group(p=0.147) as seen in tables-12,13,14,15,16&18. There was significant association between plasma homocysteine and positive family history of cardiovascular disease (p<0.05) as shown in table-17.
It was found that there was significant association between plasma homocysteine and birth weight of babies (p<0.01) as depicted in table-19. There was significant association between diagnosis and plasma homocysteine levels (p<0.001) as shown in table-10. It implies that homocysteine levels in preeclampsia are higher than that in gestational hypertension.
Ingec et al in 2005 showed that homocysteine concentration in severe preeclamptic and eclamptic women were significantly higher than mild preeclamptic and normotensive women concluding that elevated plasma homocysteine levels in early pregnancy can increase the risk of developing severe preeclampsia. These results are similar to our study.
Lopez et al in 2003 has results aligning with our study. It was concluded that plasma homocysteine levels in gestation hypertension and preeclampsia were higher than that in normotensive controls.
El abd et al in 2009 conducted a case control study similar to our study which stated that there was a positive correlation between plasma homocysteine levels and SBP, DBP and MAP. It was also found that no significant correlation existed between plasma homocysteine levels and women’s age. It was found that MAP, SBP, DBP were higher in cases than in controls similar to our study.
Raijmaker et al in 2001 concluded in their study that plasma homocysteine levels were higher in preeclampsia and gestational hypertension compared to normotensives. This study is also similar to our study.
Amir et al in 2006 also conducted a case control study along the lines of our study and established that fasting plasma homocysteine levels were higher in cases than in controls.
Vincent et al in 2009 showed that mean homocysteine levels were higher in cases and a significant association existed between plasma homocysteine levels and gestational hypertension. It was also found that higher the homocysteine levels, higher are the SBP and DBP similar to our study.
In our study it has been established that a relationship exists between plasma homocysteine levels and gestational hypertension. Also it has been established that plasma homocysteine is higher if there is positive family history of cardiovascular disease. It was also found that plasma homocysteine levels are higher in preeclampsia than in gestational hypertension.
SUMMARY
A case control study comprising 111 participants with 50 cases and 61 controls was done. Cases were postnatal mothers with gestational hypertension with BP more than 140/90 mmHg. Controls were normotensive women comparable in all aspects. A fasting sample of plasma homocysteine was obtained from all the cases and controls. Plasma homocysteine was measured using the Chemi luminescence immunoassay method.
Thus the study establishes the positive relationship between plasma homocysteine levels and gestational hypertension.
CONCLUSION
VII BIBLIOGRAPHY
1. Thiagarajah P.R. The hypertensive factor in the late toxaemias of pregnancy. Journal of the Ceylon branch of the British medical association. 1943; 40:25-49.
2. Chesley LC.i History and Epidemology of pre-eclampsia- eclampsia. clin obstet & gynecology 1984; 27:801-20
3. Report of the National high blood pressure education program working group on high blood pressure in pregnancy. Am J obstet gynecol. 2000; 183(1):s1-s22.
4. Saudan P, Brown MA ,Buddle ML, Jones M .Does Gestational hypertension become pre-eclampsia?. Br. J obs:et gynecol .1998; 105(11); 1177-84
5. Lain KY ,Roberts JM .contemporary concepts of the pathogenesis and management of preeclampsia. JAMA .2002; 287(24): 3183-6 6. De. Swiet M, Shennan A .Blood pressure measurement in pregnancy.
clin obstet gynecol .2002; 45:22
8. Desai P, Rathod S, Garge V, Mansuri Z. Evaluation of pro-oxidants & antioxidants in pre-eclampsia Jr. O&G India 2003: 53(5), 445-448
9. Sheppard BL, Bonnar J. An ultrastructural study of uteroplacental spiral arteries in hypertensive and normotensive pregnancy and fetal growth retardation. Br J obstet gynecol .88:695-705, 1981
10. Raijmakers MT, Dechend R, Poston L. Oxidative stress & preeclampsia: rationale for antioxidant clinical trials. hypertension 2004;44:374-380
11. Subai BM, Stella CL: Diagnosis and management of atypical preeclampsia-eclampsia. Am J obstet gynecol 200:481. E1-481. E7,2009.
12. American college of obstetricians and gynecologists: diagnosis and management of preeclampsia and eclampsia.
13. The pre-eclampsia community guidelines (PRECOG): how to screen for & detect onset of preeclampsia in the community. british Medical Journal 2005;576-580
15. Dekker GA, Sibai BM .Etiology & pathogenesis of preeclampsia .Am J Obstet gynecol 1998; 179: 1359-1375
16. Roberts JM, Taylor RN ,Musci TJ, Rodgers GM, Hubel CA, McLaughlin MK. Preeclampsia: an endothelial cell disorder .Am J Obslet gynecol. 1989; 161:1200-1204
17. Hubel CA. Oxidative stress in the pathogenesis of pre-eclampsia .Proc soc Exp biol med 1999; 222: 222-235
18. Sharma JB, Mittal S. Oxidative stress and preeclampsia. Am J Obstet gynecol today 2004; IX: 551-554
19. Dekker G, Sibai B. Primary, secondary and tertiary prevention of pre-eclampsia. Lancet .2001; 357:209-215
20. Duley L. Pre-eclampsia and hypertensive disorders of pregnancy. Br Med J 2003; 67:161
21. Duckitt K, Harrington D. Risk factors for preeclampsia at antenatal booking: Systematic review of controlled studies. Br. Med J. 2005 Mar 12; 330(7491):565.
23. Caniggia I, Winter J, Lye SJ, Post M .Oxygen and placental development during the first trimester: implications for the pathophysiology of pre-eclampsia. Placenta 2000 Mar-Apr; 21 suppl A: 525-30
24.Robertson WB, Brosens I, Dixon G. Uteroplacental vascular pathology. Eur J obstet gynecol Reprod Biol 1975; 5:47
25. Manjumdar S, Dasgupta H, Bhattacharya K, Bhattacharya A. A study of placenta in normal & hypertensive pregnancies. J. Anat Soc India 2005; 54(2): 1-9
26.Leeda M, Riyazi N, de Vries JIP, Jokoba C, Van Geijn HP, Dekker GA. Effects of folic acid & vitamin B6 on women with hyperhomocysteinemia and a history of preeclampsia or fetal growth restriction. Am J Obstet gynecol 2000; 96:38-44
27.Conde Agudelo A, Villars J, Lindheimes M .World health organization systematic review of screening tests for preeclampsia .Obstet gynecol 2004; 104:1367-1391.
28. Oudejan CB,Van Dijik M, Oosterkamp M, et al: Genetics of preeclampsia: paradigm shifts. Hum genet 2007; 120: 607-612
30. Sibai BM, Dekker G, Kupferminc M. Preeclampsia .Lancet 2005; 365: 785-799
31.Tjoa ML, Qudyans CBM, Van Vugt JMG, et al: Markers for presymptomatic prediction of preeclampsia & intrauterine growth restriction. Hypertensive pregnancy 23: 171, 2004
32. Widmer M, Villar J ,Benigni A, et al: Mapping the theories of preeclampsia & the role of angiogenic factor. Obstet gynecol 109:168,2007
33. Sargent IL, Germain SJ, Sacks GP, et al: Trophoblast deportation and the maternal inflammatory response in pre-eclampsia. J Reprod immune 59:153, 2003
34.Cunnigham, Leveno, Bloom, Hauth, Rouse, Spong. Williams obstetrics. 23rdedition, USA: Mc Graw Hill; 2010. p-706-748.
35. Gabbe, Niebyl, Simpson. Obstetrics normal & problem pregnancies. 5thedition, Philadelphia: Elsevier; 2007. p-863-906.
36. Sibai BM: Prevention of preeclampsia: A big disappointment. Am J Obstet gynecol 179:1275,1988
38.Shakunthala Chhabra. Hypertensive disorder of pregnancy- An unsolved problem. May 2007; 1-2.
39. James, Steer, Weiner, Gonik, Crowther, Robson. High risk pregnancy- management options. 4th edition, Missouri: Elsevier saunders; 2011. p 599-626.
40. Kong TY, Dewolf F, Robertson WB, Brosens I: Inadequate maternal vascular response to placentation in pregnancies complicated by preeclampsisa & by small for gestational age infants. Br J Obstet gynecol 93:1049;1986
41. Frusca T, Morassil, Pecorell S, et al: Histological features of uteroplacental vessels in normal and hypertensive patients in relation to birthweight. Br J Obstet gynecol 96:835;1989.
42. Renu Misra. Ian Donald’s practical obstetric problems, 6th edition, New Delhi: B1 publications pvt ltd; 207. p280-307
43.Arias, Daftary, Bhide . Practical guide to high risk pregnancy and delivery, 3rdedition, Gurgoan: Elsevier; 2008, p397-436
4