JOURNAL OF VIROLOGY, Nov. 1994,P. 7467-7481 0022-538X/94/$04.00+0
Copyright C 1994, American Society forMicrobiology
Genetic Differences between
Blood- and
Brain-Derived
Viral
Sequences from Human
Immunodeficiency Virus Type
1-Infected Patients: Evidence of
Conserved
Elements
in
the
V3 Region of the
Envelope Protein
of
Brain-Derived
Sequences
BETTET. M. KORBER,"2 KEVIN J. KUNSTMAN,3 BRUCE K. PATTERSON,3 MANOHARFURTADO,3 MIRANDA M. McEVILLY,' ROBERT LEVY,4 ANDSTEVEN M. WOLINSKY3*
Theoretical Biology and Biophysics (T10), TheoryDivision, LosAlamosNational Laboratory, Los Alamos, New Mexico 87545'; SantaFeInstitute, Santa Fe, New Mexico 875012; and
Department of Medicine3 and Department of Neurosurgery,4 Northwestem University University MedicalSchool, Chicago, Illinois 60611
Received4March1994/Accepted 26 July 1994
Humanimmunodeficiencyvirustype1 (HIV-1)sequences weregeneratedfrom blood and from brain tissue obtained by stereotactic biopsy from six patients undergoinga diagnostic neurosurgical procedure. Proviral DNAwasdirectly amplified by nestedPCR,and8to36 clones from each sampleweresequenced.Phylogenetic analysisofintrapatient envelopeV3-V5regionHIV-1DNAsequencesetsrevealed thatbrain viralsequences wereclustered relativetothe blood viralsequences,suggestive oftissue-specificcompartmentalization of the
virusinfourofthesixcases.Inthe othertwocases,thebloodand brainvirussequences wereintermingledin thephylogenetic analyses, suggesting trafficking of virus between thetwotissues. Slide-based PCR-driven in situhybridizationoftwoofthepatients' brain biopsy samples confirmedourinterpretation oftheintrapatient
phylogenetic analyses. Interpatient V3 region brain-derived sequencedistances were significantly less than blood-derivedsequencedistances. Relativetothetip ofthe loop,thesetofbrain-derivedviralsequences had
atendencytowardsnegativeorneutralchargecomparedwith thesetofblood-derivedviralsequences.Entropy
calculationswereusedas a measureof thevariabilityateachposition inalignmentsof bloodandbrain viral sequences.Arelatively conserved setofpositionswerefound, witha significantlylowerentropyin the brain-than in the blood-derived viral sequences. These sites constitute a brain "signature pattern," or a
non-contiguous setofamino acids in the V3 region conserved in viral sequences derived from brain tissue. This brain-derived signaturepattern was also well preserved amongisolates previously characterized in vitro as
macrophage tropic. Macrophage-monocyte tropism may be the biological constraint that results in the conservation of the viral brain signature pattern.
Oneof the devastating complicationsof human immunode-ficiencyvirustype1(HIV-1)infectionis theassociated
impair-mentofneurological function inmanyindividuals. Signsand
symptomsof HIV-1 encephalopathyincludemarked cognitive impairmentinmanyspheresofintellectual functioning,motor abnormalities,and,inchildren,developmental delayor
regres-sion in intellectual and motor milestones (6, 7, 62). In both children andadults,suchencephalopathycanbe duetodirect infection of the brainby HIV-1,asevidencedbythe absence of
secondaryopportunisticinfectionsorneoplasms.
Neuropatho-logical lesions in HIV-1-infected brains include multiple dis-seminatedfoci ofmicroglia, macrophages, andmultinucleated giant cells (encephalitis); diffuse white matter damage with myelin loss, reactive astrogliosis, macrophages, and multinu-cleatedgiantcells(leukoencephalopathy); and diffusereactive astrogliosis and microglial activation with neuronal loss (dif-fusepoliodystrophy) (7, 62).Ultrastructural and in situ hybrid-ization studies have shown that thepredominantcells consis-tently infected by HIV-1 within the brain are microglia and
*Corresponding author. Mailing address: Dept. of Medicine, Northwestern University Medical School, Olson 8427, 710 N.
Fair-banks, Chicago,IL60611. Phone:(312)908-9819. Fax:(312)908-4588. Electronic mail address: [email protected].
macrophages (17, 36, 78), which express the CD4 surface moleculerequiredfor virusbindingtothecell surface(34, 75). HIV-1-specific proteinsand nucleic acidsequenceshaverarely
been detected unambiguously in endothelialcells, astrocytes, oligodendrocytes, or neurons (49, 78). Primary infection of
microglia and macrophages is further supported by
macro-phage tropism of viral isolates derived from the central ner-vous system(CNS) (9, 10, 71, 74).
Data fromanumber of laboratoriessuggestthatsomeofthe moleculardeterminants of cellular tropism aswell as replica-tion efficiency and cytopathicity are localized within the V3 loopofgp120 (11, 13, 23, 33, 64, 76, 77).TheV3loopalsoplays
a role in virus-cell absorption and fusion following gpl20
binding to the CD4 molecule on the target cell surface. Conservation of amino acids at selected positions in the V3 loop has been foundby comparison amongepidemiologically unlinked laboratory-adapted macrophage-tropic strains (2, 3, 24,25).Amino acid substitutions inthe Vi andV2regionsof gp120 (1, 5, 28) and ingp4l (40) alsoinfluence thebiological properties of the virus. In general,thesedata,combinedwith studies of ligand binding affinity and neutralization efficiency (52, 55, 60, 61, 81), suggest that specific combinations of substitutions interspersed throughout the envelope coding region may impose a conformational change in the gpl20
molecule thatcan alter thebiological phenotype of the virus.
7467
Vol. 68, No. 11
on November 9, 2019 by guest
http://jvi.asm.org/
7468 KORBER ET AL.
TABLE 1. CD4 countsanddiagnoses
Patient CD4 count Diagnosis
no. (cells/mm3)Digos
1 39 Lymphoma
2 8 Lymphoma
3 110 Toxoplasmosis
4 124 Progressive multifocalleukoencephalopathy 5 249 Necrotizingencephalitis
6 30 Progressive multifocalleukoencephalopathy (first biopsy); toxoplasmosis and Mycobac-teriumavium-intracellulare(second biopsy)
To analyze genetic patterns in brain- and blood-derived viruses, proviral DNA sequences from six patients were di-rectly amplifiedfromviable,uncultured brainbiopsytissue and comparedwith proviralDNA sequencesfrom simultaneously obtained blood samples. Analysisof these sequences demon-strates that viral sequence heterogeneity exists in different bodycompartmentswithinaninfected individual and supports evidence thatchargeand conformationchangesintheV3loop
may result indifferences in celltropism (23).Acharacteristic "brainsignature pattern"wasidentified in the V3regionbased on particular aminoacidpositionsthatwerehighlyconserved
among brain-derived sequences from the six patients but variable in the blood-derived sequences from the same six patients. This pattern was objectively defined by entropy measurements of aligned amino acid positions. This brain signature pattern, based on samples directly amplified from viabletissue,confirmed and extended the number ofpreviously observed amino acid restrictions associatedwithmacrophage tropism invitro (11, 13, 23, 33, 64, 76, 77).
MATERIALS AND METHODS
Study subjects and clinical procedures. Clinical material wasobtainedfromsix HIV-1-infectedpatientswithsignificant
neurological signs and symptomsrequiring image-guided ste-reotactic brain biopsyfor definitive diagnosis. A clinical his-tory, neuropsychiatric tests, and CD4+ lymphocyte counts
were obtained for eachstudy subject. Neurological signs and symptomswereconsistent with theonsetofglobal neurological dysfunction, with clinical evidence supporting acute rather than chronic HIV-1-associated neurological disease. The
pa-tients most commonly presented with generalized seizures (fourofsix)andchangesinmentation(twoofsix).Nopatient hadneurological problems priortothe presentingevent.Each patient'ssignsandsymptomsresolvedafterspecific therapeu-ticinterventionwasinitiated.
AllpatientswerefromtheUnited Statesandhad lowCD4+ lymphocytecounts(Table 1). Thesamplesweretaken in 1990 from patients 1 to 4 and in 1992 from patients 5 and 6. Peripheral blood was collected in preservative-free heparin
duringthe operation.Allsampleswerecodedtopreserve the anyonymityof the study subjects.
Contiguousbrain biopsycores(2 by20mm)were
immedi-ately placedinsterile tubescontaining4Mguanidium isothio-cynate for nucleic acid analysis, Dulbecco's modified Eagle's medium(DMEM)for virusisolation,formalinfor histopatho-logical examination,and STE(StreckLabs, Omaha, Neb.)for in situhybridization analysis.The brain tissuesamplesin 4 M guanidiumisothiocynate and DMEMwere frozenand stored
at -135°C. Brain biopsy specimens were also processed for routine histopathological and virological evaluation as de-scribedpreviously (48). Diagnosticstudieswereperformedfor
microbiology (viruses, includingcytomegalovirus [CMV],
her-pessimplex virus, andpolyomavirus; bacteria;andprotozoa),
cytology, andhistopathologyasdescribedpreviously(48).
Nucleic acid preparation. Peripheral blood mononuclear cells (PBMCs)wereobtained fromwhole bloodby discontin-uousFicoll-Hypaque density gradient centrifugation. The PB-MCs were washed in phosphate-buffered saline, and the cell concentrationwasmeasured with ahemacytometer.
Approxi-mately 106 cells were resuspended in 400 ,ul of 10 mM KCl-10 mMTris-HCl (pH 8.3)-2.5 mM MgCl2-0.5% Tween20-0.5%
Nonidet P-40-100 ,ug of proteinase K per ml and incubatedat 55°C for 1 h. The cell DNAwasincubated at95°C for 10min to heat-inactivate the proteinase K.
The brain biopsy cores were dispersed in 4 M guanidium
isothiocynate with an Omnimix homogenizer in a disposable
vessel. Total nucleic acids were extracted with
phenol-chloro-form (24:1,chloroform-isoamyl alcohol), ethanolprecipitated,
and resuspended in deionized water. This method minimizes the systematic bias towardsonegenetic variant, as is observed whenthe virus is cultured (45, 72).
Oligonucleotide primers and probes.The HIV-1 oligonucle-otide primers and probes were designed using the HIV-1 consensus sequences contained in the Los Alamos Human Retroviruses and AIDS database (56). Oligonucleotides were synthesizedon anAppliedBiosystems 380B DNAsynthesizer using phosphoramidite chemistry. The synthesized material was alkaline deprotected and purified by elution through an oligonucleotide purification cartridge. To screen forpotential pretermination products, the purified oligonucleotides were end labeled with [_y-32P]ATP and T4 polynucleotide kinase, resolved byelectrophoresis on a10% polyacrylamide gel, and exposed toKodak XAR film for 3 hwithintensifying screens at -80°C. Thepositions of the outer and inner sets of primers in theHXB2 isolate have beenpublishedpreviously (80).
PCR amplification. One microgram of PBMC DNA was amplified in 100 ,ul of reaction mixture containing 3.0 mM MgCl2,50 mM KCl, 10 mM Tris-HCl(pH8.3), 20puMeach of the fourdeoxynucleoside triphosphates(dNTPs),0.5p.M each of the outer oligonucleotide primer pairs, and 2.5 U of Taq DNApolymerase. The reactions were performed in a Perkin-Elmer Cetus automated thermal cycler programmed for 32 cycles ofdenaturation at 98°C for 10 s, annealingat50°C for 15 s,and extensionat72°Cfor 2.0 min. A final extensionat72°C for 10 min was added to the last cycle. A5-pul aliquot was reamplified in a 100-,ul reaction mix containing 0.5 p.M each inneroligonucleotide primer pair with the same cycleprofileas above. Specific precautions to avoid template and amplified product carryover, including physical separation ofprocessing areasand useofpositive-displacement pipettes, were in effect at all times (80). Stringent quality control to prevent PCR contamination was provided to ensure against cross-contami-nation of product DNA before, during, and after in vitro amplification. Added precautions were taken at the analysis stagewhen doing cross-comparisons of all sequences included in the study as well as comparisons with common laboratory strains.
Molecular cloning. To screen for the appropriate-sized product, a20-pulaliquotfrom thefinal inner nested amplifica-tion was resolved by electrophoresis on a 1.0% agarose gel. The remaining 80 p.l of reaction mixture was resolved by electrophoresis on a 1.0% NuSieve GTG low-melting-point agarosegel. The correct DNAfragment was excised from the gel andpurifiedby GeneClean II(Bio101), phenol-chloroform extracted, and ethanol precipitated. Thepurified productwas eluted in water and digested with the specific restriction endonucleases in the appropriate bufferat 37°C for 16 h. An J. VIROL.
on November 9, 2019 by guest
http://jvi.asm.org/
DIFFERENCES IN BLOOD- AND BRAIN-DERIVED HIV-1 7469
aliquot of the restricted product was resolved by electrophore-sis on a0.8% agarose gel to screen for any potential restriction sites which would select against a particular variant in the population.
Therestricted product was inserted into the multiple cloning site of vector pGEM3zf(-) (Promega), and 0.1 ,ul of the ligation product was used to transform competent JM109 bacterial cells. Transformed colonies were color selected on
ampicillin-isopropylthiogalactopyranoside
(IPTG)-5-bromo-4-chloro-3-indolyl-3-D-galactopyranoside (X-Gal) agar plates.
White colonies were chosen at random and amplified in culture. The bacterial DNA was recovered from a small-scale plasmid preparation. A portion of the plasmid DNA was digested with the appropriate restriction endonuclease, and the insert was screened for appropriate size and relative quantity by electrophoresis on a 0.8% agarose gel.
DNA sequencing. The double-stranded plasmid DNA was sequenced in both forward (M13-21 universal primer) and reverse (M13reverse) directions with Dye-Deoxy terminators (Applied Biosystems, Inc.). Approximately 1 ,ug of the double-stranded DNA template was added to 80 mM Tris-HCl (pH
8.3)-2 mM MgCl2-20 mM ammonium sulfate (pH 9.0)-7.5
,uM each dNTP-1,ul of each Dye-Deoxy terminator-3.2 pM either oligonucleotide primer-8 U ofAmpliTaq DNA poly-merase. The totalreaction volume of 20,ul was overlaid with white light mineral oil to preventevaporation. DNA sequenc-ing was performed in an automated thermal cycler pro-grammed for 25 cycles of denaturation at 98°C for 1 s, primer annealing at 50°C for 15 s, and extension at 60°C for 4min. The sample mixture was then eluted through a spun column
(Bio-Rad)and ethanolprecipitated to remove unincorporated
oligonucleotide primers and dNTPs. The amplified product DNA was added to 5
[l
of5:1 deionized formamide-50,uM EDTA and denatured at 95°C for 3 min. The Dye-Deoxy-labeled sequencing reaction mixes were resolved by electro-phoresis on a 6% polyacrylamide gel and analyzed with an ABI 373Aautomated DNAsequencing system.Data analysis. Comparisons were done based on various breakdowns of the available sequence data. PIMA (65, 66), an algorithm that incorporates a gap penalty and takes into accountamino acid side chain chemistry, was used to generate initial amino acid alignments. Both protein and DNA align-ments were then manipulated with the multiple alignment sequence editor (MASE) (19). Simple sequence similarity comparisons were made by using MASE after removing posi-tions in the alignment in which gaps had been inserted to maintain the alignment. These were calculated as Hamming distances, or (1 - s) x 100, where s is thefraction of shared sites in two aligned nucleotide sequences. Hamming distances wereappropriate for use in this context because we were not using them to establish phylogenetic relationships, but rather tocompareoverall genetic diversity in different sets of genetic sequences. To determine the significance of the distinctive distributions of HIV-1 sequence distances, Wilcoxon rank sum statistical tests were run using the SASstatistical package (SAS Institute Inc., Cary, N.C.) Phylogenetic trees (29, 70) were
generated by using parsimony (PAUP) (69) and maximum
likelihood (PHYLIP) (21, 22).
Signature patterns were defined by comparing the difference in entropy among brain- andblood-derived sequences in each positioninanalignment of all sequences from all patients. The entropyH(i) (4) is defined in terms of the probabilities,P(s,), of the different symbols, s, that appear at a given position i
(e.g., in this case, we are considering the symbols s =A, S,
L,. .., for the 20 amino acids Ala, Ser, Leu, . . . ). H(i) is defined as:
H(i)= - >
P(si)
logP(si).
s=ASL,...
Using entropy as a measure of relative conservation takes into account both the variety and frequency of observed amino acids in each position. Potential N-linked glycosylation sites were considered as either unlinked amino acids or as units, where an asparagine (N) of an N-X-(T or S) sequon was distinguished from other asparagines.
To define a signature pattern objectively, we calculated the difference in H(i) between the blood set and the brain set of viral sequences at each position in the amino acid sequence alignment. The signature pattern consists of amino acids in particular positions of the alignment that were very common or perfectly preserved among the brain-derived sequences and variable in the "background" population of viral sequences from the blood. To test the statistical significance of an observed entropy difference, a Monte Carlo randomization was used. The blood and brain viral sequence sets were combined into a large pool and then randomly partitioned into two data sets of the same respective sizes as the original blood andbrain data sets by random-with-replacement selection. The entropy differences for each position in 10,000 randomized data sets were calculated for all of the randomized sets to determine a "background level" of entropy difference (39). For aconserved signature site to be considered statistically signif-icant, none of the positions in any of the randomized sets could yield an entropy difference as great as the observed difference in the real data set
(p
= 0.0001). The sign of the entropy difference in the real data indicates whether the observed conservation was in the brain set or in the blood set.PCR-driven in situhybridization. Paraffin-embedded tissue sections fixed with a Streck (Omaha, Nebr.) tissue fixative were cut,adhered to silanized slides with 3%(vol/vol) Elmer's glue, and deparaffinized in xylene. After dehydration in graded alcohols and rehydration in phosphate-buffered saline (PBS), thesections were digested in 30 ,ugof proteinase K per ml in 20 mMTris-HCl (pH 7.4)-0.5% sodium dodecyl sulfate (SDS) for 1 h at37°C. The slides were washed twice in PBS for5 min and dehydrated in graded alcohols (16).
Slides were placed on a Coy Slidecycler (Coy Laboratories), preheated to 82°C, and tissue sections were rehydrated in 40pul
of PCRmixture (10 mM Tris-HCl [pH 8.3]; 50 mM KCI; 1.5 mM MgCl2; 0.25 mM dATP, dCTP, and dGTP; 0.14 mM
dTTP; 12.9 puM dUTP-11-digoxigenin; 100 pM each forward and reverse primer; 0.001% [wt/vol] gelatin) preheated to 94°C. Taqpolymerase (1.0,ul;5 U of AmpliTaq [Perkin Elmer, Norwalk, Conn.]) was added to one of two sections on each slide.Sections were individually coverslipped, sealed with nail polish, and cycled for 35 cycles(94°C for 1min,55°Cfor 2min, and 72°C for 2 min). Product DNA was hybridized in situ to specific or nonspecific (CMV IE-3 probe) biotinylated oligo-nucleotides as described previously (15).
Nucleotide sequence accession numbers. The sequences studied here have GenBank accession numbers U05360 throughU05568.
RESULTS
HIV-1sequences from blood andbrain. Figure 1 shows the
alignments of the amino acid translations of the nucleotide sequences. The coding potentials of the V3 and V4-V5 regions of env were maintained in most viral sequences. Potential inactivating mutations were observed in both the V3 (five frame shifts and two stop codons) and V4-V5 (two stop codons) regions. There were a total of nine inactivating VOL. 68,1994
on November 9, 2019 by guest
http://jvi.asm.org/
7470 KORBER ETAL.
A
SENrTNNAKTIIVQLNaSiVIVNCuTRPNNNT.RKbSIPIGAPGRAY1TTGI1GIRQ ,.F. . . ..S .I.. .A. .T.EI. . .
Patient 1 BLOOD:
-D---I---Q--E-K-I--.--G-A---TV--AER---2 ---S---I---K-IE-K-I--.--G-A---TV--AER--- ---I---K-IE-K-I--.--G-A---TV--AER--- ---T---I---H--E-K-I--.--G-T---TV--AER--- -D--S----I---Q--E-R-I----T-.--G-T---TV--AER--- --I---I---Q--E-K-I---G-T---TV--AEK--- -DT--D---I---K-IE-K-I--.--G-A---V--AEG--- ---I---Q--E-K-I--.--G-T---TV--ADR--- ---I---I---K--E-K-I--.--G-T---TV---ER--- ---I---S--A-K-I--.--G-A---TV---ER--- -D-S---I---K--E---I---T--.TQG-N---S----D--- ---I---Q--E-K-I---T--.-NG-A---TV-SADRL--- ---S---I---Q--E---I---QG-T---TV--ADN--- ---I---K-IE-K-I---N---D--S----I---Q--E-K-I-- .----N--- ---I---Q--E-K-I---N---V---YN-V-D-T-I---N--G-K-I--
.----N---Patient 1 BRAIN:
-S---I---T--E ---.----N--- 8
-S---I---T---.---N--- 5
-S---I---H--T---.----N---
-SK---I---T---S--.----N---L---N---D-T-I---S--E
---.----N---S----T--I---T---.----N--- 2
Patient 3 BLOOD:
----SD---IA---.--R-TL----V---Q---R 3
----SD---IA---.----N---A--D--- 3
----SD---I---.S-R-TL----V---Q-V----R
SG -0---IA---.--R-TL----V---Q-V----R --KTSD---I---.S-R-TL----V---Q-V----R
----SD---I---.--R-TL----V---Q-V----R 3
---LSD---IA---.--R-TL----V---Q---R ----SD---I---T-.--R-TL----V---Q-V----R ----SD---IA---.--R-TL----V---Q-V----R 2 ---LSD---P---IA---.--R-TL----V---Q---R ----SD---IA---.----N---A--D---R G --S---IA---.----N---A--D---SD---I---.--R-TL---GV---Q-V----R ----SDT---I---I--.--R-TL----V---S-H-V----R ----SDT---IA---II-.--R-TL----V---S-Q-V----R ----SDT---IA---II-.--R-TL----V---S-H-V----R ----SDT---IA---I-.--R-TL----V---S-HLV----R ----SD---I---II-.$---N---AS-D---H ----SDT---IA---T-T--R-TL----VS----Q-L----R ----SDT---I---T-T--R-TL----V---S-HLV----R ----SDT---I---.--R-TL----V---S-H-V----R ----SD---IAL---T-T----N---AS-D---H ----SDT---IA---II-.--R-TL----V---S-HLV----R ----SDT---IAL---II-.--R-TL----V---S-HLV----R ----SDT---IA---I-.--R-TL----V---S-HLV----R ----SD---I---I-.--R-TL----V---S-H---R ----SD---IAL--S--.-T-T-LR-TL---V---P-H---R ----SDS---IA---.--R-TL----V---H-V----R ----SD---IA---.----N---V---D---R
Patient 3 BRAIN:
----SD-V---I---S---.-R--N---Q---SD-V---I---.---A--- 5
----SV-V---I---.---A---
----SD-V---I---.---A---N---A-I---S---.-R--N---Q--- -- 4
----SD-V---I---T-.---HA---A-I---S-I-.-R--N---S-H---H ----SDTVT---I---T-.---A--- ---A-I---S---.-R--N---A--- ---A---A-I---S---.-R--N---Q---
----SD-V---I---.---DA----V-V-.-Patient 5 BLOOD:
L---T-T-T----S---.--R-A---V---EQ---R ---L---T-T---S---.--RLA---V---EQ---R ---L---T-T---S---.--R-A---TV---EQ---R ---L---T-T-T-P--S----.--R-A---V---EH-L----R ---L-T---I---T-T-L-T----ST--.----T---VT---L---L----KT-I-I----S---.---T---H---R-R.P
--- ---I---I---KT-I---S---.----T---PPP-QLT---
---I---T-E---P--S---.----T----G----E.-L---Patient 5 BRAIN:
----A----I---T-E---P---.----T---L--- ----AI---I---T-E---T---.----T---L--- ----A----I---P-E---T---.----T---L-P--- ---I---T-E---T---.----T---L--- ---I---T-E-T---.----T---L---.----L-E-
---I---T-E---.----T---LS---I---T-E---.----T---L--- 2
---T-NI---T-E-T----.-T-T--R-T---LSP---I---T-E
---.----T---LF---
---I---T-E---T--.----T---LS---NI---T-E
---.---LF-P.--L---SENFTNNAKTIIVQLNESVVINCTRPNNNT . RKSIPIGPGRAFYTTGEIIGDIRQ
.F... .1.... A.. .T.EI.
Patient 2 BLOOD:
-D---D---K-A-E---.--- 4 -A---D--- K-A-E---T--- D---D---D--- K-A-E----T-- -0--- G---D-L-D---KDA-EV
---A---D--- K-A-E--- R---D---D--- K-A-E ---T
---D---D--- K-A-E-.--- R--- X---D---D--- K-A-E---
D---D---D- T---T-A-E--- T-I.--R--- G---D-L-D--- K-A-E ---.---D---$ -A---D--- K-A-E---T-I.--R
---D--A---K-A-E ---T-I .---
D---D--A---K-V-E-.--.--- --V---S--- L--- W--D---D--- K-A-E --- T---. ---V-L ---
W--A---D---K-A-E-.--.--- --L---
V---Patient 2 BRAIN:
TD-H---T-S---L-A-EV--S--T--- ---V---V---V---D---D---K-A-E --- R---
K---D---K-A-E-.--.--- --V--- 2
-A-K---K-A-E-.--.--- --V---V---DS---K-A-E ---.---D-T
---V---D---K-A-E-.--.--- --V--- D---D---K-A-E--- 2 -N--AD---K-A-E----.--- --V---D--A---K-A-E ---A---D---K-A-E ---Patient 4 BLOOD:
---DX--S - T- .-L- I-A--H-V
---V-V---E----.--- -L--- I-AA-H-V
---S--- .--- -L--- I-A--H-V
---D---S--I---I--.---L--- I ---ET---H Patient 4 BRAIN:
---S---T-.T---L---I-A--H-V-N--H
---P--D--S- ---.--- --Q---K
---X--D-- S --- S----Q--- X ---S ---X--.--L-- I-A--Q-V-N ---D---S---Q---K 3 -A----H--S---.--- -L--- I-A--Q-V-N---Patient 6 BLOOD:
---L---EKA-N-T-E--H--- .---- -
I---A--D---K-A-N-T-E--H --.-- --N---A--D
---Y---K-A-N-T-E---. -I---A--G
-0---T-A-N-T-E-E --- --N-- A--A
---R.--N-T-D - . ----N---A-
.D---K-A-N-T-D---. --F-- A--A
---L---K-A-N-T-E---. --N-- A--A
---K-A-N-T-E---TT- . ----N---R----A--D ---K-A-N-T-E- --T-- .---- - I---A--D---K-A-N-T-E--- -I---A-. D---K-A-D-T-E- . ----N---HAP.D
---N---KKA-E-T-E - . ----N---HA-. D---K-A-N-T-E---. --N--- HA--DV--N
---K-A-N-T-E--T --.-- --N--- A--DV--N
---R-A-N-T-E---. --N--- A--DV--N
--Patient 6 BRAIN:
---Q-A-N-T-E - .----N---A--D--- (Ti) ---K-A-N-T-E----I- . ---FY---A--D--- (Ti) ---N---K-A-N-T-E - . ----N---A--D--- (Ti)
---K-A-N-T-E----T-. ----N---A--D--- (Ti)
---R.--D-T-E---N---A-.D---N--- (Ti)
---K-A-N-T-E--T-T- . ----T---A--D--- (T2) ---K-A-E-T-G - . ----N---A- .D--N --- (T2) ---K-A-N-T-E - .----N---A- .D---N (T2)
--- -.LN-T-E---TT- .----N---A--D --- (T2)
---Q-A-N-T-E - . ----I---A--D--- (T2)
---RK.LN-T-E ----T- . ----N---A- .D----L-- (T2)
---K-A-E-T-E---T-- . ----I---A-.D--- (T2) J. VIROL.
on November 9, 2019 by guest
http://jvi.asm.org/
VOL.68, 1994 DIFFERENCES IN BLOOD- AND BRAIN-DERIVED HIV-1 7471
B
MHSFNCGGEFFYCNSTQLFNSTW..N?T....GK?.NTGGNDTITLPCRIKQI INMWQEVGKAMYAPPIRGQIRCSSNITG.LLLTRDGG.NNNNET?...EIFRPGGGDMR Patient 1 BLOOD:
--T----E--P---T-K---Q...-G-DQNVTERAN.P-E---HL-T---R-RQ---T----.---SS-T-.-...T---A----K T---T-K--- DG-DWNVTE-AN.--E---H---R----T---T---.----SSS-NET...---A--K T---T-K--- DG-DWNVTE-AN.--E---R--N---T-D--- ---D.-SSS-NET...---A----K T----E--L---T-K----$..DS-D$NVTERAT.--ER----A----QH----R-RN---K----T--- ----E-SSSETEI....---T--G-K
T---T-K ---G-DWNVTE-SN.---E---H----R--E---T--- -SSS-NET...---A----K
T---T-K--- DG-DWNVTE-PNRP-E-Y---T---R---K----T--- -SSS-NET...---A----K T---F--T-D--- DG-DWNVTE-PNRPPE---R---T--- -SS. .NET.-...T---A----K
Patient 1 BRAIN:
TN---S---T--G..LISTG.STE-SI.S-D-SE---MMP--D---K---S-P---S---. -NH---S---T-K--I--G. .-G-DWGVTD-SI.---E---P----NH---I-KR---T---DD-SSNET....
----H---T-K ---G-DWSVTE-SN.---E- ---R---T---DD-SSNET...---T--K
-YH---T-K---G-DWSVTE-SN.---E---R---T---DD-SSDET...---T----K --H---T-K---G-DWSVTE-SN.---E---R---T---DD-SSSET...---A----K
Patient 2 BLOOD:
T---G--F.-S-WST. .E-SN.--E-S---F---S---GSE---.
T---P----G--F.-S-WST..E-SN.--E-S---F---S---T
---E-T---.YD-KEL....N.S-.-EM.---RR---F---VS---T-DT--T. -....F---D-KEL....N.S- .-EM.---R--- ---TD-T
Patient 2 BRAIN:
--N---HD-KEL...TST-EM.---H---R---
N-P--V---D-KEL.-....ST-EM.---H---R---
--.---S-T-G-...P---N---D-KEL.-....ST-EM.---H----D--R---
-P-V---.---.D-KEL.-....ST-EM.---R---R---A-.---T-G-...
P---N---D-KEL.-....ST-EM.---H---R---
N-P-V---.---D-KEL.-....ST-EM.---R-K--- ---A-G-...
P---NNH---P----P----G. .-D-KEL...IGT-EM.---LT---T--K---R--- N-P--V---N---LS----S---T---.-.D-KEW...TRT-EL.--F---LY--LTR-K---N--F---
--.---A-G-...P---NN---P----S--- I--G..-D-KEL...TGT-EM.T----LN-F-T--K---R--F---
N-P--V---Patient 3 BLOOD:
-YT---T---.- IA..-..EP.HPTAGENM---H---K--- K-DNNKT..
---T---I.-....EPNIA.K-K ---G--- K-DNNKT.
---T---S-SF-S-W..NSTEESNS- .EG-P----LTHL-S-S----P ---V--- N-TNA ....T---T---S-SF-S-W. .NIT-EPNI-.-K---HH---P---G--- K-DNNKT..
---T---I-.-....EPY--.-GENM---G---D--A.---S-K-DNNKT.
---IS---SL ---ID..- -..EPY-- .-REM---I---LS---Y-A---D.... -N-NYA ....T---Patient 3 BRAIN:
-YT---S-P---S.. --...PNI-.-E---I--5---S---.----SD ....P---YT---V---ST----..-5-. --....PNI-.-E---I----I-L-T--- ---D---SD
....P---Patient 5 BLOOD:
----T----P---T----S---E-VI.NQGPYN.T--D-E----Q---K---S-V-T--- ---VKS--T-NSTNTAEV
---T----T---.- -E-KI.KEGPYN.T---Q---S-V-T--- ---VKS--T-NTTNTTEV
---T---T----T---.--EAII.NQGAIY.HYRKLKQSSS---K-P-S-L--.---E-TD-A-. .DNNT. .-V
---P---T----T---..-E-II.TQGPYN.T--N-E-L--QS--T-L-T---S-L-Y---R-ADS-.TDNNT.
---T----L---T--- SE-IT.KQGPYN.T--N-E----Q---T---K----E---.D-T-. .DNNT
---T----P---T----T---.--E-II.KQGPYN.T--N-E-L--Q---T-L---T----V---.D-TN. .DNNT.
---LC ---G-.... EGPYN.T-- .-E---K----L-H---. -- . --H-PYQ....YHR
---SF--T-H--T---NE-V-....EESYE.T--.-E---K----E---.D-T-. .DNNT
---Patient 5 BRAIN:
---R----L--D---NE-V-... .EESYE.T-- .-E---K---S-L-.---. NT...-T
---D---NE-V-... .EESYE.T-- .-E---K---S-L-.---. TTT...-T
---D---NE-V-... .EESYE.T-- .-E---K---S-L--.---.T.--- -T2 Patient 6 BLOOD:
T---F--T---YS-N-W....EG.ERLS----I---L----S---K-R---PVANXKMVG.---N-.DGNES.
---T---F--T---YS-N-W....EG.ERLS----I---L----S---K-R---- --- N-.DGNES.
---T---I----F--T---YS-T-...RR.GE-LRTN---P-V---S----L----K-R --- N-.DGSES.
---T---SS--TS---YS-N-...RK.GE-LSTN---P---H---S ---K-R---.. N-.DGNRI..-T
---T---F--T----T---YS-N-...RR.GE-LRNN---V----S---K-R --- N-.DGNES.
---T---F--T---YS-N-...RR.GE-LSNN---V----S---K-R- T---T --- N-.DGSQS.
---T---F--T-K----NNTGE...SK.G.IS----I---L----S---L-T---.. N-.DGNRI. .-T
---T---T----S--TSP--T---YK-S-W.NNT.-EG.ERLC----I----T-V---S----L----K-RL--L---TVGYQLD-.G---N-.DGNRI. .-T
---Patient 6 BRAIN:
T---F--T---YC-N-...WEG.ERLS-N.T---V----S---K-R ---H--- --.. I- .TRSEI.---(Ti)
T---PF--T-K---N-..-...ES.EGLS-N.---V----S---T-R---A.-S---I-NRS.EI .---T (Ti) T---SF--T---YS-N-...RNG.EGLS-N---L----S----F----K-R ---H--- --.. I-TRS.EI.---(Ti)
T---SF--T-K---N-.-....ES.EGLS-N.---V----S----F----K-R----H---I-ARS.EI.---(Ti) T---SF--T-K---N-.-....ES.EGLS-N.---V----S---K-R--- I-NRS.EI.---(T2) T---T----F--T----D---YS-N-...R-G.EGSS-N.V---V----S---K-R---L--- I-NGS.EI..-T---(T2) T---F--T----D---YS-N-...R-G.EGLS-N---L----S---K-R----H--- --.T-.DGNES.---(T2) T---LF--T-K---N-.. -...EI.EGIS----I---L----S---K--- ---ITNTNGNES.---(T2) T---F--T---YS-N-...R-G.EGLS-N---L----S---K-R----T--- . T-.DGNES.---(T2) T---F--T---YS-N-...W-G.ERLS-N.T---V-H---S---K-R---- ----S---I-NRS.EI.---(T2)
T---LF--T---YS-N-...W-G.EGLR-N.T----T-V----S---K-R ---S--- -I-NGS.EI.. -T---(T2)
-T---F--T----D---YS-N-...R-G.EGLS-N.---L----S---K-R--- T-.DGNES.---(T2)
FIG. 1. Alignmentofthe V3(A)and V4-V5(B)regionHIV-1envelopeamino acid sequences obtained from brainbiopsyorbloodsamples. Viral sequencesare alignedtotheconsensussequence of the brain sequences from the sixindividuals, shownat the topof eachcolumn. Directly underneaththecompleteconsensusinpanelAarethe brain sequence signatureamino acidsasdefined in Table 2 and in thetext.Amino acidsare
indicatedin the one-letter code. Amino acids in thealigrnmentthat shareidentitywith the brainconsensussequence shownatthetopareindicatedby
adash. Iftwoor moreclones fromagivensetarecompletelyidenticalovertheregionsequenced, onlyoneisshown;the numbersattheend ofasequence indicate the numberof clonesrepresented bythat sequence. A dollarsignsymbol($)indicatesastopcodon,andanXindicatesaframe shift. Aperiod indicatesaspace insertedtomaintain thealignment.Brainbiopsy samplesweretaken frompatient6at twotimepoints,indicatedbyTiorT2atthe end of thesequences;Ticorrespondstothe time that thebloodsamplewasobtained,and T2was6weeks later.
on November 9, 2019 by guest
http://jvi.asm.org/
7472 KORBER ET AL.
TABLE 2. Frequencyof signatureamino acidsa
Sequencederivation Frequencyofoccurrence
(no. of sequences) F s I A T E/D I NCT NNT
Blood
Patient 1 (18) 0.72 0.22 1.00 0.33 0.39 0.28 0.94 0.11 0.89
Patient2(18) 0.89 0.89 0.89 1.00 1.00 0.89 0.94 1.00 0.67
Patient 3(36) 0.92 0.22 0.22 0.19 0.63 0.22 0.86 1.00 0.83
Patient 4(4) 1.00 1.00 0 1.00 0.75 0 1.00 1.00 0.75
Patient 5(8) 0.13 0.50 1.00 0.75 0.75 0.25 0.63 0.38 0.86
Patient 6(15) 0.93 1.00 1.00 1.00 0.93 0.80 0.80 0 0.87
Brain
Patient 1 (18) 1.00 1.00 1.00 1.00 1.00 1.00 1.00 1.00 0.94
Patient 2(12) 0.92 1.00 1.00 1.00 1.00 0.92 0.92 1.00 1.00
Patient3(18) 1.00 1.00 1.00 1.00 0.94 0.61 1.00 1.00 1.00
Patient4(8) 1.00 1.00 0.63 1.00 1.00 0 1.00 1.00 1.00
Patient 5(12) 1.00 0.92 1.00 1.00 0.92 1.00 1.00 0.83 0.92
Patient 6(12) 1.00 1.00 1.00 1.00 1.00 1.00 1.00 0 0.83
aTheconserved aminoacidsof the envelopeV3region signaturepattern are shown at the top;these amino acidscorrespondtothesignaturesites shown inFig. 1A.The numberofsequencesof each sample is shownonthe left, followingthepatientnumber.The frequencyof theoccurrence ofthesignature aminoacid ineach sampleisgiven. Glutamic acid (E) is thesixthsignatureamino acid. Aspartic acid(D)was also very common and a conservativesubstitution,and thestatistical significance of the conservation of that sitewasobservedwhensignatureanalysiswasdone using the individual amino acidsor amodificationof theinputwhichgrouped Dand E as asinglecharacter. Therefore, D or E isallowed for thefrequency counts. Thefrequency of the glycosylationsites in the V3loopisalso given.The V3 glycosylation sequonswere moreconservedamongbrainsequences, inall 10,000oftherandomizations; however,theconservationwascritically dependentonthe inclusion ofpatient1for thefirstsequon(NCT) and patient2for the secondsequon(NNT),andbecause ofthisdependenceon asingle patient,theconservationwas deemed less reliable than that of theother signaturepatternelements.
mutations in 54,093 bases sequenced, six found in the 28,872 nucleotides ofblood-derived viral sequences and three found in 25,221 nucleotides of brain-derived viral sequences. The
fourcysteines encompassedin theregions sequenced thatare
involved in disulfide bonding and in the formation of the V3 and V4 loops (47) were highly conserved, but not perfectly, with two sequences having substitutions in these positions. Such substitutions are also likely to represent inactivating substitutions, asmutations in these positionscanhave drastic structural consequences for the envelope protein.
Length polymorphism was common in the V4 and V5 region,evenwhen considering only intrapatient sequence sets. Inthese highly polymorphic regions, duplications or deletions of N-linked glycosylation sites, as defined by an N-X-T or N-X-S sequon, were particularly common among the blood-derived sequences (Fig. 1B).Thetwoglycosylation sequons in the V3 loop tended to be morepreservedinthe brain-derived than in the blood-derived viral sequences. Because of the biological importance of glycosylation sites (46, 51, 57) andthe
conservation of these sites among sequences in the Human Retroviruses and AIDS database (56), the information sum-marizing the variation of these sites is included in Table 2.
Intrapatient sequence variation. A general question of
interest in terms of assessing intrapatient HIV-1 variation is
whether blood samples are representative of the variants within anindividual orifcertain forms may be sequestered at inaccessible sites(14). The V3 region diversity within a patient increased when both blood and brain sequences were consid-eredversusonly blood sequences(Fig. 2). The median distance of allpairwise intrapatient blood x blood sequence compari-sons for the six patients was 4.9%; the same brain x brain mediandistance was3.5%,and the same intrapatient blood x brainmediandistance was 7.7% (Fig.2). There was no change in observed diversity for the V4-C3-V5 regions (median dis-tances:blood x blood,7.2%; blood x brain,6.0%; and brain x brain, 4.4%). The brain-derived sequences were relatively conservedcompared with the blood-derived sequences in both
regions.
There was an
expansive
range ofintrapatient
HIV-1se-quencediversitywithin thissetofHIV-1-infected patients.In the V3 region, the range ofintrapatientnucleotide sequence distanceswas0.0to 18.9%,withamedian value of 6.3% and
0.3
0
.,
Q0.2
E
0 0
01)
a
co
0.
o0.1
Cu
70 80 90
Percent similarity 100
FIG. 2. V3region intrapatient similarity distributions.All intrapa-tientsimilaritycomparisonsweremade for the sixstudyparticipants. Theregion comparedincluded 143 bases. The percentsimilaritywas
rounded offtothenearestpercentage,and the numberon the y axis represents the fraction of the total number ofpairwise comparisons that had agivenpercentsimilarity.Forexample, 1.6%of the sequences
were 100% similar (identical)over theregion sequenced. The solid line represents the distribution of similarity scores obtained from intrapatient blood-derivedsequences.The dashedline represents the similarity scores of all intrapatient comparisons of blood-derived sequenceswith brain-derived sequences. Notetheshifttowardsgreater diversity when comparing blood-derived (median distance = 4.9%)
and brain-derived (median distance = 7.7%)viral sequences rather than blood-derived sequencesalone.
J. VIROL.
on November 9, 2019 by guest
http://jvi.asm.org/
[image:6.612.346.540.417.595.2]DIFFERENCES IN BLOOD- AND BRAIN-DERIVED HIV-1 7473
A
B
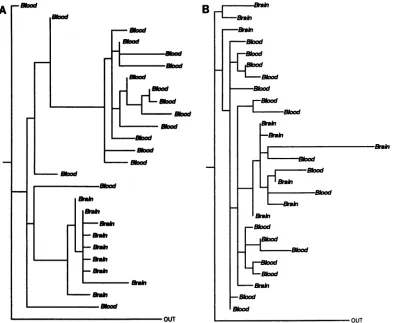
FIG. 3. Phylogenetic analysisofintrapatient sequence sets. Viral sequencesfromthe V3 region from (A) patient 1 and (B) patient 2. The trees shown have the maximum likelihood afterthree randomizations of the input order. Identical nucleotide sequences were excluded. "Blood" indicates that thetaxa arederivedfrom the blood; "Brain" indicates thatthetaxa are derived from the brain.Asequence from the blood of patient 6wasusedasthe outgroup sequence for thetreesof bothpatient1andpatient2.Forpatient 1, therewere 27 taxaand 163sites,with 97varied sites; for patient 2, therewere28 taxaand 158sites, with 86variedsites. The treesshowndisplay patterns
simnilar
to those obtained by using parsimony and were supported by bootstrap analysis of parsimony trees (see text).interquartile range of 3.5 to9.1%. The range of intrapatient nucleotide sequence differences between blood- and brain-derived isolates in the V4 and V5 regionswas 0.0 to 17.3%, withamedian of5.2%andinterquartile range of 3.6 to 7.2%. Phylogenetic analyses of intrapatient sequence sets. Two
patternswereobserved in the phylogenetic reconstructions of
genetic lineagesof sequences fromintrapatientsequence sets.
Infour of the six data sets, the brain-derived viral sequences were tightly clustered relative to the blood-derived viral se-quences (the strongest cases for tissue-specific compartmen-talization of viruscanbe made forpatients 1,5,and3; patient 4,with much fewerdata,seemedtoalso fall into this category, but lessdefinitively). Intheothertwodatasets(patients2 and
6), the blood- and brain-derived viral sequences were
inter-mingled.These observationswereconsistent whentwo
meth-ods were used to construct phylogenetic trees: maximum
likelihood (21, 22) and parsimony (69). The V3 region maxi-mum-likelihood trees obtained for patients 1 and 2 were selectedtoillustrate thetwopatternsdescribedabove(Fig. 3).
The phylogenetic analysis for patient 1 shows the brain
sequencesformingtheirowndistinctclade,while inpatient 2,
the brain sequenceswereintermingled with blood sequences. Forthe fivepatients with the V4-V5 region sequence informa-tion (all but patient 4), the V4-V5 phylogenetic patterns
agreed with the observed V3 region pattern, although fewer
sequences were compared. A bootstrap test applied to the parsimony trees (20, 22, 30) generally supported the brain-derived viral sequence clustering patterns obtained by using
parsimony for patients 1, 3, and 5. Thebootstrapproportions
for the reconstruction of thebrain-clustering patterns in 100
resamplings of the data were 74 of 100 for V3 and 98 of 100 for V4-V5forpatient 1;58 of 100 for V3 and 98 of 100 for V4-V5
forpatient 3;and 78of 100 for V3 and 92 of 100 for V4-V5 for
patient6. Thebootstrap proportionswereshownbyHillis and
Bull (30) to be a conservative estimate of the accuracy of reconstructions oftruephylogenetic branching order under a rangeconditions. Therelativeconservationinlengthof the V4 andV5 region brain-derived viral sequencesfrompatients 1, 3,
and 5and thelength polymorphism in thebrain-derived viral sequencesof patient 2 and patient6 also supported the two
distinctphylogeneticpatterns
(Fig.
1B).Localization of virus in brain tissueby PCR-drivenin situ hybridization.Histologicalexamination showednoevidenceof characteristic multinucleatedgiantcellsormicroglial nodules in any of the sixpatients.Twoof thepatients,representatives
of the two distinct intrapatient
phylogenetic
patterns, were selected for further experiments to examine the cell type associated with viral infection. Patient 3 representsanexample
ofapatientwhose brain-derived sequences formed adistinct
clade. Patient 6 represents an
example
of apatient
whose VOL. 68, 1994on November 9, 2019 by guest
http://jvi.asm.org/
[image:7.612.105.500.71.394.2]7474 KORBER ET AL.
.: *: r
*
4|e S
A
A 4 *
* ..
...;2.
S...
jS. as
.*.#
.Si1
*:**
iC :. SX s.:
':?.=:.:
&' ''' SF>'\L
.: ,*.: *:
.*., ;.
'.s.,2.: k
,_ ..
..:.Z
4 X::
..s
*.:.;....
*.
.:.:...:..
F.,:
z
t.::
i...
* * B:...t#
*.::..:-w...
;+ r;*'-t ; sy.a.*.i
#
.. *
# .: * 4 .x.
Ul
q:4
v .
.:w
-,v
o
* ,=
:,
.'t..'.'
m.-,c,,W.t., ,, .:,
.: ,. ...
....'1t'.><S';.i..
'
v
...:.:''
4 *; * ?.". ;J''.
:_ . :
* *
< '2:
*.::
:....e
'.'#** ..
.. x,;:.e
,.. 'l
s
4s
*
. D :
~~~~~~~~~~~~~~~~~~~~~~~~~~~~~~~~~~~~~~~~~~~~~~~~~~~~~~...
.. ...
;. :.
* ' t W#:. x "'''" '':~~~~4w .. ..'.,
D.
r
;
...{..00...
!00i*
000f,
9t 842*i:.s#.^H Z.;
-WW.i'i' fgt.
:..-wr
ik-'41, ..;, ;,:
40,
[image:8.612.71.568.74.461.2]40.
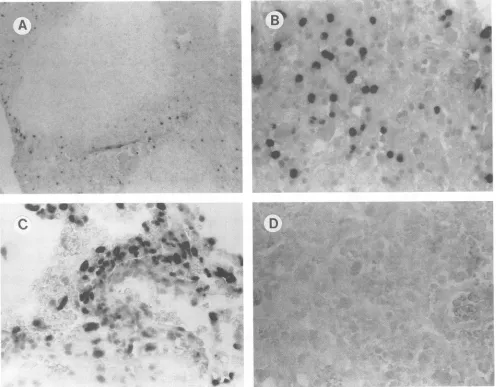
FIG. 4. Detectionof HIV-1 DNA inbrainbiopsy samplesby tissue-based PCR-driveninsituhybridization. (A) Biopsyfrompatient 6,with lymphocytes containingHIV-1 DNAsurroundinganareaof necrosis. (B) Highermagnification ofsample inpanel A, showingpredominantly
lymphocytes containingHIV-1 DNA.(C) Biopsyfrompatient 3,withperivascular macrophagesandendothelial cellscontainingHIV-1DNA.(D)
Biopsyfrompatient6amplifiedwith HIV-1 gagprimers andprobedwithabiotinylatedCMV-specific probe(negativecontrol). Magnification:
panelA, x79;panelB,
x>316;
panel C, x316;panel D, x158.blood- and brain-derived sequences were intermingled in terms of phylogenetic analysis. Interestingly, the histological examination of the infected cells from the brain tissue from patient 3revealed astrict localization of HIV-1 DNA within
perivascularmononuclear cells and occasional microglia (Fig. 4A), and a predominant localization of HIV-1 DNA in
lym-phocyteswithinan areaofnecrotizingencephalitisinpatient6 (Fig. 4B). No HIV-1-infected neurons were seen. These
pat-ternsofinfectionareconsistent withourinterpretationof the
respectivephylogenetic analysesofpatients3 and 6.
Interpatient analysisofsequencesets. In theV3region, all pairwise interpatient nucleotide sequence distances between brain-derived samples (themedian brain x braininterpatient distance is 11.8%)weresignificantly less thantheinterpatient distances between bloodsamples (themedian blood x blood interpatient distance is 15.2%). For each patient, the blood-derived consensus sequence was compared with all blood-derivedsequences fromotherpatients, and thebrain-derived consensussequencewas comparedwith all brain-derived
se-quences from other patients. The interpatient brain-derived
viral sequence distanceswerecloser in eachcase
(p
<0.0001)
for all patients except patient 4, who still was
significantly
closer inbrain-derivedviral sequences than in blood-derived
sequences compared with the other
patients
(p
=0.007).
Despite the greater conservation ofbrain-derivedviral consen-sussequences thanblood-derivedsequences between
patients,
this effect is smallcomparedwithoverall
interpatient
distance.Phylogenetic analysisshowed thatblood-orbrain-derivedviral
sequences from eachpatientcluster
together
relativetothose from the other patients and a background set of North American B subtypesequences (56), despitethe greaterlevel of conservation between brain-derived viral sequences than between blood-derived sequences (datanotshown).
Intrapa-tient clustering of consensus sequences for all patients was found in 100 of 100bootstrapreplicatesofparsimonytrees.
In the
V4-V5
region, interpatient distances between brainsamples (the median brain x brain distance is
14.1%)
wereequivalenttothe distancesbetweenblood
samples
(the
medianJ. VIROL.
Alk.
.S-.. S"'
4w
04.-.t
-P04
I* A*
c
on November 9, 2019 by guest
http://jvi.asm.org/
DIFFERENCES IN BLOOD- AND BRAIN-DERIVED HIV-1
80 90
Percent
similarity
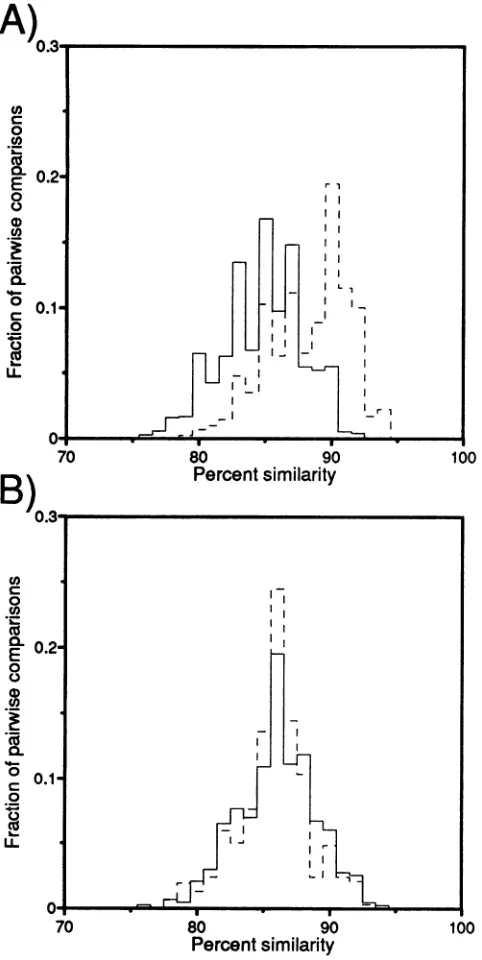
FIG. 5. Interpatient similarity distributions. (A) Distributions of
interpatient sequence similarities for V3 region samples (over the same 143 bases used for Fig. 3); (B) distribution for V4-V5 region samples (over 251 bases). As in Fig. 2, the percent similaritywas rounded offto the nearestpercentage,and thenumberontheyaxis
representsthe fraction of the totalnumber ofpairwise comparisons
that hadagiven percent similarity.Theinterpatientdistances forblood
samplesarevery similar in the tworegions,withmedians of14.2% in V3 and13.9% in V4-V5(B).Thedistribution ofinterpatient compar-isonsinbrain-derivedsequences of the V3regionissignificantly offset, however,withmedian values of11.8% ininterpatient comparisonsof brainV3sequences and14.1% inbrain V4-V5 sequences(A).
blood xblood distance is 13.9%).Thiswasincontrasttothe
relative conservationofthebrain-derived viralsequencesfrom
the V3 region. Figure 5 shows the interpatient similarity
distributions for the V3 and V4-V5 regions expressed as
histograms. The relative conservation of the V3 sequences is apparent, as the distribution of similarity scores is distinctly closer for the brain sequence comparisons. These results suggest either a convergence to or preservation ofa favored form inV3 regionbrain sequences.
V3 region signature sequence pattern of noncontiguous
amino acids. Because of the relative conservation of interpa-tient V3 region brain-derived viral DNA sequences observed between the sixpatients,weexplored the possibility of identi-fying signature amino acids that were conserved among the brain-derived viral sequences of thesix patients but variable in theblood-derived viral sequences. A simple signature (35, 37) definedbyashift in themost common amino acid in agiven position, i, inanalignment of blood sequences relative to brain was notideal for this purpose. We expected situations to arise where both the brain set and the blood set of sequences have themost commonamino acidatposition i but this position is more variable in the blood- than in the brain-derived viral sequences. Therefore, we calculated a formal measure of
variabilityateach positioniin their combined alignment: the
Shannon entropy,H(i) (see Materials and Methods) (4). The statistical significance in observed entropy differences was calculatedby usingaMonte Carlorandomization method.By
using thistechnique, signature sequence patternsof
noncon-tiguous amino acids were identical for the brain-derived
se-quences(Fig. 1).
Because a relatively conserved brain-derived HIV-1 se-quence set from a single individual may be dominating the
signaturepattern, the V3 regionbrainsignaturepattern may
have beenan artifact duetobrain sequences evolving from a
single lineageinoneof thepatients.Toexclude this possibility,
patientswereexcluded from the analysis oneby one, and six
reanalyses were done with data for only five patients; this
ensured thatsignaturepattern siteswere notdependentonany
single patient's sequences. Signature sites from the original
analysis usingall sixpatientswereincluded only if they were
selected in all six of the reanalyses. Table 2 shows the
frequency
ofsignatureamino acids inthe bloodand brainsets from each patient. Some patients show perfect or nearlyperfect conservation of a given amino acid signature site in
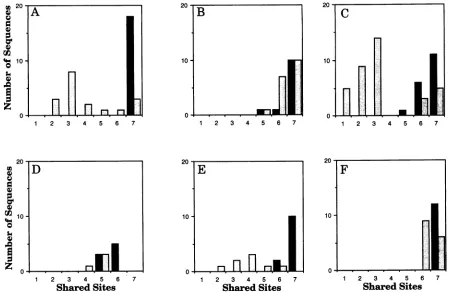
both blood- andbrain-derived sequences;thesepatientsetsare noninformative for these particular signature sites. Intact or closetointactsignature patternsarefoundinmostof the brain sequences(Fig. 6). Inthe blood sequence sets, twoclasses of viral sequences are observed: those that retain the brain
signature,and those thatdonot.Thisindicates that thesetof
viruses thatpersistsinthe brain isasubsetof the spectrum of viruses found in the blood. Nosignificantly conserved amino
acidpositions bythe criteriadescribed abovewereobserved in
the blood-derived V3 sequences or in the V4-V5 region
sequencesfrom either blood orbrain.
Net charge in the V3 loop: brain- compared with
blood-derived viral sequences.Thenetchargeon twoprotein regions
wascalculated for all sequences in this study.Weconsidered both the entire V3
loop
anda 15-amino-acidfragmentof theloop that includes the 4 amino acids at the tip of the loop
(GPGR
oritsanalog),
4amino acidsonthe N-terminal side of the tip, and 7 amino acids on the C-terminal side of the tip(corresponding
toSIPIGPGRAFYTTGE from the brain con-sensussequence shown in Fig. 1A). The interior regionwas used as well as the intact V3loop
because it encompasses elements that have beenshown tobe critically importantfor viral phenotype through mutational analysis and variation studies(11,
13, 23, 33, 64, 76,77).
Itincludes the sites which have been shown to covary and thus may be interactive in termsofstructureandfunction(39). Also,
the 15-amino-acidVOL.68,1994 7475
on November 9, 2019 by guest
http://jvi.asm.org/
[image:9.612.58.299.74.554.2]7476 KORBER ET AL.
20-B
10;
0
2 3 4 5 6 7 1 2 3 4 5 6 7 2 3 4 5 6 7
2 3 4 5 6 7 1 2 3 4 5 6 7
Shared Sites Shared Sites
20
-F
10-0~
1 2 3 4 5 6 7
Shared Sites
FIG. 6. Distribution ofblood- and brain-derivedsequencesthatshareagiven fractionof theseven-amino-acidbrainsignaturepattern. Solid
barsrepresentbrain-derivedviralsequences,andshaded bars represent blood-derivedsequences.The numberofsequences that shareagiven number ofamino acids with the brain signaturepatternareindicated. PanelsA, B, C, D, E, andFcontain data frompatients 1, 2, 3, 4, 5,and6, respectively.
tipgaveaclearer distinction than the intact V3loopwhenwe
comparedthenetchargeonthesetofsyncytium-inducingviral
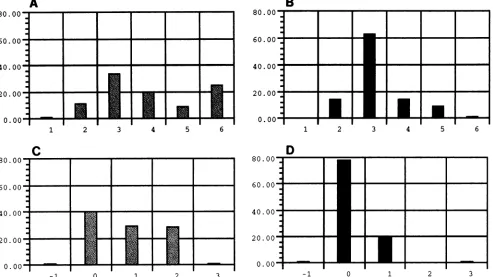
sequences with that of non-syncytium-inducing viruses pub-lishedbyFouchieretal. (23) (datanotshown).The distribu-tion ofnetchargeamongblood-derivedsequences and brain-derived sequences is shown inFig. 7. As with the syncytium-inducingcharacteristics intheFouchier data set,the internal regionwasbetterthan the intactloop fordistinguishingblood andbrainsequence setsonthe basis ofnetcharge.
DISCUSSION
Like other retroviruses, HIV-1 is characterized by a high
degree of genetic variability. The spectrum of genetically diverse variantsfoundinaviralpopulationwithinan infected individual isresponsive tothe selective forces of evolution. In primary infection, there is a relatively narrow distribution of
genetic variants (82, 83). The complex mixture of genetic variants that subsequently arise during the course of an infection(31, 38, 42, 73)results fromcompetition andselection
among the variants inresponse to immunologic pressure for
changeandalterations incelltropism andreplication efficiency (12, 32).Selectionduetocelltropism andreplication efficiency could result in discrete populations of viruses with distinct geneticandbiologic features found withinspecific tissue types
(8, 10, 18, 35, 68).
In this study, we observed a monophyletic population of brain-derivedrelativetoblood-derivedviralsequencesinfour of six patients. Phylogenetic tree analysis ofintrapatient ge-neticlineagesforpatients 1, 3, 4,and 5 showsadistinctclade
consistingof the brain-derived viralsequences,consistentwith compartmentalization of viral sequences between blood and brain tissues. These results confirm and extend observations madeby Keyset al. (35),where 8of 10intrapatientsequence
sets tended to showclustering ofcerebrospinalfluid-derived viral isolates versus blood-derived isolates (35). Further, the results of our PCR-driven in situ hybridization studies for patients3 and 6wereconsistent withourinterpretationof the genetic analyses.Theuseof viablebrainbiopsymaterial,direct
amplification of DNA without antecedentpassagein culture, and analysis ofup to 36 sequences generated from a single
patientinourdatasetallowedamorerobustcharacterization of viral sequencerelationshipsthanprevious studies(18, 35). Viralcompartmentalizationin thebrain of thesepatientsmay
have resulted from biological selection, the kinetics of viral replication, or the evolutionary dynamics of infection or be-cause the brain is an immunologically privileged site. The blood-brain barrier, composed ofspecialized capillary endo-thelial cellsjoined by highly restrictive tight junctions (27), couldnormallyinhibitthe transfer of virusbut,atsomepoint
during the infection, allow an exclusive lineage through to establish the infection of the brain tissue. Alternatively, re-strictedcellulartropismof viruses found in the brainmayonly allow growth of a selected lineage, resulting in a distinct microenvironment inthebrain.
In contrast to the distinct lineages of brain-derived viral
sequencesobserved inpatients 1, 3, 4,and5, anadmixture of blood- and brain-derivedsequenceswasobservedinpatients2 and 6. The results ofhistological examinations of the virally infected celltypesfrom thebrainbiopsyspecimens paralleled
U 20
a)
CI)
* 10 0
j)
20 G) G) a)
10
'4)
a)
~0
J.VIROL.
on November 9, 2019 by guest
http://jvi.asm.org/
[image:10.612.87.537.73.365.2]DIFFERENCES IN BLOOD- AND BRAIN-DERIVED HIV-1
80.(
60.(
40.(
20.(
0.<
80.(
60.(
40.(
20.(
A
80
60
40
20
0
0.
[image:11.612.59.552.82.359.2]-1 0 1 2 3 -1 0 1 2 3
FIG. 7. Netcharge ofV3loopsequences in the blood and in the brain. (A and B) Net chargedistribution among blood (A) and brain (B) sequences forintactV3 loop sequences.(C and D) Net charge distribution for the 15 amino acids at the tip of the V3 loop, as described in the text. Solidbarsrepresent brain-derived viral sequences, and shaded bars representblood-derived sequences. The height of the bar indicates the percentage of the total numberofsequences thathadaparticular charge, and the position onthe xaxisindicates the charge.
those of the phylogenetic analyses. A typical infection of macrophages and microgliawasobserved inpatient 3, who had a monophyletic set of brain-derived sequences. Infiltrating
lymphocytes within an area ofnecrotizing encephalitis, how-ever,wereobserved in the brainbiopsy specimenfrompatient 6.Theinfection of the CNSbyavirusadaptedtobrain tissue couldaccount forthe neurological signs andsymptoms,
neu-ropathology, and thepopulation of distinct viral genetic vari-ants observed in patient 3. The pathology associated with lymphocytes infiltratingthe brain couldaccount for theinflux of viralgenotypesfrom the bloodobservedinthebrain biopsy sample ofpatient 6. Forpatients 2 and 6, disruption of the blood-brain barrier could have occurredas a consequenceof theunderlyingdiseaseprocess orthroughbloodcontamination of the brain sample at the time of biopsy. Through using biopsy-rather thanautopsy-obtainedbraintissue, however,we have attemptedto minimize thepotentialfor blood contami-nation.Autopsybrain tissuesamples,unless takenimmediately
upon death, may be influenced by postmortem changes that cancompromise theintegrity of theblood-brain barrier.
To determine the potential for evolutionary dynamics of infection, we examined two consecutive brain samples taken with a 6-week interval from patient 6. A blood sample was taken coincident with the first brain biopsysample. Phyloge-neticreconstructions indicated that the brainsequences from the second time point were intermingled with the blood
samples from the first time point rather than the brain
sequences from the first time point (data not shown). This information isafurther indication that the distinction between theblood and brain tissuewascompromisedand that viruses werepassingbetween thetwocompartments in thispatient.
In the V3 region of the env gene, the brain-derived se-quencesweremore similar than theblood-derived sequences when comparing differences among patients. This genetic difference wasnot apparent inthe V4-V5 region. These data suggest eitherconvergence or alack ofdivergence in the V3 region among the HIV-1 sequences derived from the brain. To search foranunderlying commonality among the brain-derived viral sequences, we calculated and compared the entropy of eachaminoacid positionin theblood andbrainviral sequence
alignments.Sevennoncontiguousamino acidswereconserved
amongthebrain-derived viralstrains. Sixof thesignature sites werein the V3loop, andthe seventh was in the C2 region. This brain signature pattern was compared with sequences in the Human Retroviruses and AIDS database and found to be
highly conserved among sequences from laboratory-adapted
macrophage-tropicvirusstrains(23, 26,50, 53, 56,58, 59,76).
Some of the positions in the brain viral signature had
previ-ously been identified as important determinants for
macro-phage tropism, while other signature positions of potential
importance hadnotbeenidentifiedpreviously.Thesignature
site in the C2regionwasproximaltoan inactivatingmutation in SF13 studied by Stamatatos et al. (67). This inactivating
mutation was able to be partially compensated for by a substitution in the V3 loop (67), thusbiologically linking the
immediate vicinity of the C2region signature site to the V3
loop. Additionally, the amino acid substitutions in the tip of the V3 loop of the brain-derived viral sequences had a tendency towards lesspositive charge than theblood-derived viral sequences (Fig. 7). This charge difference was also apparent when Fouchier et al. examined
laboratory-adapted
VOL. 68, 1994 7477
on November 9, 2019 by guest
http://jvi.asm.org/
7478 KORBER ET AL.
viral strains withsyncytium-inducing and non-syncytium-induc-ing phenotypes and differences in cellular tropism (23).
The signature pattern derived from our viral sequence data set was compared with published CNS- versus non-CNS-derived viral sequences (18, 35, 50). Our signature was highly conserved in the viral sequences from brain autopsy tissue obtained from a single patient by Li et al. (50). Important
differences in sample source make our study fundamentally
distinct from those of Epstein et al. (18) and Keys et al. (35). Thesedifferences include autopsy versus biopsy, cultured virus versus direct PCR amplification from tissue samples, clinical stage and age of the patients, differences in source
(cerebro-spinal fluid versus brain samples), and viral genetic subtype
(18, 35). The signature pattern was conserved in viral se-quences from both blood and cerebrospinal fluid obtained by Keys et al. (35), with sequences retaining between five and sevenof seven of the signature pattern sites. The conservation found in sequences from this set of blood-derived viruses may have been a consequence of earlier disease stage of many of their study subjects of passage of virus in culture prior to PCR
amplification (35). Because of the integrity of the blood-brain
barrier, the virus in the cerebrospinal fluid is likely not to
reflect the virus that resides in the brain parenchyma. Among
the limited viral sequences presented in Epstein et al. (18), our signature was not particularly well conserved in brain se-quencesrelative to spleen, but this may be due to the fact that this study examined viral sequences derived from autopsy material from pediatric patients (18). Also, two of the three patients presented in Epstein et al. had indistinct phylogenetic patterns for blood and brain sequences. This situation was similartothat ofpatients 2 and 6 in our study, in whom viruses maybe trafficking between the two tissues, making it less likely for asignature pattern to be distinctive and apparent.
The hypothesis that the brain signature pattern is conserved due to constraints imposed by cell tropism for monocyte-macrophages or microglial cells is consistent with the growth characteristics of virus isolated from additional brain biopsy
specimens. The brain biopsy-derived viral isolates were
non-syncytium-inducing in mixed-donor PBMCs andreplicated to
high titer in cultured monocyte-derived macrophages (16a) as well as in primaryadult human brain cultures (16b). Others have alsoobserved similar macrophage-monocyte growth char-acteristics forbrain-derived viral samples (10, 35, 41, 50, 63). The presence of the brain signature pattern in some of the blood-derived sequences(Fig. 6) could reflect the distribution of blood-derived viruses found in PBMCs into cellular frac-tions, Tcells, and macrophage-monocyte cells.
While theoccurrenceofabrainsignature pattern might be due toconvergence, amoreplausible explanation is simply a lack ofdivergence and the preservation of certain key elements inprotein sequences. Convergence would require that the set of conserved amino acids reemerge independently in the six patients. Evidence from several studies has indicated that there canbe selection upon transmission(43, 80, 82, 83) and that the homogeneous form of the virus found before and at serocon-version tends to have sequence elements in common with macrophage-monocyte-tropic viral forms (82, 83) and that these forms tend to be relatively conserved compared with T-cell-tropic forms (54). As macrophage tropism may be a phenotypic characteristic of virus that becomes established in
the brain, the signature pattern may not have reemerged in
brain-derived viruses independently in the six patients; rather, the brain-derived viruses may retain a pattern commonly selectedattransmission. To examine this hypothesis, the brain
signaturepattern wascompared with HIV-1 sequences derived
fromrecentseroconverters(44, 79, 82, 83). It was found to be
quite wellpreserved in early seroconverters (except in onecase of a parenteral transmission route [79]). In the study byWolfs et al. (79), sequences from both donors and recipients from transmission pairs were available, and the signature was well preserved in the early seroconverterrecipients (six or sevenof seven sites retained) but variable in the donors (most donor sequences sharingonly three or four of seven signature sites). Only one of the signature amino acids was perfectly con-served in the brain sequences; the others showed some vari-ability. Thus, it is important to emphasize that signatureamino acids are not strictly required; rather, they tend to be con-served in brain samples from these six patients. Similar con-clusions have been reached by comparing conserved amino acids in key positions that are associated with macrophage-monocyte tropism in cell culture (11). Therefore, the brain signature pattern based on our data set should be used only as a guide to highlight positions that may be of biological importance; the statistical significance of the relative conser-vation of these sites is supported by our analyses. Table 2 can be used as a qualitative guide to assess the relative merit of each signature position. The signature pattern method is generally applicable and may be useful for comparing other HIV-1 sequence data sets, such as mother-infant vertical transmission pairs, samples from long-term immunological nonprogressors, virus from people who progress rapidly to disease, orviruses with different phenotypes in culture.
In conclusion, our data demonstrate that viral sequence heterogeneity exists indifferent body compartments within an infected individual. Specific charge or conformation changes in the V3 loop may contribute to the observed differences in cell tropism among the brain isolates. Within the brain, microglial cells and multinucleated cells of the monocyte-macrophage lineage are the predominant infected cell types. While neuro-pathologies commonly arise in HIV-1-infected individuals as a consequence of HIV-1 infection or opportunistic infections, other infected individuals are essentially spared the more devastating aspects of CNS infection. The difference in clinical outcome maydepend in some cases upon the host's immune response to the viruses which are able to infiltrate the CNS. Macrophage-tropic forms derived from the CNS are less susceptible to serum neutralization than T-cell-tropic forms
(8). The observation that amino acids in positions which are known to beimportant for antigenic specificity are relatively conserved among brain-derived sequences indicates that im-munotherapeutic agents against the forms commonly found infiltrating the brain may be beneficial in terms of preventing or restricting neurological disorders, by augmenting recogni-tion of these forms by the host immune surveillance mecha-nism.
ACKNOWLEDGMENTS
Wethank Gerald Myers, James Theiler, and Catherine Macken for their thoughtful advice concerning analytical methods and Kersti Maclnnesand Patricia Otto for technical support. We also thank Carla Kuikenfor her suggestions for the manuscript.
This work was supported by NIHNLAID-DOEinteragency agree-ment 3-YO1-A1-70001-11 (B.T.M.K.), the ARIEL project of the Pediatric AIDS Foundation (B.T.M.K. and S.M.W.), and Public Health Service grant 5-U01-A135039 from the National Institutes of Health (S.M.W.).
REFERENCES
1. Andeweg, A. C., P.Leeflang, A. D. M. E. Osterhaus, and M. L. Bosch.1993. Both the V2 and V3 regions of the human immuno-deficiency virus type 1 surface glycoprotein functionally interact with otherenvelope regions in syncytium formation. J. Virol. 67: 3232-3239.
J. VIROL.