Int. J. Electrochem. Sci., 4 (2009) 740 - 754
International Journal of
ELECTROCHEMICAL
SCIENCE
www.electrochemsci.org
Promethazine Potentiometric Membrane Sensor for
Promethazine Hydrochloride Pharmaceutical Analysis;
Computational Study
Mohammad Reza Ganjali,1,* Bahareh Vesimohammadi,1 Siavash Riahi,1,2 and Parviz Norouzi1 1
Center of Excellence in Electrochemistry, Faculty of Chemistry, University of Tehran, Tehran, Iran 2
Institute of Petroleum Engineering, Faculty of Engineering, University of Tehran, Tehran, Iran *
E-mail: ganjali@khayam.ut.ac.ir
Received: 4 April 2009 / Accepted: 17 April 2009 / Published: 4 May 2009
Promethazine (PM) is an antihistamine and antiemetic medication. In this study, a potentiometric liquid membrane sensor for simple and fast determination of promethazine hydrochloride in pharmaceutical formulation and urine was constructed. For the membrane preparation, PM-tetraphenylborate complexes were employed as electroactive material in the membrane. The wide linear range (10-5-10-2 mol L-1), low detection limit (1.0×10⁻⁵ mol L-1), and fast response time (~5s) are characterizations of the proposed sensors. Validation of the method shows suitability of the sensors for applies in the quality control analysis of promethazine hydrochloride in pharmaceutical formulation and urine.
Keywords: Potentiometric sensor, PVC membrane, Promethazine hydrochloride, Computational Chemistry, Chemometrics, Density functional based tight binding (DFTB)
1. INTRODUCTION
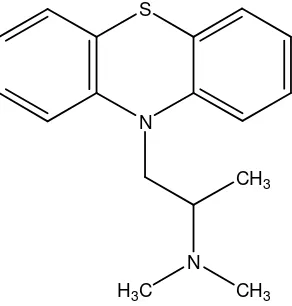
Promethazine (PM), dimethyl[1-(10H-phenothiazin-10-yl)propan-2-yl]amine, Fig. 1, is a first-generation H1 receptor antagonist, antihistamine and antiemetic medication. It can also have strong sedative effects although it is rarely used specifically for this. It is a prescription drug in the United States, but is available over the counter in the United Kingdom, Switzerland, and many other countries [1].
S
N
N
[image:2.612.233.379.67.220.2]H3C CH3 CH3
Figure 1. Chemical structure of promethazine (PM)
Different methods have been reported for the determination of promethazine in products and biological samples such as high performance liquid chromatography (HPLC) [2], the UV spectrophotometry [3,4], capillary electrophoresis [5], voltammetric method [6].
Potentiometric membrane sensors are playing an important role in pharmaceutical analysis [7-10] because of their simplicity, rapidity and accuracy over some other analytical methods like spectrophotometry and HPLC. Also, other mentioned methods are elaborate and time consuming methods and involve sophisticated equipment that might not be available in most analytical laboratories.
In present paper, interaction of promethazine with some ion-pair reagents was studied by theoretical and calculation methods and according to the obtained results a promethazine ion-selective potentiometric membrane electrode is developed based on ion-pair compound of promethazine-tetraphenylbroate (PM-TPB) as the electroactive substance. The proposed electrode was successfully applied for the determination of promethazine hydrochloride in the pharmaceutical syrup formulations and urine samples.
Computational chemistry and molecular modeling play an important role in the modern drug discovery and electrochemical science [11-17]. Computational work is also valuable in the drug development, where medium-sized organic pharmaceuticals are selected as candidates and are made in larger quantities. Instead of modeling interactions with macromolecules, the prediction of molecular properties for small molecules is more essential in the development stage.
The strength of binding usually correlates with the target molecules tendency to the ionophore, and several energy contributions may be responsible for the binding which is believed that among these energies, electrostatic interactions play dominant role in the process, at least in sequence preferences and the target molecules positioning [18].
the numbers of atoms in typical drug complexes indicate the use of these lower level calculations would be appropriate.
In this study we use density functional theory (DFT) atomic population analysis to measure a Ligand-Drug complexing by looking at the ability of the ligand to change in atomic charges and bond length of drug.
2. EXPERIMENTAL PART
2.1. Materials and Reagents
The chemical reagents (analytical grade) were: Sodium tetraphenyl borate (NaTPB), high-molecular weight polyvinylchloride (PVC), dibutyl phthalate (DBP), benzyl acetate (BA), nitrobenzene (NB), tetrahydrofuran (THF), and the chloride and nitrate salts of the used cations (Merck Co.). Promethazine hydrochloride and its syrup were obtained from different local pharmaceutical factories. All solutions were prepared using triply distilled water.
2.2. Apparatus
The glass cell, where the promethazine-selective electrode was placed, consisted of an R684 model Analion Ag/AgCl reference electrode as the internal reference electrode and a calomel electrode (SCE, Philips). Both electrodes were connected to a Corning ion analyzer with a 250 pH/mV meter with ±0.1 mV precision.
2.3. Preparation of ion-pair compound
Ion-pair compound of promethazine-tetraphenylborate (PM-TPB): About 20 mL of 0.01 mol L-1 solution of promethazine hydrochloride was mixed with 20 mL of tetraphenyl borate solution (0.01 mol L-1) under stirring. The resulting precipitate was filtered off, washed with water and dried [9,10].
2.4. Preparation of the electrodes
(1.0×10⁻³ mol L-1 promethazine hydrochloride). The electrode was finally conditioned for 24 h by soaking in a 1.0×10⁻³ mol L-1 promethazine hydrochloride solution [19-22].
2.5. Standard promethazine hydrochloride solutions
A stock solution of 10-1 mol L-1 promethazine hydrochloride was prepared by dissolving the calculated weight of pure drug in 25 mL water. The working solutions (10-6 to 10-1 mol L-1) were prepared by serial appropriate dilution of the stock solution.
2.6. The emf measurements
The following cell was assembled for the conduction of the emf (electromotive force) measurements;
Ag–AgCl |internal solution, 10-3 mol L-1 promethazine hydrochloride| PVC membrane | sample solution | Hg–Hg2Cl2, KC1 (satd.)
These measurements were preceded by the calibration of the electrode with several promethazine hydrochloride solutions (working solutions).
2.7. Computational methods
Calculations on the isolated molecules and molecular complexes were performed within GAUSSIAN 98 package [23].
Each species was initially optimized with PM3 method and, then the optimized structures were again optimized with density functional theory using the 6-31G* basis set. Full geometry optimizations and frequency calculations were performed and each species was found to be minima by having no negative values in the frequency calculation. The calculations gave internal energies at 0 K. In order to obtain gas phase free energies at 298.15 K, it is necessary to calculate the zero-point energies and thermal corrections together with entropies to convert the internal energies to Gibbs energies at 298.15 K [24, 25].
Frequency calculations on these structures verified that they were true minima and provided the necessary thermal corrections to calculate H (Enthalpy) and G (Gibbs free energy). Finally, full optimizations and frequency calculations for each species were performed with the DFT/6-31G* [26,27].
The other one-electron properties (dipole moment, polarizability, energies of the frontier molecular orbital) were also determined at the B3LYP/6-31G* level. For the charged species, the dipole moment was derived with respect to their mass center, because for the non-neutral molecules the calculated dipole moment depended on the origin of the coordinate system.
to be inherently very deficient for stacking interactions, as they basically ignore the dispersion attraction [27-29]. As a consequence; their enlargement by an empirical dispersion term currently appears to be a very reasonable way to improve the major deficiency of the DFT method for the evaluation of the molecular complexes. It should also be mentioned that the interaction energies were obtained as the difference between the complex energy and the combined energies of the molecules in isolation [30].
3. RESULTS AND DISCUSSION
3.1. Theoretical Study
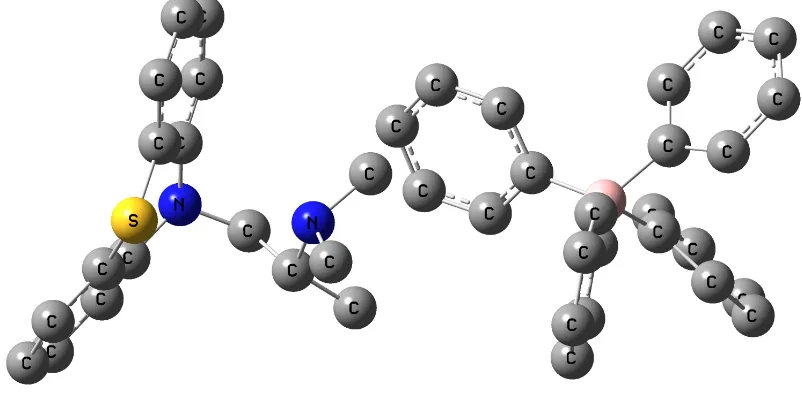
[image:5.612.162.452.336.622.2]Molecular parameters are controlled by the molecular geometry; therefore geometry optimization is the most important step for the calculation of the interaction energy. The optimized geometries and numeration of the atoms of the studied molecules, L1 for NaTPB (Fig. 2), L2 for KTpClPB, PM for Drug (Fig. 3) and Drug-L1 for PM-TPB (Fig. 4) and Drug-L2 for PM-TpClPB, are presented.
Figure 2. The full optimized structure of L1
or L2) and B (the drug) was estimated as the difference between the energy of the formed complex and the energies of the isolated partners. The interaction energies were corrected for the basis set superposition error using the counterpoise method [31,32].
∆EA–B = EA−B − EA − EB
[image:6.612.168.444.238.524.2]which obtained to be -68.052 and -57.928 Kcal/mol for ∆EL1 and ∆EL2 , respectively that indicates L1 is a more appropriate ionophore for homatropine sensor in comparison to L2, which is contributed to its higher interaction energy. The main discussions are going to be on L1-PM interaction afterward.
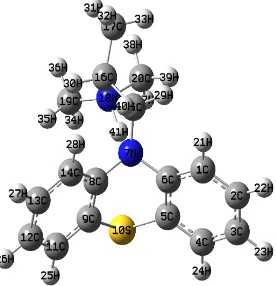
Figure 3. The full optimized structure of PM
[image:7.612.103.504.126.327.2]
bond lengths of those atoms that are bonded to them. For example, for the drug, H41 atomic charge changes from 0.316 to 0.260 along with its bond length (N18-H41) which shifted from 1.142 to 1.070.
Figure 4. The full optimized structure of L1-PM complex
Table 1. Significant computed atomic charges and bond length for promethazine before and after the complex formation
[image:7.612.222.391.418.725.2]
High values of polarizability (148.545 and 114.146 for L1 and drug, respectively) prove its effect role on interactions among L1 and the drug. While the low values of dipole-dipole interactions (especially for that of L1=0.0) show that it does not play a significant role between L1 and the studied drug. Moreover, since the studied molecules are in form of ions, electrostatic interactions should also be considered.
The highest occupied molecular orbital (HOMO) and the lowest unoccupied molecular orbital (LUMO) and for L1 and drug, calculated at the B3LYP/6-31G(d) level, are displayed in Table 1. The eigen values of LUMO and HOMO and their energy gap reflect the chemical activity of the molecule. LUMO as an electron acceptor represents the ability to obtain an electron, while HOMO as an electron donor represents the ability to donate an electron. From Table 1, the results illustrate that charge transfer interaction have between L1 and drug, because the HOMO energy of L1 close to LUMO energy of drug.
3.2. Membrane composition effect on the potential response of the sensor
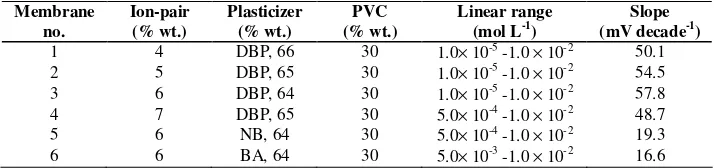
[image:8.612.127.484.460.544.2]The potential response of a sensor is greatly related to the membrane ingredients, the influence of membrane composition on the potential responses of the promethazine sensor was studied. For this purpose, different membrane compositions as shown in Table 2 were tested. As it can be seen, the membrane with the composition of 30% PVC, 6% PM-TPB, and 64% DBP (no. 3) was the optimum one in the development of this sensor. This membrane composition was selected after many considerations.
Table 2. Optimization of membrane ingredients
Membrane no.
Ion-pair (% wt.)
Plasticizer (% wt.)
PVC (% wt.)
Linear range (mol L-1)
Slope (mV decade-1)
1 4 DBP, 66 30 1.0× 10⁻⁵ -1.0 × 10⁻² 50.1
2 5 DBP, 65 30 1.0× 10⁻⁵ -1.0
× 10-2 54.5
3 6 DBP, 64 30 1.0× 10⁻⁵ -1.0 × 10⁻² 57.8
4 7 DBP, 65 30 5.0× 10⁻⁴ -1.0 × 10⁻² 48.7
5 6 NB, 64 30 5.0× 10⁻⁴ -1.0 × 10⁻² 19.3
6 6 BA, 64 30 5.0× 10⁻³ -1.0 × 10⁻² 16.6
The high promethazine extraction into the liquid membrane was a result of the elevated ion-pair tendency to exchange with the promethazine cations. From Table 2, 6 mg ion-ion-pair (PM-TPB) is the best amount for the best response.
The presence of lipophilic anions in a cation-selective membrane was also considered. As it can be seen from Table 2, the presence of such anions in a cation-selective membrane, which is based on an ion-pair, decreases the response behavior of the sensor.
3.3. pHeffect on the electrode response
In an approach to understanding the impact of pH on the electrode response, the potential was measured at two particular concentrations of the promethazine solution (1.0×10⁻³ mol L-1) from the pH value of 2.0 up to 8.5 (concentrated NaOH or HCl solutions were employed for the pH adjustment). As it can be seen from Fig. 5, the potential remained constant despite the pH change in the range of 3.5 to 6.3, indicating the applicability of this electrode in the specific pH range.
-40 -20 0 20 40 60 80
1 2 3 4 5 6 7 8 9
pH
E
(m
V
)
Figure 5. The pH effect of the test solutions (1.0×10⁻⁴ mol L-1) on the potential response of the promethazine sensor with the composition of the membrane no. 2.
On the contrary, relatively noteworthy fluctuations in the potential vs. pH behavior took place below and above the formerly stated pH limits. In detail, the fluctuation above the pH value of 6.3 might be justified by removing the positive charge on the drug molecule and the fluctuation below the pH value of 3.5 were attributed to the removing the ion-pair in the membrane.
3.4. Study of sensor properties
The properties of a potentiometric membrane sensor are characterized by parameters like these: measuring range, detection limit, response time, selectivity, lifetime, accuracy [37-40].
[image:9.612.165.435.282.462.2]
3.4.1. Measuring range
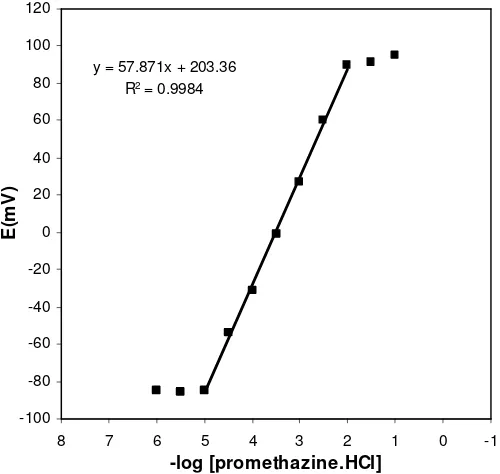
The measuring range of an ion-selective electrode includes the linear part of the calibration graph as shown in Fig. 6. Measurements can be performed in this lower range, but it must be noted that more closely spaced calibration points are required for more precise determinations. According to another definition, the measuring range of an ion-selective electrode is defined as the activity range between the upper and lower detection limits. The applicable measuring range of the proposed sensor is between 1×10⁻⁵ and 1×10⁻² mol L-1.
y = 57.871x + 203.36
R2 = 0.9984
-100 -80 -60 -40 -20 0 20 40 60 80 100 120
-1 0 1 2 3 4 5 6 7 8
-log [promethazine.HCl]
E
(m
V
)
Figure 6. Calibration curve of the promethazine membrane sensor with the composition of the membrane no. 2. The results are based on 8 measurements.
3.4.2. Detection limit
By extrapolating the linear parts of the ion-selective calibration curve, the detection limit of an ion-selective electrode can be calculated. In practice, detection limits for the most selective electrodes are in the range of 10−5–10−6 mol L-1.
In this work the detection limit of the proposed membrane sensor was 1.0×10⁻⁵ mol L-1 which was calculated by extrapolating the two segments of the calibration curve (Fig. 6).
3.4.3. Response time
[image:10.612.181.431.205.442.2][image:11.612.212.401.429.528.2]
experimental conditions-like the stirring or flow rate, the ionic concentration and composition of the test solution, the concentration and composition of the solution to which the electrode was exposed before experiment measurement was performed, any previous usages or preconditioning of the electrode, and the testing temperature have an effort on the experimental response time of a sensor [41-44].
In this work, less than 10 s response time was obtained for the proposed electrode when contacting different promethazine solutions from 1.0×10⁻⁵ to 1.0×10⁻² mol L-1.
3.4.4. Promethazine HCl electrode selectivity
The selectivity of an ion-pair based membrane electrode depends on the physico-chemical characteristics of the ion-exchange process at the membrane–sample solution interface, on the mobility of the respective ions in the membrane and on the hydrophobic interactions between the primary ion and the organic membrane [45].
The selectivity of the promethazine HCl membrane electrode is related to the free energy of transfer of the promethazine HCl cation between aqueous and organic phases. The response of the electrode towards different substances has been checked and the selectivity coefficient values
Pot AB
K were used to evaluate the interference degree. The selectivity coefficient values were obtained using the matched potential method (MPM) [46-48].
Table 3. Selectivity coefficients of various interfering compound for promethazine sensor
Interference Log KMPM
Na+ -3.93
Mg2+ -4.82
Ca2+ -4.90
K+ -4.88
Glucose -3.21
NH4+ -4.33
The steps that need to be followed for the MPM method is addition of a specified concentration of the primary ions (A, 10-2 mol L-1 of promethazine solution) to a reference solution (10-5 mol L-1 of promethazine solution), and the potential measurement. Then, the interfering ions (B, 10-2 mol L-1) are consecutively added to the same reference solution, until the measured potential matches the one obtained before the addition of the primary ions. Then, the selectivity coefficient, as defined by the matched potential method, KMPM, is equal to the ratio of the resulting primary ion activity (concentration) to the interfering ion activity, KMPM = ∆aA/aB.
3.4.5. Lifetime
The average lifetime for most of the reported ion-selective sensors is in the range of 4–10 weeks. After this time the slope of the sensor will decrease, and the detection limit will increase. The sensors were tested for 8 weeks, during which time the electrodes were used extensively (one hour per day). The proposed sensors can be used for six weeks. First, there is a slight gradual decrease in the slopes (from 57.8 to 52.3 mV decade-1) and, second, an increase in the detection limit (from 1.0×10⁻⁵ mol L-1 to 2.0×10⁻⁴ mol L-1). It is well established that the loss of plasticizer, ionic site from the polymeric film due to leaching into the sample is a primary reason for the limited lifetimes of the sensors.
3.5. Analytical application
3.5.1. Determination of promethazine in formulations
[image:12.612.96.520.429.511.2]An appropriate amount of promethazine syrup (2 mL) was transferred into a 10-mL volumetric flask. The solution was then diluted to the mark with water and the proposed electrode determined promethazine content by using the calibration method. The results for determination of promethazine amount in some pharmaceutical samples from local pharmacy are shown in Table 4. As it is seen, the results are in satisfactory agreement with the stated content on syrup.
Table 4. Resultsof promethazine assay in syrup by the promethazine membrane sensor
*The results based on three measurements.
3.5.2. Recovery of promethazine from urine samples
In order to investigate the applicability of the new sensor to determination of drug in the biological fluids, it was applied to the recovery of promethazine from urine samples. A 2.5 mL of 10-3 mol L-1 promethazine solution was transferred into a 10-mL volumetric flask. After addition of a 2.5 mL of urine samples, the solution was diluted to the mark with water. The promethazine content of the solution was then determined by the proposed electrode, using the calibration method. The recovery from three replicate measurements was found to be 103.5%, 104.4% and 105.1%, respectively.
Samples Stated content in 60 mL
Syrup
Found *
AMI-PROMETHAZINE® 60ML SYRUP-Amin 113 mg/100mL 114.2±0.4 mg/100mL
PROMETHAZINE-PAKDAROU® 113MG/100ML 113 mg/100mL 113.3±0.3 mg/100mL
PROMETHAZINE-TC® SYRUP 113 mg/100mL 114.1±0.2 mg/100mL
3.6. Validation of the method
The linearity, limit of detection, precision, accuracy, and ruggedness/robustness were the parameters which were used for the method validation.
As mentioned before, the measuring range of the promethazine sensor is between 1×10⁻⁵ and 1×10⁻² mol L-1. The detection limit of the sensor was calculated 1.0×10⁻⁵ mol L-1 (3µg/mL).
3.6.1. Precision
The parameters of the repeatability and reproducibility were investigated in order to assess the precision of the technique. For the repeatability monitoring, 10 replicate standards samples 3, 30, 300 µg/mL were measured. Then, the mean concentrations were found to be 3.03, 30.5, 303.2 µg/mL and with associated RSD values of 1.4, 1.04, and 0.42%, respectively. Regarding the inter-day precision, the same three concentrations were measured for 3 consecutive days, providing mean promethazine concentrations of 3.02, 30.5, 303.5 µg/mL and associated RSD values of 1.82, 1.02, and 0.26%, respectively.
3.6.2. Accuracy
The relevant error percentage and accuracy were calculated in each above case. The resultant concentrations were 3.02±0.04, 30.5±0.4, and 303.5±1.3 µg/mL with relevant error percentages of 3.82, 1.24, and 0.36 %, respectively.
3.6.3. Ruggedness/Robustness
For ruggedness of the method a comparison was performed between the intra- and inter-day assay results for promethazine obtained by two analysts.The RSD values for the intra- and inter-day assays of promethazine in the cited formulations performed in the same laboratory by the two analysts did not exceed 2.7%. On the other hand, the robustness wasexamined while the parameter values (pH of the eluent and the laboratory temperature) were being slightly changed. Promethazine recovery percentages were good under most conditions, not showing any significant change when the critical parameters were modified.
4. CONCLUSIONS
pair complexes along with several plasticizers in the membrane design, it was concluded that the promethazine sensor exhibited excellent analytical performance characteristics. It demonstrated an advanced performance with a fast response time (~5s), a lower detection limit of 1.0×10⁻⁵ mol L-1 and pH independent potential responses across the range of 3.5–6.3. This high sensitivity of the sensor enabled the promethazine determination in pharmaceutical analysis.
The theoretical calculations are accurate and suitable methods to obtain interaction energy and therefore choosing a better ion-pair. Additionally, employing these methods let us find centre of interactions in the target molecule and ionophore.
ACKNOWLEDGEMENTS
The authors are grateful to the Research Council of University of Tehran for the financial support of this work.
References
1. [Online] available: http://en.wikipedia.org/wiki/Promethazine
2. O. Saleh, A. El-Azzouny, H. Aboul-Enein and A. M. Badawy, Drug Dev. Ind. Pharm., 35 (2009) 19.
3. M. J. Saif and J. Anwar, Talanta, 67 (2005) 869.
4. D. Daniel and I. G. R. Gutz, Anal. Chim. Acta, 494 (2003) 215.
5. P. Kubacak, P. Mikus, I. Valaskova and E. Havranek, Methods Findings Exp. Clin. Pharmacol., 27 (2005) 529.
6. Y. N. Ni, L. Wang and S. Kokot, Anal. Chim. Acta, 439 (2001) 159.
7. M. R. Ganjali, T. Razavi, R. Dinarvand, S. Riahi and P. Norouzi, Int. J. Electrochem. Sci., 3 (2008) 1543.
8. S. Riahi, M. F. Mousavi, S. Z. Bathaie and M. Shamsipur, Anal. Chim. Acta, 548 (2005) 192. 9. M. R. Ganjali, M. Hariri, S. Riahi, P. Norouzi and M. Javaheri, Int. J. Electrochem. Sci., 4 (2009)
295.
10.M. R. Ganjali, T. Razavi, F. Faridbod, S. Riahi and P. Norouzi, Current Pharmaceutical Analysis, 5 (2009) 28.
11.S. Riahi, M. R. Ganjali, P. Norouzi and F. Jafari, Sens. Actuators B, 132 (2008) 13. 12.W. C. Ripka and G. P. Vlasuk, Annu. Rep. Med. Chem., 32 (1997) 71.
13.S. Riahi, A. B. Moghaddam, M. R. Ganjali and P. Norouzi, Spectrochim. Acta Part A, 71 (2008) 1390.
14.S. Riahi, M. R. Ganjali, A. B. Moghaddam, P. Norouzi and S. S. Hosseiny Davarani, Spectrochim. Acta Part A,70 (2008) 94.
15.S. Riahi, M. R. Ganjali, A. B. Moghaddam and P. Norouzi, J. Theor. Comput. Chem. (JTCC), 6 (2007) 331.
16.F. Faridbod, M. R. Ganjali, B. Larijani, P. Norouzi, S. Riahi and F. S. Mirnaghi, Sensors, 7 (2007) 3119.
17.H. Karami, M. F. Mousavi, M. Shamsipur and S. Riahi, J. Power Sources, 154 (2006) 298. 18.S. Riahi, M. R. Ganjali and P. Norouzi, J. Theor. Comput. Chem. (JTCC),7 (2008) 317.
19.M. R. Ganjali, Z. Memari, F. Faridbod, R. Dinarvand and P. Norouzi, Electroanalysis, 20 (2008) 2663.
21.M. R. Ganjali, P. Norouzi, R. Dinarvand, F. Faridbod and M. Moghlimi, J. Anal. Chem., 63 (2008) 684.
22.M. R. Ganjali, P. Norouzi, A. Daftari, F. Faridbod, M. Salavati-Niasari, Sens. Actuator B, 120 (2007) 673.
23.M. J. Frisch, G. W. Trucks, H. B. Schlegel, G. E. Scuseria, M. A. Robb, J. R. Cheeseman, V. G. Zakrzewski, et al.,Gaussian Inc. Pittsburgh, PA, (1998).
24.J. J. P. Stewart, J. Comp. Chem., 10 (1989) 221.
25.W. Yang and Q. Wu, Direct Method for Optimized Effective Potentials in Density-Functional Theory, Physical Review Letters, (2002).
26.R. G. Parr and W. Yang, Annu Rev. Phys. Chem.,46 (1995) 701.
27.F. B. Duijneveldt, R. J. G. C. M. Duijneveldt-van de and J. H. Lenthe, Chem. Rev., 94 (1994) 1873. 28.T. A. Nieaus, M. Elstner, T. Frauenheim and S. Suhai, J. Mol. Struct. (THEOCHEM), 541 (2001)
185.
29.H. Y. Zhou, E. Tajkhorshid, T. Frauenheim, S. Suhai and M. Elstner, Chem. Phys., 277 (2002) 91. 30.P. Hobza and R. Zahradnik, Intermolecular Complexes, Elsevier, Amsterdam,(1988).
31.M. J. Frisch, J. E. Del Bene, J. S. Binkley and H. F. Schaefer, J. Chem. Phys., 84 (1986) 2279. 32.D. W. Schwenke and D. G. Truhlar, J. Chem. Phys., 82 (1985) 2418.
33.M. R. Ganjali, P. Norouzi, F. Faridbod, S. Riahi, J. Ravanshad, J. Tashkhourian, M. Salavati-Niasari and M. Javaheri, IEEE Sens. J., 7 (2007) 544.
34.M. R.Ganjali, P. Norouzi, F. Sadat Mirnaghi, S. Riahi and F. Faridbod, IEEE Sens. J., 7 (2007) 544.
35.F. Faridbod, M. R. Ganjali, R. Dinarvand, P. Norouzi and S. Riahi, Sensors, 8 (2008) 1645. 36.S. Riahi, F. Faridbod, and M. R. Ganjali, Sensor Lett., 7 (2009) 42.
37.M. R. Ganjali, P. Norouzi, M. Rezapour, F. Faridbod, and M. R. Pourjavid, Sensors, 6 (2006) 1018.
38.M. R. Ganjali, P. Norouzi, F. Faridbod, M. Yousefi, L. Naji, and M. Salavati-Niasari, Sens. Actuators B, 120 (2007) 494.
39.F. Faridbod, M. R. Ganjali, R. Dinarvand, and P. Norouzi, Sensors, 8 (2008) 2331.
40.M. R. Ganjali, P. Norouzi, F. Faridbod, A. Sepehrifard, M. Ghandi, and A. Moghimi, Canadian J. Anal. Sci. Spec., 52 (2007) 46.
41.V. K. Gupta, A. K. Jain and G. Maheshwari, Int. J. Electrochem. Sci., 2 (2007) 102.
42.M. R. Ganjali, R. Nemati, F. Faridbod P. Norouzi, and F. Darviche, Int. J. Electrochem. Sci., 3 (2008) 1288.
43.V. K. Gupta, R. N. Goyal and R. A. Sharma, Int. J. Electrochem. Sci., 4 (2009) 156.
44.M. R. Ganjali, M. Tavakoli, F. Faridbod, S. Riahi, P. Norouzi and M. Salavati-Niassari, Int. J. Electrochem. Sci., 3 (2008) 1169.
45.V. K. Gupta, M. Al Hayat, A. K. Singh and M. K. Pal, Anal Chim Acta, 634 (2009) 36. 46.R. K. Mahajan and P. Sood, Int. J. Electrochem. Sci., 2 (2007) 832.
47.V. K. Gupta, S. Chandra, S. Agarwal and H. Lang, Sens. Actuators B, 107 (2005) 762. 48.P. R. Buck and E. Lindneri, Pure Appl. Chem., 66 (1994) 2527.