JHEP04(2017)086
Published forSISSAby SpringerReceived:September 14, 2016
Revised:January 13, 2017
Accepted:March 13, 2017
Published:April 14, 2017
Measurement of the inclusive cross-sections of single
top-quark and top-antiquark
t
-channel production in
pp
collisions at
√
s
=
13
TeV with the ATLAS detector
The ATLAS collaboration
E-mail:atlas.publications@cern.ch
Abstract: A measurement of thet-channel single-top-quark and single-top-antiquark production
cross-sections in the lepton+jets channel is presented, using 3.2 fb−1of proton-proton collision data at a centre-of-mass energy of 13 TeV, recorded with the ATLAS detector at the LHC in 2015. Events are selected by requiring one charged lepton (electron or muon), missing transverse momentum, and two jets with high transverse momentum, exactly one of which is required to be b-tagged. Using a binned maximum-likelihood fit to the discriminant distribution of a neural network, the cross-sections are determined to be σ(tq) = 156±5 (stat.) ±27 (syst.)±3 (lumi.) pb for single top-quark production andσ(¯tq) =91±4 (stat.)±18 (syst.)±2 (lumi.) pb for single top-antiquark production, assuming a top-quark mass of 172.5 GeV. The cross-section ratio is measured to be
Rt = σ(tq)/σ(¯tq) = 1.72±0.09 (stat.)±0.18 (syst.). All results are in agreement with Standard
Model predictions.
Keywords: Hadron-Hadron scattering (experiments)
JHEP04(2017)086
Contents
1 Introduction 1
2 Data and simulation samples 3
3 Object reconstruction 5
4 Event selection 6
5 Background estimation 7
6 Discrimination of signal and background events 9
7 Systematic uncertainties 10
8 Statistical analysis 14
9 Cross-section measurement 15
10 Conclusion 19
The ATLAS collaboration 26
1 Introduction
After its restart in 2015, the Large Hadron Collider (LHC) [1] has been producing proton-proton (pp) collisions at a centre-of-mass energy of √s= 13 TeV, giving the collider experiments access to a so far unexplored kinematic range. It is important to measure all accessible Standard Model (SM) processes at the new centre-of-mass energy, compare the results to the corresponding theor-etical SM predictions, and look for deviations which might result from energy-dependent non-SM couplings. In this article, inclusive cross-section measurements of the dominant single-top-quark production mechanism are presented.
JHEP04(2017)086
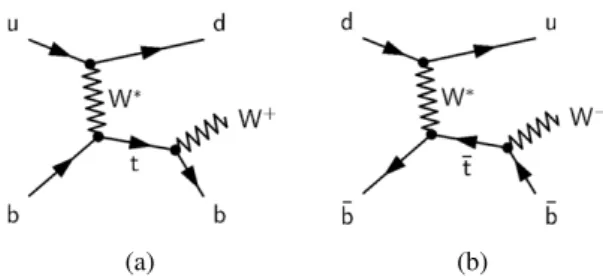
[image:3.595.194.395.84.178.2](a) (b)
Figure 1. Representative leading-order Feynman diagrams of(a)single-top-quark production and(b)
single-top-antiquark production via thet-channel exchange of a virtualW boson (W∗), including the decay of the
top quark and top antiquark, respectively.
In this article, measurements ofσ(tq) andσ(¯tq) in proton-proton collisions at a centre-of-mass energy of √s = 13 TeV are presented. The analysis is based on the ATLAS data set collected in 2015 corresponding to an integrated luminosity of 3.2 fb−1. Separate measurements oftqand ¯tq
production provide sensitivity to the parton distribution functions (PDFs) of theu-quark and thed -quark [2], exploiting the different initial states of the two processes as shown in figure1. In addition, the cross-section ratio Rt ≡ σ(tq)/σ(¯tq) is measured, featuring smaller systematic uncertainties
than the individual cross-sections because of partial cancellations of common uncertainties. In general, measurements of single top-quark production provide insights into the properties of theWtbvertex. The cross-sections are proportional to the square of the coupling at the produc-tion vertex. In the SM, the coupling is given by the Cabibbo-Kobayashi-Maskawa (CKM) matrix elementVtb[3,4] multiplied by the universal electroweak coupling constant. Non-SM
contribu-tions can be encapsulated by an additional left-handed form factor fLV [5], assumed to be real. The sensitivity for these non-SM contributions could be increased for the higher centre-of-mass energy, if there is new physics at high scales. The combined cross-sectionσ(tq+tq¯ ) is determined as the sum ofσ(tq) andσ(¯tq) and used to determine fLV · |Vtb|. All measurements presented in
this paper are based on the assumption that the production and the decay of top quarks viaWts
andWtdvertices is suppressed due to the fact that the CKM matrix elementsVtsandVtdare much
smaller thanVtb. Currently, the most precise determination of fLV· |Vtb|has an uncertainty of 4 %,
obtained from a combination of measurements performed by the CMS Collaboration [6] under the same assumption as the one stated above.
JHEP04(2017)086
In this analysis, the event selection targetstqand ¯tqevents with leptonically decayingW bo-sons. The lepton is either an electron or a muon, where events involvingW → τνdecays with a subsequent decay of the τlepton toeνeντ orµνµντ are included in the signal. The experimental
signature of selected events is thus given by one prompt isolated electron or muon, missing trans-verse momentum,EmissT , and two hadronic jets with high transverse momentum,pT,1where one of these jets originates from ab-quark (b-jet) and the second one is produced primarily in the forward direction. The presence of additional jets is vetoed to suppress background fromtt¯production.
Several other processes feature the same signature as single-top-quark events; the main back-grounds areW+jets production and top-quark-antiquark (tt¯) pair production. In order to improve the sensitivity of the signal extraction, an artificial neural network (NN) [18] is used to discriminate between signal and background events, following the same strategy that was used in comprehensive measurements oft-channel single top-quark production at √s=7 TeV [19].
This article is organised as follows. Section2gives an overview of the data and simulated event samples that are used in the analysis. The definitions of physics objects are given in section3and the event selection criteria as well as the definition of the signal and validation regions are presented in section 4. Section 5 describes the estimation of the background processes and compares the predicted kinematic distributions to data. Section 6 discusses the discriminating variables and the training and the performance of the NN used to improve the measurement sensitivity, while in section 7 the estimation of systematic uncertainties is discussed. Section 8 is devoted to the statistical analysis and section9to the measurement of the signal cross-sections and their ratio, and the extraction of fLV· |Vtb|. Finally, the conclusion is given in section10.
2 Data and simulation samples
The ATLAS experiment [20] at the LHC is a multi-purpose particle detector with a forward-backward symmetric cylindrical geometry and a near 4πcoverage in solid angle. It consists of an inner tracking detector surrounded by a thin superconducting solenoid providing a 2 T axial magnetic field, electromagnetic and hadron calorimeters, and a muon spectrometer. The inner tracking detector (ID) covers the pseudorapidity range |η| < 2.5. It consists of silicon pixel, sil-icon microstrip, and transition-radiation tracking detectors. The innermost layer of the pixel de-tector, the insertable B-layer [21], was added between Run 1 (2009-2013) and Run 2 of the LHC at a radius of 33 mm around a new and thinner beam pipe. Lead/liquid-argon (LAr) sampling calorimeters provide electromagnetic (EM) energy measurements with high granularity. A hadron (iron/scintillator-tile) calorimeter covers the central pseudorapidity range (|η| < 1.7). The endcap and forward regions are instrumented with LAr calorimeters for both the EM and hadronic energy measurements up to |η| = 4.9. The muon spectrometer surrounds the calorimeters and is based on three large air-core toroid superconducting magnets with eight coils each. Its bending power ranges from 2.0 to 7.5 T m. It includes a system of precision tracking chambers and fast detectors
1ATLAS uses a right-handed coordinate system with its origin at the nominal interaction point in the centre of the
detector and thez-axis is along the beam direction; thex-axis points towards the centre of the LHC ring and they-axis points upwards. The pseudorapidityηis defined asη=−ln[tan(θ/2)], where the polar angleθis measured with respect to thez-axis. The azimuthal angle,φ, is measured with respect to thex-axis. Transverse momentum and energy are defined aspT=psinθandET=Esinθ, respectively. The∆Rdistance in (η,φ) space is defined as∆R=
p
JHEP04(2017)086
for triggering. A two-level trigger system [22] is used to select events. The first-level trigger is implemented in hardware and uses a subset of the detector information to reduce the accepted rate to at most 75 kHz. This is followed by a software-based high-level trigger (HLT), which has access to full detector granularity and is used to further reduce the event rate to 1 kHz.
This analysis is performed using pp collision data recorded at a centre-of-mass energy of
√
s=13 TeV with the ATLAS detector in 2015 in the periods when the LHC was operating with 25 ns bunch spacing. Only the periods in which all the subdetectors were operational are con-sidered, resulting in a data sample with a total integrated luminosity ofL=3.2 fb−1.
All generated samples are passed through the simulation of the ATLAS detector [23] based on Geant4 [24]. The same offline reconstruction methods used with data events are applied to the
simulated events samples. Minimum-bias events generated by Pythia8 [25] are used to simulate
multipleppinteractions in the same and nearby bunch crossings (pile-up). The simulated pile-up events are reweighted to reproduce the luminosity spectrum in the data.
Electroweakt-channel single-top-quark production can be simulated in different schemes con-cerning the treatment of the initial b-quark. In the five-flavour scheme (5FS) the b-quarks are treated massless and the LO Feynman diagram is represented by the 2→2 process with abquark in the initial state, depicted in figure1. In the four-flavour scheme (4FS), the PDFs only contain parton distributions for the quarks lighter than theb-quark and therefore the LO Feynman diagram is represented by a 2→3 process including theg→bb¯ splitting in the initial state. In this scheme, theb-quarks are treated massive.
Signalt-channel single-top-quark events are generated in the 4FS using the Powheg-BoxV1
(r2556) [26,27] generator Events are generated with the fixed four-flavour PDF set CT10f4 [12] and the renormalisation and factorisation scales, µr, and,µf, are set following the recommenda-tion given in ref. [26]. Top quarks are decayed at LO using MadSpin to preserve all spin
cor-relations. The parton shower, hadronisation, and the underlying event are modelled using the Pythia6 (v6.428) [28] generator and the Perugia2012 set of tuned parameters (P2012 tune) [29].
In order to study effects of the choice of parton-shower model, the same events are showered using Herwig++(v.2.7.1) [30] and the energy-extrapolated underlying event set of tuned parameters
(UE-EE-5 tune) [31]. A second NLO generator capable of generatingt-channel single-top-quark events in the 4FS is MadGraph5 aMC@NLO [32] (v2.2.2). Samples are generated using the CT10f4
PDF set andµrandµfare set to be the same as those implemented in Powheg-Box. Again, the top
quarks produced in the ME are decayed using MadSpinto preserve all spin correlations. The events
are showered using Herwig++(v.2.7.1) and the UE-EE-5 tune. For the generation of SM single
top-quarks in theWtand thes-channel (tb¯+tb¯ ) the Powheg-BoxV1 (r2819) generator [33,34] with the
CT10 PDF set is used. Samples oftt¯events are generated with the Powheg-BoxV2 (r3026) [35]
and the CT10 PDF set. Thehdampparameter, which controls thepTof the first additional emission beyond the Born configuration, where its main effect is to regulate the high-pT emission against which thett¯system recoils, is set to the top-quark mass. The parton shower, hadronisation, and the underlying event are added using Pythia6 and the P2012 tune.
All top-quark processes are generated assuming a top-quark mass of 172.5 GeV. The top quark is set to decay exclusively tot→Wb, and the EvtGenv1.2.0 program [36] is used to model
JHEP04(2017)086
To model theW+jets andZ+jets background, the Sherpav2.2.0 [37] generator is used. Matrix
elements are calculated for up to two partons at NLO and up to four partons at LO using the Comix [38] and OpenLoops [39] ME generators and merged with the Sherpaparton shower [40]
using the ME+PS@NLO prescription [41]. The NNPDF 3.0 PDF set [42] is used in conjunction with dedicated parton-shower tuning developed by the Sherpaauthors.
Diboson events, denoted VV, are also simulated using the Sherpav2.1.1 generator. Matrix
elements contain all diagrams with four electroweak vertices. They are calculated for zero partons at NLO and up to three partons at LO using the same methodology as forW/Z+jets production. The CT10 PDF set is used in conjunction with dedicated parton-shower tuning developed by the Sherpaauthors.
The only background for which no simulated events are used is the multijet background. Mul-tijet events may be selected if a jet is misidentified as an isolated lepton (”fake” lepton) or if a non-prompt lepton from a hadronic decay appears to be isolated. In the electron channel, the mat-rix method is used, while in the muon channel, the so-called ‘anti-muon’ method is employed to estimate the multijet background [43]. More details are given in section5.
3 Object reconstruction
In this section, the reconstruction and selection of electrons, muons, jets andEmissT is described. Electron candidates are defined as clusters of energy deposits in the electromagnetic calori-meter associated with a well-measured track fulfilling several quality requirements [44,45]. They are required to satisfy pT > 30 GeV and |ηclus|< 2.47, where ηclus is the pseudorapidity of the cluster of energy deposits in the calorimeter. Electron candidates in the calorimeter barrel-endcap transition region 1.37 < |ηclus| < 1.52 are excluded. Isolation criteria are applied to reduce background events, in which a hadronic jet is misidentified as a prompt electron or electrons from the decay of heavy quarks. The criteria are optimised such that by adjusting the isolation threshold the selection efficiency of the isolation criteria is uniform across η. It increases from 90 % for pT = 25 GeV to 99 % for pT = 60 GeV. The pT of all tracks within a cone of size ∆R = p(∆η)2+(∆φ)2 = 0.3 around the electron direction, excluding the track belonging to the electron candidate (track isolation), is restricted to be below a threshold depending on the electron
pT. In addition, calorimeter isolation in a cone size of 0.2 around the electron is required [46]. Muon candidates are reconstructed by matching track segments or complete tracks in the muon spectrometer with inner detector tracks. The candidates are required to have a transverse mo-mentum pT > 25 GeV and to be in the pseudorapidity region |η| < 2.5. Additional requirements on the transverse impact parameter significance of |d0/σd0| < 3 and on the longitudinal impact
parameter (z0) of|∆z0sinθ| < 0.5 mm are imposed. Isolation criteria similar to those for electron candidates are imposed.
Jets are reconstructed using the anti-kt algorithm [47] with a radius parameter of 0.4. They
JHEP04(2017)086
If any jet is close to an electron, with∆R < 0.2, the closest jet is removed, as in these cases the jet and the electron are very likely to correspond to the same physical object. Remaining electron candidates overlapping with jets within∆R < 0.4 are subsequently rejected. To reduce contributions from muons which stem from heavy-flavour decays inside a jet, muons are removed if they are separated from the nearest jet by∆R <0.4. However, jets with fewer than three tracks and separated from a muon by∆R< 0.4 are removed to reduce fake jets from muons depositing a large fraction of their energy in the calorimeters.
To discriminate between jets from the hard-scatter process and those from pile-up, a discrim-inant called the jet vertex tagger (JVT) [49] is constructed from tracking and vertexing informa-tion using a two-dimensional likelihood method. The JVT variable is required to be larger than 0.64 for the jets with pT < 50 GeV and |η| < 2.4, corresponding to 92 % efficiency and 2 % misidentification rate.
In this analysis, ab-tagging algorithm based on boosted decision trees which is optimised to reject c-quark jets as well as light-quark jets is used. The b- andc-tagging efficiencies, and the mistag rate for the taggers, are measured using the methods described in refs. [50,51]. Theb -tagging algorithm has an efficiency of about 60 % forb-jets in simulatedtt¯events, while 0.06 % of light-quark jets and 4.7 % ofc-quark jets are mistagged asb-quark jets. The algorithm can only be applied to jets within the coverage of the ID, i.e.|η|<2.5.
The magnitude of the missing transverse momentum vector is defined asETmiss=|E~missT |, where
~
EmissT is calculated using the calibrated three-dimensional calorimeter energy clusters associated with the selected jets together with either the calibrated calorimeter energy cluster associated with an electron or the pT of a muon track (hard components). Contributions from soft particles, not associated with these identified particles, are accounted for using tracks associated to the vertex but not associated with a jet, electron, or muon (soft components).
4 Event selection
Events are considered only if they are accepted by at least one of two single-muon or single-electron triggers [52]. Events in the electron channel are triggered by a calorimeter cluster matched to a track, and the trigger electron object is required to have eitherET > 60 GeV orET > 24 GeV and satisfy isolation criteria. Events in the muon channel are triggered by either requiring an isolated muon with pT >20 GeV or requiring a muon withpT>50 GeV.
Only events containing exactly one isolated charged lepton (electron or muon) with pT > 30 GeV and |η| < 2.5 are accepted. Candidate events must have exactly two jets satisfying the criteria described in section 3. Jets reconstructed in the range 2.75 < |η| < 3.5, covering the endcap-forward calorimeter transition region, must havepT >35 GeV. At least one of the selected jets is required to be identified (b-tagged) as ab-jet.
In order to reduce the number of multijet background events, which are characterised by low
EmissT and lowW-boson transverse mass2 mT(`EmissT ), the event selection requiresEmissT > 30 GeV andmT(`EmissT )>50 GeV. To further suppress the multijet background a requirement on thepTof
2TheW-boson transverse mass is defined as:m
T(`EmissT )=
q
2hpT(`)ETmiss−~pT(`)·E~Tmiss
i
, where~pT(`) denotes the
JHEP04(2017)086
the charged lepton and the azimuthal angle between the charged lepton and jet is applied:
pT(`)>max 30 GeV,40 GeV·
|∆φ(j1, `)| π
!
, (4.1)
where`denotes the identified charged lepton and j1the reconstructed jet with the highest pT. Contributions from processes with two isolated leptons in the final state are suppressed by rejecting any event with an additional electron or muon as defined above satisfyingpT>10 GeV.
Three kinematic regions are defined in this analysis, all three being subject to the same event selection requiring one electron or muon, missing transverse momentum and one or two
b-tagged jets:
• The signal region (SR) is defined by using the defaultb-tagging requirement and selecting exactly oneb-tagged jet.
• The W-boson validation region (W+jets VR) requires exactly oneb-tagged jet, but with a less stringentb-tagging requirement with ab-tagging efficiency of 85 %. Events contained in the SR are rejected. The validation region is defined such, that the composition of the resulting sample is dominated by W+jets production with a purity of 77 % and the same reconstruction of the top-quark kinematics can be used as in the signal region, in order to check the modelling of kinematic variables.
• Events in the tt¯validation region (tt¯VR) are required to have exactly three jets of which exactly two areb-tagged jets using the defaultb-tagging requirement. This validation region is highly enriched intt¯events with a purity of 85 %.
5 Background estimation
For all background processes, except the multijet background, the number of expected events are obtained from Monte Carlo (MC) simulation scaled to the theoretical cross-section predictions. The associated production of an on-shell W boson and a top quark (Wt) has a predicted produc-tion cross-secproduc-tion of 71.1 pb [15] calculated at approximate NNLO accuracy. Predictions of the
s-channel production are calculated at NLO using the same methodology as for thet-channel pro-duction and yield a cross-section of 10.3 pb. The predictedtt¯cross-section isσtt¯ = 831.8 pb. It has been calculated at NNLO in QCD including resummation of next-to-next-to-leading logar-ithmic (NNLL) soft gluon terms with top++2.0 [53–58]. All quoted cross-sections are given for
mtop =172.5 GeV. The inclusive cross-sections ofW+jets andZ+jets production are calculated at NNLO with FEWZ [59]. Diboson events are normalised to the NLO cross-section provided by the Sherpagenerator.
The matrix method [43] is used to determine the multijet background in the electron channel. This method estimates the number of multijet background events in the signal region by applying efficiency factors to the number of events passing the signal tight and a loose lepton selection, the former selection being a subset of the latter. The number of multijet eventsNfaketightpassing the signal requirements can be expressed as
Nfaketight = fake real−fake
JHEP04(2017)086
where real and fake are the efficiencies for real and fake loose leptons being selected as tight leptons, Nloose is the number of selected events in the loose sample, and Ntight is the number of selected events in the signal sample. The fake-lepton efficiencies are determined from a data sample dominated by non-prompt and fake-lepton background events. This sample is selected by requiring exactly one loose lepton and lowEmissT as well as lowmT(`ETmiss). The real-lepton efficiencies are also estimated from collision data using a “tag-and-probe” method inZ →eeevents.
Multijet-background events containing non-prompt muons are modelled with a sample of events enriched in non-isolated muons [43]. Most of these events originate fromb-hadron orc -hadron decays in jets. These events pass the same kinematic requirements as the events of the signal sample. Only some of the muon identification cuts are modified, ensuring that there is no overlap with the signal selection. The normalisation is determined using a binned maximum-likelihood fit.
The fit is performed to the observed data in themT(`ETmiss) distribution after applying all se-lection criteria, except the requirement on mT(`EmissT ). The multijet template is fit together with templates derived from MC simulation for all other processes. The rate uncertainties are accounted for in the fitting process in the form of additional constrained nuisance parameters. For the purpose of this fit, three different template distributions are used. One template is built from simulated
W+jets events, one consists of events fromtt¯and single top-quark production, and one consists of contributions fromZ+jets andVVproduction. As the shape of the joint template ofZ+jets andVV
events is very similar to that ofW+jets events, the rates are fixed in the fitting process.
The estimated event rates obtained from the binned maximum-likelihood fit for the combined contributions ofW+jets,tt¯and single top-quark production are not used in the later analysis and are only applied to scale the respective processes in order to check the modelling of the kinematic distributions. For the neural-network training, as well as for the final statistical analysis, the norm-alisation for all but the multijet background is taken from MC simulations scaled to their respective cross-section predictions.
In the signal region, 34459 events in the `+ channel and 31056 events in the `− channel are observed in data, while the expected SM background amounts to 33600±2600 events and 30200±2300 events, respectively. The quoted uncertainties are statistical uncertainties and the uncertainty in the number of multijet events. Table 1 summarises the event yields in the signal region for each of the background processes considered together with the event yields for the sig-nal process. The yields are calculated using the acceptance from MC samples normalised to their respective theoretical cross-sections including the (N)NLOKfactors.
JHEP04(2017)086
Process `+channel `−channel
tq 4 200± 170 8± 3
¯
tq 5± 2 2 710± 140
tt¯ 13 100± 790 13 100± 790
Wt 1 640± 110 1 640± 110
tb¯+tb¯ 298± 25 199± 18
W++jets 10 500±2 200 <1
W−+jets <1 8 730±1 800
Z,VV+jets 1 530± 320 1 410± 300 Multijets 2 400±1 200 2 400±1 200
[image:10.595.184.411.81.270.2]Total expected 33 600±2 600 30 200±2 300 Data observed 34 459 31 056
Table 1. Predicted and observed event yields for the signal region. The quoted uncertainties include
uncer-tainties in the theoretical cross-sections, in the number of multijet events, and the statistical unceruncer-tainties.
6 Discrimination of signal and background events
To separatet-channel single-top-quark signal events from the background, several kinematic vari-ables are combined into one discriminant by employing a neural network [18,60]. A large number of potential input variables were studied, including kinematic variables of the identified physics objects, as well as variables obtained from the reconstruction of theWboson and the top quark. A detailed description of the algorithm including the reconstruction of the longitudinal component of the neutrino momentum is given in ref. [19]. As a compromise between the discrimination power and the need for a manageable number of variables, the ten highest-ranking variables are chosen and are listed in table2. The two most discriminating variables are the reconstructed top-quark massm(`νb) and the invariant mass of the two jetsm(jb). Figures2(a)and2(b)show them(lνb) andm(jb) distributions (normalised to unit area) in the SR for the `+channel. Figures 2(c)–2(f)
show them(lνb) andm(jb) distributions in theW+jets VR andtt¯VR for the`+channel. In thett¯ VR theb-jet used to calculatem(lνb) andm(jb) is theb-jet with the higher pT. The distributions from the different processes, apart from the multijet background in the electron channel, are nor-malised to match the number of observed events. In the case of the electron channel, the relative contribution of each simulated process is estimated using its predicted cross-section. In the case of the muon channel, the distributions are normalised to the expected number of events obtained from the fit to themT(`EmissT ) distributions described in section5. Satisfactory agreement is seen between the data and the predictions.
JHEP04(2017)086
Variable Definition
m(`νb) top-quark mass reconstructed from the charged lepton, neutrino, andb-tagged jet
m(jb) invariant mass of theb-tagged and untagged jet
mT(`EmissT ) transverse mass of the reconstructedWboson |η(j)| modulus of the pseudorapidity of the untagged jet
m(`b) invariant mass of the charged lepton (`) and theb-tagged jet
η(`ν) rapidity of the reconstructedWboson
∆R(`νb,j) ∆Rof the reconstructed top quark and the untagged jet
cosθ∗(`, j) cosine of the angleθ∗between the charged lepton and the untagged jet in the rest frame of the reconstructed top quark
[image:11.595.112.493.82.280.2]∆pT(`νb,j) ∆pTof the reconstructed top quark and the untagged jet ∆R(`, j) ∆Rof the charged lepton and the untagged jet
Table 2. The ten variables that are used in the training of the neural network ordered by their discriminating
power as determined by Neurobayes [19,60].
7 Systematic uncertainties
Systematic uncertainties in the normalisation of the individual backgrounds and in the signal ac-ceptance as well as uncertainties in the shape of the NN discriminant distribution of the individual predictions affect the individual top-quark and top-antiquark cross-section measurements and their ratio. The uncertainties are split into the following categories.
Reconstruction efficiency and calibration uncertainties. Systematic uncertainties affecting the reconstruction and energy calibration of jets, electrons, and muons are propagated through the ana-lysis. The dominant source for this measurement arises from the jet energy scale (JES) calibration, including the modelling of pile-up, and from theb-jet tagging efficiencies.
The uncertainties due to lepton reconstruction, identification and trigger efficiencies are estim-ated using tag-and-probe methods inZ → ``events. Correction factors are derived to match the simulation to observed distributions in collision data and associated uncertainties are estimated. To estimate uncertainties in the lepton momentum scale and resolution, also Z → ``events are used [61–63]. The lepton-charge misidentification is estimated with simulated events and found to be below 0.1 %, see table1. The uncertainty on the lepton-charge misidentification is evaluated and found to be negligible.
JHEP04(2017)086
b) [GeV] ν
l
m(
100 200 300 400 500
Fraction of events / 20 GeV 0 0.1 0.2 0.3 tq b ,Wt,t t t +jets + W Multijet SR + l Simulation
ATLAS s = 13 TeV
(a)
m(jb) [GeV]
0 200 400 600
Fraction of events / 30 GeV 0 0.1 0.2 tq b ,Wt,t t t +jets + W Multijet SR + l Simulation
ATLAS s = 13 TeV
(b)
b) [GeV]
ν
l m(
Events / 20 GeV
0 5000 10000 15000 b) [GeV] ν l m(
100 200 300 400 500
Pred.
Data 0.81
1.2 W+jets VR + l ATLAS -1 3.2 fb , =13 TeV s Data tq b ,Wt,t t t +jets + W +jets VV , Z Multijet Stat. + Multijet unc.
(c)
m(jb) [GeV]
Events / 30 GeV
0 5000 10000 15000
m(jb) [GeV]
0 200 400 600
Pred.
Data 0.81 1.2 W+jets VR + l ATLAS -1 3.2 fb , =13 TeV s Data tq b ,Wt,t t t +jets + W +jets VV , Z Multijet Stat. + Multijet unc.
(d)
b) [GeV]
ν
l m(
Events / 20 GeV
0 500 1000 1500 2000 b) [GeV] ν l m(
100 200 300 400 500
Pred.
Data 0.81 1.2 VR t t + l ATLAS -1 3.2 fb , =13 TeV s Data tq b ,Wt,t t t +jets + W +jets VV , Z Multijet Stat. + Multijet unc.
(e)
m(jb) [GeV]
Events / 30 GeV
0 500 1000 1500 2000 m(jb) [GeV]
0 200 400 600
Pred.
Data 0.81 1.2 VR t t + l ATLAS -1 3.2 fb , =13 TeV s Data tq b ,Wt,t t t +jets + W +jets VV , Z Multijet Stat. + Multijet unc.
[image:12.595.101.494.95.610.2](f)
Figure 2. Distributions of the two most discriminating variables, (left) the reconstructed top-quark mass
m(`νb) and (right) the invariant mass of the jet pairm(jb), for the`+channel. In thett¯VR theb-jet used to calculatem(lνb) andm(jb) is theb-jet with the higherpT. (a)-(b): signal and background distributions
JHEP04(2017)086
NN
o
0 0.2 0.4 0.6 0.8 1
Fraction of events / 0.1
0 0.1 0.2
0.3 tqtb
Wt t t +jets + W Multijet SR +
l Simulation
ATLAS s = 13 TeV
(a)
NN
o
0 0.2 0.4 0.6 0.8 1
Fraction of events / 0.1
0 0.1 0.2
0.3 ttqb
Wt t t +jets -W Multijet SR
-l Simulation
ATLAS s = 13 TeV
(b)
NN o
Events / 0.1
0 5000 10000 15000 20000 NN o
0 0.2 0.4 0.6 0.8 1
Pred.
Data 0.81 1.2 W+jets VR + l ATLAS -1 3.2 fb , =13 TeV s Data tq b ,Wt,t t t +jets + W +jets VV , Z Multijet Stat. + Multijet unc.
(c)
NN
o
Events / 0.1
0 5000 10000 15000 NN o
0 0.2 0.4 0.6 0.8 1
Pred.
Data 0.81 1.2 W+jets VR -l ATLAS -1 3.2 fb , =13 TeV s Data q t b t ,Wt, t t +jets -W +jets VV , Z Multijet Stat. + Multijet unc.
(d)
NN o
Events / 0.1
0 1000 2000 3000 NN o
0 0.2 0.4 0.6 0.8 1
Pred.
Data 0.81 1.2 VR t t + l ATLAS -1 3.2 fb , =13 TeV s Data tq b ,Wt,t t t +jets + W +jets VV , Z Multijet Stat. + Multijet unc.
(e)
NN
o
Events / 0.1
0 1000 2000 3000 NN o
0 0.2 0.4 0.6 0.8 1
Pred.
Data 0.81 1.2 VR t t -l ATLAS -1 3.2 fb , =13 TeV s Data q t b t ,Wt, t t +jets -W +jets VV , Z Multijet Stat. + Multijet unc.
[image:13.595.99.489.93.616.2](f)
Figure 3. Distributions of the NN discriminantONN(left) for the`+channel and (right) for the`−channel.
JHEP04(2017)086
resolution measurement [66]. The effect of uncertainties associated with the JVT requirement is also considered.
The impact of a possible miscalibration on the soft track component ofEmissT is derived from data-MC comparisons of thepTbalance between the hard and softEmissT components.
Since the analysis makes use ofb-tagging, the uncertainties in theb- andc-tagging efficiencies and the mistag rate are taken into account. These uncertainties were determined using √s=8 TeV data as described in ref. [51] forb-jets and ref. [50] forc-jets and light jets, with additional uncer-tainties to account for the presence of the newly added Insertable B-Layer and the extrapolation to √s=13 TeV.
Monte Carlo generators. Systematic effects from MC modelling of the signal and thett¯ back-ground process are either estimated by comparing different generators or by comparing parameter variations in the Powheg-Box+Pythia6 setup. The Powheg-Box+Herwig++sample is used for
parton shower and hadronisation modelling studies, while MadGraph5 aMC@NLO +Herwig++
is used for studies of the NLO-matching method. Variations of the amount of additional radiation are studied by changingµr and µf and the scales in the parton shower simultaneously. In these samples, an up-variation of µr andµf by a factor of two is combined with the P2012 tune with lower radiation (P2012radLo tune) than the nominal P2012 set, and a variation of both scales by a factor of one half is combined with the P2012 tune with higher radiation (P2012radHi tune). In the case of the up-variation oftt¯production, thehdampparameter is also changed and set to two times the top-quark mass [67].
The uncertainty in the pile-up reweighting as well as the statistical uncertainties of the simu-lated event samples are also taken into account.
PDF. The systematic uncertainties in the signal and background acceptance related to the parton distribution functions are taken into account for all single-top-quark processes andtt¯production. The procedure follows the updated PDF4LHC recommendation [68] by using the 30 eigenvectors of the PDF4LHC15 NLO PDF set. The events are reweighted according to each of the PDF un-certainty eigenvectors. In addition, the acceptance difference between PDF4LHC15 and CT10 is considered, since the latter PDF set is used in the MC samples and is not covered by the uncertainty obtained with PDF4LHC15 PDF sets.
Background normalisation. Thett¯,Wt andtb¯ backgrounds are normalised to their theory pre-dictions, where a combined uncertainty of 6 % is derived from the weighted average of the indi-vidual uncertainties. The PDF- andαs-induced uncertainties for thett¯process are calculated using the PDF4LHC prescription [9] with the MSTW2008 68 % CL NNLO, CT10 NNLO and NNPDF PDF sets and added in quadrature to the uncertainty due to the scale, leading to a total uncer-tainty of 5.5 %. The unceruncer-tainty in theWtcross-section, calculated at approximate NNLO, is the sum in quadrature of the effects of the PDF uncertainty obtained using the MSTW2008 68 % CL NNLO PDF sets and the scale uncertainty, and is found to be 5.4 %. The s-channel production cross-section is calculated at NLO with a total uncertainty of 3.8 %.
For the W+jets and Z+jets backgrounds, an uncertainty of 21 % is assigned. This uncer-tainty is estimated based on parameter variations in the generation of the Sherpasamples. It was
JHEP04(2017)086
impact on the kinematic distributions and produces change covering the unfolded data and their uncertainties [69].
Diboson processes have an uncertainty of 6 % in the inclusive cross-section including uncer-tainties on the choice of the factorisation and renormalisation scales and the PDF uncertainty.
The multijet background estimate has an uncertainty of 50 %, based on comparisons of the rates obtained using alternative methods described in previous analyses [19,43,70].
Luminosity and beam energy. The uncertainty in the integrated luminosity is ±2.1 %. It is derived, following a methodology similar to that detailed in refs. [71] and [72], from a calibration of the luminosity scale usingx–ybeam-separation scans performed in August 2015. Given the level of precision of the measurement the uncertainty in the beam energy is negligible for this analysis.
All systematic uncertainties discussed above cause variations in the signal acceptance, the background rates and the shape of the NN discriminant distribution. Both the rate and shape un-certainties are taken into account by generating correlated pseudo-experiments as detailed in the next section.
8 Statistical analysis
To extract the top-quark and top-antiquark inclusive cross-sections, a binned maximum-likelihood fit to the NN discriminant distribution is performed in the `+ channel and `− channel, treating
t-channel top-quark andt-channel top-antiquark production as independent processes. The likeli-hood function used is built from Poisson probability terms and includes Gaussian priors to constrain the rates of the W+jets and top-quark background processes; more details are given in ref. [19]. The fit parameters of the likelihood function are scale factors,βi, that multiply the expected value
of the number of events, νi, for each fitted processi. The background normalisation constraints
are 21 % for W+jets production, and 6 % for top-quark backgrounds (tt¯, Wt andtb¯ +tb¯ ), while the contributions from Z+jets, VV, and multijet processes are fixed to their predictions. The fitted rates of the W+jets background and the top-quark backgrounds are mainly driven by the background-dominated region with lowONNvalues. The cross-section ratio is subsequently com-puted asRt =σ(tq)/σ(¯tq).
The fit finds the minimum of the negative log-likelihood function for the parameter values shown in table3. Figure4compares the observed NN discriminant distributions to the compound model of signal and backgrounds with each contribution normalised to the fit results from table3. The three most discriminating variables are presented in figure5. The model agrees with the data, within uncertainties.
back-JHEP04(2017)086
Process βˆ νˆ(`+) νˆ(`−)
tq 1.15±0.03 4 840±140 –
¯
tq 1.12±0.05 – 3 040±130
tt,¯Wt,tb¯ +tb¯ 0.91±0.03 13 700±510 13 600±510
W++jets 1.13±0.05 12 000±550 –
W−+jets 1.21±0.06 – 10 500±550
Z,VV+jets – 1 530 1 410
Multijet background – 2 420 2 420
Total estimated – 34 500±760 31 000±760
[image:16.595.145.452.83.252.2]Total observed – 34 459 31 056
Table 3. Estimated scale factors, ˆβ, and number of events, ˆν =βˆ·ν, for the`+and`−channel from the
minimisation of the likelihood function. The quoted uncertainties in ˆβand ˆνinclude the statistical uncertainty and the uncertainties from the constraints on the background normalisation as used in the likelihood function.
NN
o
Events / 0.1
0 5000 10000
NN
o
0 0.2 0.4 0.6 0.8 1
Pred.
Data 0.81 1.2 SR + l ATLAS -1 3.2 fb , =13 TeV s Data tq b ,Wt,t t t +jets + W +jets VV , Z Multijet Post-fit unc. (a) NN o
Events / 0.1
0 5000 10000
NN o
0 0.2 0.4 0.6 0.8 1
Pred.
Data 0.81 1.2 SR -l ATLAS -1 3.2 fb , =13 TeV s Data q t b t ,Wt, t t +jets -W +jets VV , Z Multijet Post-fit unc. (b)
Figure 4. NN discriminant distribution(a)for the`+ channel and(b) for the`− channel in the SR. The
signal and backgrounds are normalised to the fit result and the hatched and grey error bands represent the post-fit uncertainty. The ratio of observed to predicted (Pred.) number of events in each bin is shown in the lower histogram.
ground rates as obtained from the maximum-likelihood fit to the observed collision data. Uncertain-ties in the extrapolation to the full phase space are included in the generator-related uncertainUncertain-ties.
9 Cross-section measurement
After performing the binned maximum-likelihood fit to the NN discriminant distribution and estim-ating the total uncertainty, the inclusive cross-sections of top-quark and top-antiquark production in thet-channel are measured to be:
σ(tq)=156±5 (stat.)±27 (syst.)±3 (lumi.) pb
σ(¯tq)=91±4 (stat.)±18 (syst.)±2 (lumi.) pb
[image:16.595.101.487.315.486.2]JHEP04(2017)086
b) [GeV]
ν l
m(
Events / 20 GeV
0 2000 4000 6000 b) [GeV] ν l m(
100 200 300 400 500
Pred.
Data 0.81 1.2
SR
+
l
ATLAS s=13 TeV, 3.2 fb-1
Data tq b ,Wt,t t t +jets + W +jets VV , Z Multijet Post-fit unc. (a) b) [GeV] ν l m(
Events / 20 GeV
0 2000 4000 6000 b) [GeV] ν l m(
100 200 300 400 500
Pred.
Data 0.81 1.2
SR
-l
ATLAS s=13 TeV, 3.2 fb-1
Data q t b t ,Wt, t t +jets -W +jets VV , Z Multijet Post-fit unc. (b) m(jb) [GeV]
Events / 30 GeV
0 2000 4000 6000 8000 m(jb) [GeV]
0 200 400 600
Pred.
Data 0.81 1.2
SR
+
l
ATLAS s=13 TeV, 3.2 fb-1
Data tq b ,Wt,t t t +jets + W +jets VV , Z Multijet Post-fit unc. (c) m(jb) [GeV]
Events / 30 GeV
0 2000 4000 6000 8000 m(jb) [GeV]
0 200 400 600
Pred.
Data 0.81 1.2
SR
-l
ATLAS s=13 TeV, 3.2 fb-1
Data q t b t ,Wt, t t +jets -W +jets VV , Z Multijet Post-fit unc. (d) ) [GeV] miss T E l ( T m
Events / 10 GeV
0 5000 10000 ) [GeV] miss T E l ( T m
0 50 100 150 200
Pred.
Data 0.81 1.2
SR +
l
ATLAS s=13 TeV, 3.2 fb-1
Data tq b ,Wt,t t t +jets + W +jets VV , Z Multijet Post-fit unc. (e) ) [GeV] miss T E l ( T m
Events / 10 GeV
0 2000 4000 6000 8000 ) [GeV] miss T E l ( T m
0 50 100 150 200
Pred.
Data 0.81 1.2
SR
-l
ATLAS s=13 TeV, 3.2 fb-1
[image:17.595.103.491.95.635.2]Data q t b t ,Wt, t t +jets -W +jets VV , Z Multijet Post-fit unc. (f)
Figure 5. Distributions of the three most important variables (left) for the`+channel and (right) for the`−
channel normalised to the fit result. (a)-(b): reconstructed top-quark massm(`νb),(c)-(d): invariant mass of the jet pairm(jb),(e)-(f): transverse mass of theW bosonmT(`EmissT ). The hatched and grey error bands
JHEP04(2017)086
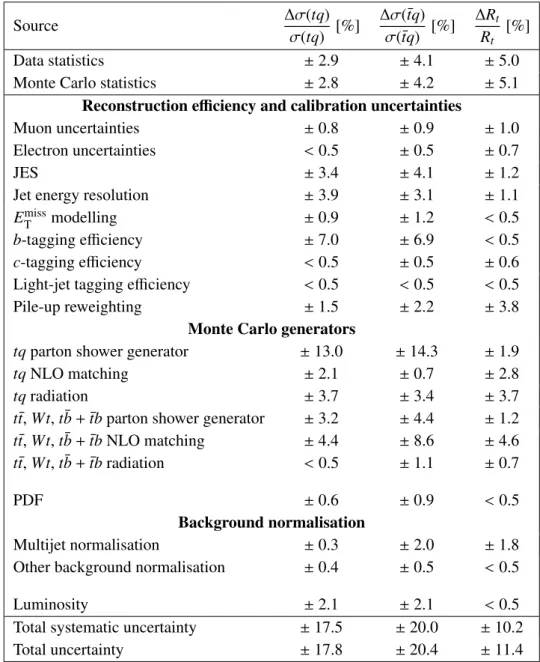
Source ∆σ(tq)
σ(tq) [%]
∆σ(¯tq)
σ(¯tq) [%]
∆Rt
Rt
[%]
Data statistics ±2.9 ±4.1 ±5.0
Monte Carlo statistics ±2.8 ±4.2 ±5.1
Reconstruction efficiency and calibration uncertainties
Muon uncertainties ±0.8 ±0.9 ±1.0
Electron uncertainties <0.5 ±0.5 ±0.7
JES ±3.4 ±4.1 ±1.2
Jet energy resolution ±3.9 ±3.1 ±1.1
EmissT modelling ±0.9 ±1.2 <0.5
b-tagging efficiency ±7.0 ±6.9 <0.5
c-tagging efficiency <0.5 ±0.5 ±0.6 Light-jet tagging efficiency <0.5 <0.5 <0.5
Pile-up reweighting ±1.5 ±2.2 ±3.8
Monte Carlo generators
tqparton shower generator ±13.0 ±14.3 ±1.9
tqNLO matching ±2.1 ±0.7 ±2.8
tqradiation ±3.7 ±3.4 ±3.7
tt¯,Wt,tb¯ +tb¯ parton shower generator ±3.2 ±4.4 ±1.2
tt¯,Wt,tb¯ +tb¯ NLO matching ±4.4 ±8.6 ±4.6
tt¯,Wt,tb¯ +tb¯ radiation <0.5 ±1.1 ±0.7
PDF ±0.6 ±0.9 <0.5
Background normalisation
Multijet normalisation ±0.3 ±2.0 ±1.8
Other background normalisation ±0.4 ±0.5 <0.5
Luminosity ±2.1 ±2.1 <0.5
Total systematic uncertainty ±17.5 ±20.0 ±10.2
[image:18.595.114.480.83.525.2]Total uncertainty ±17.8 ±20.4 ±11.4
Table 4. List of systematic uncertainties contributing to the total uncertainty in the measured values ofσ(tq),
σ(¯tq), andRt =σ(tq)/σ(¯tq). The estimation of the systematic uncertainties has a statistical uncertainty of 0.3 %. Uncertainties contributing less than 0.5 % are marked with “<0.5”.
assuming a top-quark mass ofmtop = 172.5 GeV. Figure6compares the measured value ofRt to
con-JHEP04(2017)086
t R
1.2 1.3 1.4 1.5 1.6 1.7 1.8 1.9 2
ABM (5 flav.)
ATLAS epWZ12
CT14
HERAPDF 2.0
JR14 (VF)
MMHT2014
NNPDF 3.0
-1 =13 TeV, 3.2 fb s
ATLAS
Measurement result
syst. ⊕
[image:19.595.135.457.78.301.2]stat. stat.
Figure 6. Comparison between observed and predicted values ofRt = σσ¯tt. Predictions are calculated at
NLO precision [7,8] in the five-flavour scheme and given for different NLO PDF sets. The uncertainty includes the uncertainty in the renormalisation and factorisation scales, as well as the combined internal PDF andαsuncertainty. The dotted black line indicates the measured value. The combined statistical and
systematic uncertainty of the measurement is shown in green, while the statistical uncertainty is represented by the yellow error band. Predictions for all presented PDF sets are within the statistical uncertainty of the measurement.
fidence levels. Uncertainties in the predicted values include the uncertainty in the renormalisation and factorisation scales and the combined PDF andαsuncertainty of the respective PDF set. All PDF predictions are in agreement with the measurement.
For the purpose of determining fLV· |Vtb|, the measured inclusive cross-sections of thetqand
the ¯tqprocess are combined, assuming that each uncertainty is 100 % correlated between the two channels. The statistical uncertainty of the data and the uncertainty due to the limited size of the MC samples, are treated as uncorrelated. The combined cross-section is calculated to be:
σ(tq+tq¯ )=247±6 (stat.)±45 (syst.)±5 (lumi.) pb
=247±46 pb.
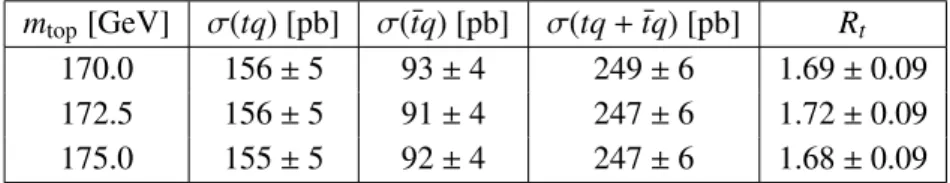
To estimate the dependence of the measured cross-sections on the assumed top-quark mass, simulated samples with mtop = 170 GeV and mtop = 175 GeV are used. The measurement is repeated for each top-quark mass. In table5, the measured cross-sections and their ratio are given. Single top-quark production in the t-channel proceeds via a Wtb vertex and the measured cross-section is proportional to (fLV·|Vtb|)2as discussed in section1. The fLV·|Vtb|measurement via
single top-quark production is independent of assumptions about the number of quark generations or about the unitarity of the CKM matrix. The assumptions made are:|Vtb|is much bigger than|Vtd|
and|Vts|, which is in agreement with the measurement ofR=B(t→Wb)/Pq=d,s,bB(t→Wq) [81],
left-JHEP04(2017)086
mtop[GeV] σ(tq) [pb] σ(¯tq) [pb] σ(tq+tq¯ ) [pb] Rt [image:20.595.139.454.85.145.2]170.0 156±5 93±4 249±6 1.69±0.09 172.5 156±5 91±4 247±6 1.72±0.09 175.0 155±5 92±4 247±6 1.68±0.09
Table 5. Measured values of the cross-sectionsσ(tq),σ(¯tq),σtot(tq+tq¯ ), andRt for different simulated
top-quark masses. The quoted uncertainties are statistical only.
handed weak coupling like that in the SM. A strategy to relax the first two assumptions and account for production and decay of top quarks viaWtsandWtdvertices is delineated in Ref. [82].
The value of fLV· |Vtb|is extracted by dividing the measured σ(tq+tq¯ ) = 247±46 pb by
its value predicted at NLO,σth(tq+tq¯ ) = 217±10 pb. Changes in fLV· |Vtb|also affectWtand
tb¯ +tb¯ production. However, their contributions are small and their variation does not change the
t-channel fit result. The result obtained is
fLV· |Vtb|=1.07±0.01 (stat.)±0.09 (syst.)±0.02 (theor.)±0.01 (lumi.)
=1.07±0.09.
The experimental uncertainty is 0.09, including the statistical uncertainty, the systematic uncer-tainties, and the uncertainty in the luminosity. The theoretical uncertainty is 0.02, including scale uncertainties and PDF uncertainties.
Setting fLV =1 as required by the SM, and assuming a uniform prior of one in |Vtb|2 in the
interval [0,1] and a Gaussian-shaped likelihood curve for |Vtb|2, a Bayesian lower limit giving
|Vtb|>0.84 at 95 % CL, is obtained.
10 Conclusion
A measurement of the t-channel single-top-quark and single-top-antiquark production cross-sections is performed in events with a leptonically decayingWboson with 3.2 fb−1ofppcollision data at √s = 13 TeV recorded with the ATLAS detector at the LHC in 2015. Events are selected by requiring exactly one electron or muon, missing transverse momentum, and two jets with high transverse momentum, exactly one of which is required to beb-tagged.
A binned maximum-likelihood fit to neural-network discriminant distributions yields the fol-lowing cross-sections:
σ(tq)=156±28 pb,
σ(¯tq)=91±19 pb,
σ(tq+tq¯ )=247±46 pb
in agreement with SM predictions. The cross-section ratio oftqand ¯tqproduction is found to be
Rt = 1.72±0.20. The coupling at the Wtb vertex is determined to be fLV· |Vtb| = 1.07±0.09
and a lower limit on the CKM matrix element is set, giving|Vtb| > 0.84 at the 95 % CL. These
JHEP04(2017)086
Acknowledgments
We thank CERN for the very successful operation of the LHC, as well as the support stafffrom our institutions without whom ATLAS could not be operated efficiently.
We acknowledge the support of ANPCyT, Argentina; YerPhI, Armenia; ARC, Australia; BM-WFW and FWF, Austria; ANAS, Azerbaijan; SSTC, Belarus; CNPq and FAPESP, Brazil; NSERC, NRC and CFI, Canada; CERN; CONICYT, Chile; CAS, MOST and NSFC, China; COLCIEN-CIAS, Colombia; MSMT CR, MPO CR and VSC CR, Czech Republic; DNRF and DNSRC, Denmark; IN2P3-CNRS, CEA-DSM/IRFU, France; GNSF, Georgia; BMBF, HGF, and MPG, Germany; GSRT, Greece; RGC, Hong Kong SAR, China; ISF, I-CORE and Benoziyo Center, Israel; INFN, Italy; MEXT and JSPS, Japan; CNRST, Morocco; FOM and NWO, Netherlands; RCN, Norway; MNiSW and NCN, Poland; FCT, Portugal; MNE/IFA, Romania; MES of Russia and NRC KI, Russian Federation; JINR; MESTD, Serbia; MSSR, Slovakia; ARRS and MIZ ˇS, Slovenia; DST/NRF, South Africa; MINECO, Spain; SRC and Wallenberg Foundation, Sweden; SERI, SNSF and Cantons of Bern and Geneva, Switzerland; MOST, Taiwan; TAEK, Turkey; STFC, United Kingdom; DOE and NSF, United States of America. In addition, individual groups and members have received support from BCKDF, the Canada Council, CANARIE, CRC, Com-pute Canada, FQRNT, and the Ontario Innovation Trust, Canada; EPLANET, ERC, ERDF, FP7, Horizon 2020 and Marie Skłodowska-Curie Actions, European Union; Investissements d’Avenir Labex and Idex, ANR, R´egion Auvergne and Fondation Partager le Savoir, France; DFG and AvH Foundation, Germany; Herakleitos, Thales and Aristeia programmes co-financed by EU-ESF and the Greek NSRF; BSF, GIF and Minerva, Israel; BRF, Norway; CERCA Programme Generalitat de Catalunya, Generalitat Valenciana, Spain; the Royal Society and Leverhulme Trust, United Kingdom.
The crucial computing support from all WLCG partners is acknowledged gratefully, in par-ticular from CERN, the ATLAS Tier-1 facilities at TRIUMF (Canada), NDGF (Denmark, Nor-way, Sweden), CC-IN2P3 (France), KIT/GridKA (Germany), INFN-CNAF (Italy), NL-T1 (Neth-erlands), PIC (Spain), ASGC (Taiwan), RAL (U.K.) and BNL (U.S.A.), the Tier-2 facilities world-wide and large non-WLCG resource providers. Major contributors of computing resources are listed in ref. [83].
Open Access. This article is distributed under the terms of the Creative Commons Attribution Li-cense (CC-BY 4.0), which permits any use, distribution and reproduction in any medium, provided the original author(s) and source are credited.
References
[1] L. Evans and P. Bryant,LHC Machine,2008JINST 3S08001[INSPIRE].
[2] S. Alekhin, J. Bl¨umlein, S. Moch and R. Plaˇcakyt˙e,Isospin asymmetry of quark distributions and implications for single top-quark production at the LHC,Phys. Rev.D 94(2016) 114038
[arXiv:1508.07923] [INSPIRE].
[3] N. Cabibbo,Unitary Symmetry and Leptonic Decays,Phys. Rev. Lett.10(1963) 531[INSPIRE].
[4] M. Kobayashi and T. Maskawa,CP Violation in the Renormalizable Theory of Weak Interaction,
JHEP04(2017)086
[5] J.A. Aguilar-Saavedra,A minimal set of top anomalous couplings,Nucl. Phys.B 812(2009) 181[arXiv:0811.3842] [INSPIRE].
[6] CMS collaboration,Measurement of the t-channel single-top-quark production cross section and of the|Vtb|CKM matrix element in pp collisions at
√
s=8TeV,JHEP06(2014) 090
[arXiv:1403.7366] [INSPIRE].
[7] J.M. Campbell, R. Frederix, F. Maltoni and F. Tramontano,Next-to-Leading-Order Predictions for t-Channel Single-Top Production at Hadron Colliders,Phys. Rev. Lett.102(2009) 182003
[arXiv:0903.0005] [INSPIRE].
[8] P. Kant et al.,HatHor for single top-quark production: Updated predictions and uncertainty
estimates for single top-quark production in hadronic collisions,Comput. Phys. Commun.191(2015) 74[arXiv:1406.4403] [INSPIRE].
[9] M. Botje et al.,The PDF4LHC Working Group Interim Recommendations,arXiv:1101.0538
[INSPIRE].
[10] A.D. Martin, W.J. Stirling, R.S. Thorne and G. Watt,Parton distributions for the LHC,Eur. Phys. J. C 63(2009) 189[arXiv:0901.0002] [INSPIRE].
[11] A.D. Martin, W.J. Stirling, R.S. Thorne and G. Watt,Uncertainties onαsin global PDF analyses and implications for predicted hadronic cross sections,Eur. Phys. J.C 64(2009) 653
[arXiv:0905.3531] [INSPIRE].
[12] H.-L. Lai et al.,New parton distributions for collider physics,Phys. Rev.D 82(2010) 074024
[arXiv:1007.2241] [INSPIRE].
[13] R.D. Ball et al.,Parton distributions with LHC data,Nucl. Phys.B 867(2013) 244
[arXiv:1207.1303] [INSPIRE].
[14] N. Kidonakis,Next-to-next-to-leading-order collinear and soft gluon corrections for t-channel single top quark production,Phys. Rev.D 83(2011) 091503[arXiv:1103.2792] [INSPIRE].
[15] N. Kidonakis,Two-loop soft anomalous dimensions for single top quark associated production with a W−or H−,Phys. Rev.D 82(2010) 054018[arXiv:1005.4451] [INSPIRE].
[16] N. Kidonakis,NNLL resummation for s-channel single top quark production,Phys. Rev.D 81(2010) 054028[arXiv:1001.5034] [INSPIRE].
[17] M. Brucherseifer, F. Caola and K. Melnikov,On the NNLO QCD corrections to single-top production at the LHC,Phys. Lett.B 736(2014) 58[arXiv:1404.7116] [INSPIRE].
[18] M. Feindt,A Neural Bayesian Estimator for Conditional Probability Densities,physics/0402093
[INSPIRE].
[19] ATLAS collaboration,Comprehensive measurements of t-channel single top-quark production cross sections at √s=7TeV with the ATLAS detector,Phys. Rev.D 90(2014) 112006
[arXiv:1406.7844] [INSPIRE].
[20] ATLAS collaboration,The ATLAS Experiment at the CERN Large Hadron Collider,2008JINST3 S08003[INSPIRE].
[21] ATLAS collaboration,ATLAS Insertable B-Layer Technical Design Report,CERN-LHCC-2010-013
(2010).
JHEP04(2017)086
[23] ATLAS collaboration,The ATLAS Simulation Infrastructure,Eur. Phys. J.C 70(2010) 823[arXiv:1005.4568] [INSPIRE].
[24] GEANT4 collaboration, S. Agostinelli et al.,GEANT4: A simulation toolkit,Nucl. Instrum. Meth.A 506(2003) 250[INSPIRE].
[25] T. Sj¨ostrand, S. Mrenna and P.Z. Skands,A Brief Introduction to PYTHIA 8.1,Comput. Phys. Commun.178(2008) 852[arXiv:0710.3820] [INSPIRE].
[26] R. Frederix, E. Re and P. Torrielli,Single-top t-channel hadroproduction in the four-flavour scheme with POWHEG and aMC@NLO,JHEP09(2012) 130[arXiv:1207.5391] [INSPIRE].
[27] S. Alioli, P. Nason, C. Oleari and E. Re,A general framework for implementing NLO calculations in shower Monte Carlo programs: the POWHEG BOX,JHEP06(2010) 043[arXiv:1002.2581] [INSPIRE].
[28] T. Sj¨ostrand, S. Mrenna and P.Z. Skands,PYTHIA 6.4 Physics and Manual,JHEP05(2006) 026
[hep-ph/0603175] [INSPIRE].
[29] P.Z. Skands,Tuning Monte Carlo Generators: The Perugia Tunes,Phys. Rev.D 82(2010) 074018
[arXiv:1005.3457] [INSPIRE].
[30] M. Bahr et al.,HERWIG++Physics and Manual,Eur. Phys. J.C 58(2008) 639[arXiv:0803.0883] [INSPIRE].
[31] M.H. Seymour and A. Siodmok,Constraining MPI models usingσeffand recent Tevatron and LHC
Underlying Event data,JHEP10(2013) 113[arXiv:1307.5015] [INSPIRE].
[32] J. Alwall et al.,The automated computation of tree-level and next-to-leading order differential cross sections and their matching to parton shower simulations,JHEP07(2014) 079[arXiv:1405.0301] [INSPIRE].
[33] E. Re,Single-top Wt-channel production matched with parton showers using the POWHEG method,
Eur. Phys. J.C 71(2011) 1547[arXiv:1009.2450] [INSPIRE].
[34] S. Alioli, P. Nason, C. Oleari and E. Re,NLO single-top production matched with shower in POWHEG: s- and t-channel contributions,JHEP09(2009) 111[Erratum ibid.02(2010) 011] [arXiv:0907.4076] [INSPIRE].
[35] S. Frixione, P. Nason and G. Ridolfi,A positive-weight next-to-leading-order Monte Carlo for heavy flavour hadroproduction,JHEP09(2007) 126[arXiv:0707.3088] [INSPIRE].
[36] D.J. Lange,The EvtGen particle decay simulation package,Nucl. Instrum. Meth.A 462(2001) 152
[INSPIRE].
[37] T. Gleisberg et al.,Event generation with SHERPA 1.1,JHEP02(2009) 007[arXiv:0811.4622] [INSPIRE].
[38] T. Gleisberg and S. Hoeche,Comix, a new matrix element generator,JHEP12(2008) 039
[arXiv:0808.3674] [INSPIRE].
[39] F. Cascioli, P. Maierhofer and S. Pozzorini,Scattering Amplitudes with Open Loops,Phys. Rev. Lett. 108(2012) 111601[arXiv:1111.5206] [INSPIRE].
[40] S. Schumann and F. Krauss,A parton shower algorithm based on Catani-Seymour dipole factorisation,JHEP03(2008) 038[arXiv:0709.1027] [INSPIRE].
JHEP04(2017)086
[42] NNPDF collaboration, R.D. Ball et al.,Parton distributions for the LHC Run II,JHEP04(2015) 040[arXiv:1410.8849] [INSPIRE].
[43] ATLAS collaboration,Estimation of non-prompt and fake lepton backgrounds in final states with top quarks produced in proton-proton collisions at √s=8TeV with the ATLAS detector,
ATLAS-CONF-2014-058(2014).
[44] ATLAS collaboration,Electron reconstruction and identification efficiency measurements with the ATLAS detector using the 2011 LHC proton-proton collision data,Eur. Phys. J.C 74(2014) 2941
[arXiv:1404.2240] [INSPIRE].
[45] ATLAS collaboration,Electron efficiency measurements with the ATLAS detector using the 2012 LHC proton-proton collision data,ATLAS-CONF-2014-032(2014).
[46] ATLAS collaboration,Measurement of the tt production cross-section using e¯ µevents with b-tagged jets in pp collisions at √s=13TeV with the ATLAS detector,Phys. Lett.B 761(2016) 136
[arXiv:1606.02699] [INSPIRE].
[47] M. Cacciari, G.P. Salam and G. Soyez,The anti-kTjet clustering algorithm,JHEP04(2008) 063 [arXiv:0802.1189] [INSPIRE].
[48] ATLAS collaboration,Monte Carlo Calibration and Combination of In-situ Measurements of Jet Energy Scale, Jet Energy Resolution and Jet Mass in ATLAS,ATLAS-CONF-2015-037(2015). [49] ATLAS collaboration,Performance of pile-up mitigation techniques for jets in pp collisions at
√
s=8TeV using the ATLAS detector,Eur. Phys. J.C 76(2016) 581[arXiv:1510.03823] [INSPIRE].
[50] ATLAS collaboration,Calibration of the performance of b-tagging for c and light-flavour jets in the 2012 ATLAS data,ATLAS-CONF-2014-046(2014).
[51] ATLAS collaboration,Calibration of b-tagging using dileptonic top pair events in a combinatorial likelihood approach with the ATLAS experiment,ATLAS-CONF-2014-004(2014).
[52] ATLAS collaboration,Performance of the ATLAS muon trigger in pp collisions at √s=8TeV,Eur. Phys. J.C 75(2015) 120[arXiv:1408.3179] [INSPIRE].
[53] M. Cacciari, M. Czakon, M. Mangano, A. Mitov and P. Nason,Top-pair production at hadron colliders with next-to-next-to-leading logarithmic soft-gluon resummation,Phys. Lett.B 710(2012) 612[arXiv:1111.5869] [INSPIRE].
[54] P. B¨arnreuther, M. Czakon and A. Mitov,Percent Level Precision Physics at the Tevatron: First Genuine NNLO QCD Corrections to qq¯→tt¯+X,Phys. Rev. Lett.109(2012) 132001
[arXiv:1204.5201] [INSPIRE].
[55] M. Czakon and A. Mitov,NNLO corrections to top-pair production at hadron colliders: the all-fermionic scattering channels,JHEP12(2012) 054[arXiv:1207.0236] [INSPIRE].
[56] M. Czakon and A. Mitov,NNLO corrections to top pair production at hadron colliders: the quark-gluon reaction,JHEP01(2013) 080[arXiv:1210.6832] [INSPIRE].
[57] M. Czakon, P. Fiedler and A. Mitov,Total Top-Quark Pair-Production Cross section at Hadron Colliders Through O(α4S),Phys. Rev. Lett.110(2013) 252004[arXiv:1303.6254] [INSPIRE].
[58] M. Czakon and A. Mitov,Top++: A Program for the Calculation of the Top-Pair Cross-Section at Hadron Colliders,Comput. Phys. Commun.185(2014) 2930[arXiv:1112.5675] [INSPIRE].
[59] C. Anastasiou, L.J. Dixon, K. Melnikov and F. Petriello,High precision QCD at hadron colliders: Electroweak gauge boson rapidity distributions at NNLO,Phys. Rev.D 69(2004) 094008
JHEP04(2017)086
[60] M. Feindt and U. Kerzel,The NeuroBayes neural network package,Nucl. Instrum. Meth.A 559(2006) 190[INSPIRE].
[61] ATLAS collaboration,Electron and photon energy calibration with the ATLAS detector using LHC Run 1 data,Eur. Phys. J.C 74(2014) 3071[arXiv:1407.5063] [INSPIRE].
[62] ATLAS collaboration,Electron identification measurements in ATLAS using √s=13TeV data with 50 ns bunch spacing,ATL-PHYS-PUB-2015-041(2015).
[63] ATLAS collaboration,Muon reconstruction performance of the ATLAS detector in proton-proton collision data at √s=13TeV,Eur. Phys. J.C 76(2016) 292[arXiv:1603.05598] [INSPIRE].
[64] ATLAS collaboration,Jet energy measurement and its systematic uncertainty in proton-proton collisions at √s=7TeV with the ATLAS detector,Eur. Phys. J.C 75(2015) 17[arXiv:1406.0076] [INSPIRE].
[65] ATLAS collaboration,Jet Calibration and Systematic Uncertainties for Jets Reconstructed in the ATLAS Detector at √s=13TeV,ATL-PHYS-PUB-2015-015(2015).
[66] ATLAS collaboration,Jet energy resolution in proton-proton collisions at √s=7TeV recorded in 2010 with the ATLAS detector,Eur. Phys. J.C 73(2013) 2306[arXiv:1210.6210] [INSPIRE].
[67] ATLAS collaboration,Comparison of Monte Carlo generator predictions to ATLAS measurements of top pair production at 7 TeV,ATL-PHYS-PUB-2015-002(2015).
[68] J. Butterworth et al.,PDF4LHC recommendations for LHC Run II,J. Phys.G 43(2016) 023001
[arXiv:1510.03865] [INSPIRE].
[69] ATLAS collaboration,Measurements of the W production cross sections in association with jets with the ATLAS detector,Eur. Phys. J.C 75(2015) 82[arXiv:1409.8639] [INSPIRE].
[70] ATLAS collaboration,Measurement of the Inclusive and Fiducial Cross-Section of Single Top-Quark t-Channel Events in pp Collisions at √s=8TeV,ATLAS-CONF-2014-007(2014).
[71] ATLAS collaboration,Improved luminosity determination in pp collisions at √s=7 TeV using the ATLAS detector at the LHC,Eur. Phys. J.C 73(2013) 2518[arXiv:1302.4393] [INSPIRE].
[72] ATLAS collaboration,Luminosity determination in pp collisions at √s=8TeV using the ATLAS detector at the LHC, to be submitted toEur. Phys. J. C(2016).
[73] S. Dulat et al.,New parton distribution functions from a global analysis of quantum chromodynamics,
Phys. Rev.D 93(2016) 033006[arXiv:1506.07443] [INSPIRE].
[74] L.A. Harland-Lang, A.D. Martin, P. Motylinski and R.S. Thorne,Parton distributions in the LHC era: MMHT 2014 PDFs,Eur. Phys. J.C 75(2015) 204[arXiv:1412.3989] [INSPIRE].
[75] R.D. Ball et al.,Impact of Heavy Quark Masses on Parton Distributions and LHC Phenomenology,
Nucl. Phys.B 849(2011) 296[arXiv:1101.1300] [INSPIRE].
[76] P. Jimenez-Delgado and E. Reya,Delineating parton distributions and the strong coupling,Phys. Rev.D 89(2014) 074049[arXiv:1403.1852] [INSPIRE].
[77] S. Alekhin, J. Blumlein and S. Moch,Parton Distribution Functions and Benchmark Cross sections at NNLO,Phys. Rev.D 86(2012) 054009[arXiv:1202.2281] [INSPIRE].
JHEP04(2017)086
[79] ZEUS, H1 collaborations, H. Abramowicz et al.,Combination of measurements of inclusive deepinelastic e±p scattering cross sections and QCD analysis of HERA data,Eur. Phys. J.C 75(2015) 580[arXiv:1506.06042] [INSPIRE].
[80] ATLAS collaboration,Determination of the strange quark density of the proton from ATLAS measurements of the W →`νand Z→``cross sections,Phys. Rev. Lett.109(2012) 012001
[arXiv:1203.4051] [INSPIRE].
[81] CMS collaboration,Measurement of the ratioB(t→Wb)/B(t→Wq)in pp collisions at √s=8TeV,
Phys. Lett.B 736(2014) 33[arXiv:1404.2292] [INSPIRE].
[82] H. Lacker et al.,Model-independent extraction of|Vtq|matrix elements from top-quark measurements at hadron colliders,Eur. Phys. J.C 72(2012) 2048[arXiv:1202.4694] [INSPIRE].
[83] ATLAS collaboration,ATLAS Computing Acknowledgements 2016-2017,ATL-GEN-PUB-2016-002
JHEP04(2017)086
The ATLAS collaboration
M. Aaboud136d, G. Aad87, B. Abbott114, J. Abdallah8, O. Abdinov12, B. Abeloos118, R. Aben108, O.S. AbouZeid138, N.L. Abraham152, H. Abramowicz156, H. Abreu155, R. Abreu117, Y. Abulaiti149a,149b, B.S. Acharya168a,168b,a, S. Adachi158, L. Adamczyk40a, D.L. Adams27, J. Adelman109, S. Adomeit101, T. Adye132, A.A. Affolder76, T. Agatonovic-Jovin14, J.A. Aguilar-Saavedra127a,127f, S.P. Ahlen24, F. Ahmadov67,b, G. Aielli134a,134b, H. Akerstedt149a,149b, T.P.A. Åkesson83, A.V. Akimov97, G.L. Alberghi22a,22b, J. Albert173, S. Albrand57, M.J. Alconada Verzini73, M. Aleksa32, I.N. Aleksandrov67, C. Alexa28b, G. Alexander156, T. Alexopoulos10, M. Alhroob114, B. Ali129, M. Aliev75a,75b, G. Alimonti93a, J. Alison33, S.P. Alkire37, B.M.M. Allbrooke152, B.W. Allen117, P.P. Allport19, A. Aloisio105a,105b, A. Alonso38, F. Alonso73, C. Alpigiani139, A.A. Alshehri55, M. Alstaty87, B. Alvarez Gonzalez32, D. ´Alvarez Piqueras171, M.G. Alviggi105a,105b, B.T. Amadio16, K. Amako68, Y. Amaral Coutinho26a, C. Amelung25, D. Amidei91, S.P. Amor Dos Santos127a,127c, A. Amorim127a,127b, S. Amoroso32, G. Amundsen25, C. Anastopoulos142, L.S. Ancu51, N. Andari19, T. Andeen11, C.F. Anders60b, G. Anders32, J.K. Anders76, K.J. Anderson33, A. Andreazza93a,93b, V. Andrei60a, S. Angelidakis9, I. Angelozzi108, A. Angerami37, F. Anghinolfi32, A.V. Anisenkov110,c, N. Anjos13, A. Annovi125a,125b, C. Antel60a, M. Antonelli49, A. Antonov99,∗, F. Anulli133a, M. Aoki68, L. Aperio Bella19, G. Arabidze92, Y. Arai68, J.P. Araque127a, A.T.H. Arce47, F.A. Arduh73, J-F. Arguin96, S. Argyropoulos65, M. Arik20a, A.J. Armbruster146, L.J. Armitage78, O. Arnaez32, H. Arnold50,
M. Arratia30, O. Arslan23, A. Artamonov98, G. Artoni121, S. Artz85, S. Asai158, N. Asbah44,
A. Ashkenazi156, B. Åsman149a,149b, L. Asquith152, K. Assamagan27, R. Astalos147a, M. Atkinson170, N.B. Atlay144, K. Augsten129, G. Avolio32, B. Axen16, M.K. Ayoub118, G. Azuelos96,d, M.A. Baak32, A.E. Baas60a, M.J. Baca19, H. Bachacou137, K. Bachas75a,75b, M. Backes121, M. Backhaus32,
P. Bagiacchi133a,133b, P. Bagnaia133a,133b, Y. Bai35a, J.T. Baines132, O.K. Baker180, E.M. Baldin110,c, P. Balek176, T. Balestri151, F. Balli137, W.K. Balunas123, E. Banas41, Sw. Banerjee177,e,
A.A.E. Bannoura179, L. Barak32, E.L. Barberio90, D. Barberis52a,52b, M. Barbero87, T. Barillari102, M-S Barisits32, T. Barklow146, N. Barlow30, S.L. Barnes86, B.M. Barnett132, R.M. Barnett16, Z. Barnovska-Blenessy5, A. Baroncelli135a, G. Barone25, A.J. Barr121, L. Barranco Navarro171, F. Barreiro84, J. Barreiro Guimar˜aes da Costa35a, R. Bartoldus146, A.E. Barton74, P. Bartos147a, A. Basalaev124, A. Bassalat118,f, R.L. Bates55, S.J. Batista162, J.R. Batley30, M. Battaglia138, M. Bauce133a,133b, F. Bauer137, H.S. Bawa146,g, J.B. Beacham112, M.D. Beattie74, T. Beau82, P.H. Beauchemin166, P. Bechtle23, H.P. Beck18,h, K. Becker121, M. Becker85, M. Beckingham174, C. Becot111, A.J. Beddall20e, A. Beddall20b, V.A. Bednyakov67, M. Bedognetti108, C.P. Bee151, L.J. Beemster108, T.A. Beermann32, M. Begel27, J.K. Behr44, C. Belanger-Champagne89, A.S. Bell80, G. Bella156, L. Bellagamba22a, A. Bellerive31, M. Bellomo88, K. Belotskiy99, O. Beltramello32, N.L. Belyaev99, O. Benary156,∗, D. Benchekroun136a, M. Bender101, K. Bendtz149a,149b, N. Benekos10, Y. Benhammou156, E. Benhar Noccioli180, J. Benitez65, D.P. Benjamin47, J.R. Bensinger25,
S. Bentvelsen108, L. Beresford121, M. Beretta49, D. Berge108, E. Bergeaas Kuutmann169, N. Berger5, J. Beringer16, S. Berlendis57, N.R. Bernard88, C. Bernius111, F.U. Bernlochner23, T. Berry79, P. Berta130, C. Bertella85, G. Bertoli149a,149b, F. Bertolucci125a,125b, I.A. Bertram74, C. Bertsche44, D. Bertsche114, G.J. Besjes38, O. Bessidskaia Bylund149a,149b, M. Bessner44, N. Besson137, C. Betancourt50, A. Bethani57, S. Bethke102, A.J. Bevan78, R.M. Bianchi126, L. Bianchini25, M. Bianco32, O. Biebel101,

![Table 2. The ten variables that are used in the training of the neural network ordered by their discriminating power as determined by Neurobayes [ 19 , 60 ].](https://thumb-us.123doks.com/thumbv2/123dok_us/1990355.160997/11.892.174.739.125.419/table-variables-training-network-ordered-discriminating-determined-neurobayes.webp)