This is a repository copy of Influence of oral processing on appetite and food intake - A
systematic review and meta-analysis..
White Rose Research Online URL for this paper: http://eprints.whiterose.ac.uk/127785/
Version: Accepted Version
Article:
Krop, EM, Hetherington, MM orcid.org/0000-0001-8677-5234, Nekitsing, C et al. (3 more authors) (2018) Influence of oral processing on appetite and food intake - A systematic review and meta-analysis. Appetite, 125. p. 253.
https://doi.org/10.1016/j.appet.2018.01.018
(c) 2018, Elsevier Ltd. This manuscript version is made available under the CC BY-NC-ND 4.0 license https://creativecommons.org/licenses/by-nc-nd/4.0/
[email protected] https://eprints.whiterose.ac.uk/ Reuse
Items deposited in White Rose Research Online are protected by copyright, with all rights reserved unless indicated otherwise. They may be downloaded and/or printed for private study, or other acts as permitted by national copyright laws. The publisher or other rights holders may allow further reproduction and re-use of the full text version. This is indicated by the licence information on the White Rose Research Online record for the item.
Takedown
If you consider content in White Rose Research Online to be in breach of UK law, please notify us by
Influence of oral processing on appetite and food intake
–
A systematic
review and meta-analysis
Emma M. Krop a, Marion M. Hetherington b*, Chandani Nekitsing b, Sophie Miquel c, Luminita 1
Postelnicu d, Anwesha Sarkar a** 2
a Food Colloids and Processing Group, School of Food Science and Nutrition, University of Leeds, 3
Leeds LS2 9JT, UK 4
b School of Psychology, University of Leeds, Leeds LS2 9JT, UK 5
c Mars-Wrigley, 1132 West Blackhawk Street, Chicago, IL 60642, USA 6
d Mentis Consulting SA, 13 Rue du Congrès/ Congresstraat 13, 1000 Brussels, Belgium 7
8
Corresponding authors:
9
*Professor Marion Hetherington 10
School of Psychology, University of Leeds, Leeds LS2 9JT, UK 11
E-mail address: [email protected]
12
Phone: +44 (0) 113 343 8472 13
**Dr. Anwesha Sarkar 14
Food Colloids and Processing Group 15
School of Food Science and Nutrition, University of Leeds, Leeds LS2 9JT, UK 16
E-mail address: [email protected]
17
Abstract
19
Food delivers energy, nutrients and a pleasurable experience. Slow eating and prolonged oro-20
sensory exposure to food during consumption can enhance the processes that promote satiation. 21
This systematic review and meta-analysis investigated the effects of oral processing on subjective 22
measures of appetite (hunger, desire to eat) and objectively measured food intake. The aim was to 23
investigate the influence of oral processing characteristics, specifically “chewing” and 24
“lubrication”, on “appetite” and “food intake”. A literature search of six databases (Cochrane 25
library, PubMed, Medline, Food Science and Technology Abstracts, Web of Science, Scopus), 26
yielded 12161 articles which were reduced to a set of 40 articles using pre-specified inclusion and 27
exclusion criteria. A further two articles were excluded from the meta-analysis due to missing 28
relevant data. From the remaining 38 papers, detailing 40 unique studies with 70 subgroups, raw 29
data were extracted for meta-analysis (food intake n=65, hunger n=22 and desire to eat ratings 30
n=15) and analyzed using random effects modelling. Oral processing parameters, such as number 31
of chews, eating rate and texture manipulation, appeared to influence food intake markedly but 32
appetite ratings to a lesser extent. Meta-analysis confirmed a significant effect of the direct and 33
indirect aspects of oral processing that were related to chewing on both self-reported hunger (-0.20 34
effect size, 95% confidence interval CI: 0.30, 0.11), and food intake (0.28 effect size, 95% CI: -35
0.36, -0.19). Although lubrication is an important aspect of oral processing, few studies on its 36
effects on appetite have been conducted. Future experiments using standardized approaches should 37
provide a clearer understanding of the role of oral processing, including both chewing and 38
lubrication, in promoting satiety. 39
Keywords: Oral Processing, Satiety, Satiation, Hunger, Food Intake, Lubrication.
List of non-standard abbreviations
41
WHO: World Health Organization 42
FSTA: Food Science and Technology Abstracts 43
PRISMA: Preferred Reporting Items for Systematic Reviews and Meta-Analysis 44
PICOS: Population, Intervention, Comparison, Outcome, and Setting 45
DEBQ: Dutch Eating Behavior Questionnaire 46
TFEQ: Three Factor Eating Questionnaire 47
VAS: Visual Analogue Scales 48
M/F: Male/Female 49
NA: Not Applicable/Available 50
UW: Underweight, BMI <18.5 kg/m2 51
NW: Normal Weight, BMI of 18.5–24.9 kg/m2 52
OW: Overweight, BMI of 25–29.9 kg/m2 53
OBμ Obese, BMI ≥30 kg/m2 54
RE model: Random Effects model 55
ME model: Mixed Effects model 56
Introduction
58
Food intake is a motivated behavior essential to survival by providing energy and nutrients to the 59
body. However, chronic energy intake in excess of requirements leads to a positive energy balance, 60
and in the long term, contributes to obesity (World Health Organization, 2000). For the first time 61
in human history, the proportion of the population that is obese (body mass index, BMI ≥30 kg/m2) 62
and overweight (BMI of 25 - <30 kg/m2) has surpassed that which is underweight (BMI <18.5 63
kg/m2). The WHO (2016) estimates about 1.9 billion adults are overweight globally with 30% 64
among them being obese (World Health Organization, 2016). Consumers are encouraged to eat less 65
and move more (Hill, 2006) and food manufacturers have been working to reformulate foods to 66
reduce their energy content whilst maintaining or improving satisfaction for example, by increasing 67
oral processing to enhance satiation and satiety (Hetherington, et al., 2013). 68
While the terms “satiation” and “satiety” are often used synonymously in the literature, they 69
encompass different components of the satiety cascade. Satiation is defined as the processes leading 70
to meal termination, and therefore includes all events taking place during the course of the eating 71
occurrence and controls meal size (Blundell, et al., 2009). On the other hand, satiety is described 72
as the inhibition of further eating as well as the suppression of feelings of hunger (Blundell, et al., 73
2009; Blundell, et al., 2010). Satiety has an influence on the time between two meals during which 74
hunger, which has been suppressed, then begins to increase until the next eating occurrence. 75
Constructs such as hunger and desire to eat represent approach behaviors indicative of appetite or 76
readiness to eat (Stubbs, et al., 2000). During sham feeding studies in humans, chewing fails to 77
reduce hunger and desire to eat (subjective appetite) but produces sensory specific satiety and 78
decreases food intake (Nolan & Hetherington, 2009). Therefore, in examining the effects of oral 79
During food consumption, food is processed in the mouth from first bite to swallowing, primarily 81
involving reduction in the particle size driven by “chewing”, and the incorporation of saliva to form 82
a swallowable bolus through “oral lubrication” (Chen, 2009; Chen & Stokes, 2012; Sarkar & Singh, 83
2012; Sarkar, Ye, & Singh, 2017). Depending on the nature of food and its oral interactions, the 84
length or intensity of the oro-sensory exposure (i.e. oral residence time) may vary (Ferriday, et al., 85
2016; Forde, Kuijk, Thaler, de Graaf, & Martin, 2013; Laguna & Sarkar, 2016; Viskaal-van 86
Dongen, Kok, & de Graaf, 2011). For instance, in previous studies food manipulations to influence 87
oral processing indirectly have involved the comparison of solid versus liquid forms of food, 88
variations in viscosity or texture, or flavor intensities. The more direct influence of chewing on 89
appetite ratings and food intake has been studied by varying the number of chews of a target food, 90
and examining chewing gum interventions (Hogenkamp & Schiöth, 2013; Miquel-Kergoat, Azais-91
Braesco, Burton-Freeman, & Hetherington, 2015; Robinson, et al., 2014). However, it is recognized 92
that altering chewing in this way also varies oral residence time, eating rate, muscle fatigue and 93
other oral processing attributes. Therefore, the effects of chewing in isolation is rarely studied due 94
to the interrelated nature of these variables. 95
Lubrication is an important aspect of oral processing in addition to chewing per se (Laguna, Farrell, 96
Bryant, Morina, & Sarkar, 2017; Laguna & Sarkar, 2017; Stokes, Boehm, & Baier, 2013). In-mouth 97
lubrication may depend on the type of food consumed, its interactions with saliva and with the oral 98
surfaces (e.g. tongue, teeth, oral palate). The mechanical properties of food can be evaluated using 99
rheological measurements, such as viscosity, small and large deformation rheology. However, 100
rheological measurements do not account for changes that occur in the food during the later stages 101
of oral processing, such as the incorporation of saliva. Furthermore, the rheology of food during 102
oral processing is not static; it is a highly dynamic process and the textural properties change 103
continuously when the food is exposed to the oral cavity and becomes largely tribology-dominant, 104
i.e. lubrication or friction dependent (Stokes, et al., 2013). To that end, the lubricating effects arising 105
Sarkar, 2017), a technique introduced relatively recently in food science. Although oral lubrication 107
is an integral part of oral processing, to date this has not been reviewed systematically with 108
reference to satiety. 109
The main aim of this comprehensive systematic review and meta-analysis was to understand the 110
impact of oral processing, including both chewing and lubrication, on appetite and food intake. It 111
was hypothesized that the enhancement of both chewing and lubrication during oral processing will 112
affect appetite sensations, and reduce food intake. The main dependent variables included were: 1) 113
subjective ratings of hunger and desire to eat as markers of appetite and readiness to eat, and 2) 114
objective measures of energy intake following manipulation of food as a marker of satiation and 115
meal termination. This review aimed to provide insights into potential oral processing manipulation 116
strategies that could ultimately be applied to design foods offering enhanced satisfaction and satiety 117
(Hetherington, et al., 2013). 118
Materials and methods
119
The 2009 PRISMA (Preferred Reporting Items for Systematic Reviews and Meta-Analysis) 120
guidelines were used for reporting this systematic review. The search strategy and inclusion criteria 121
were specified in advance and documented in a protocol. This protocol was registered with the 122
International prospective register of systematic reviews PROSPERO, registration number: 123
CRD42016034019. 124
Search strategy
125
A systematic review attempts to collate all empirical evidence that fits pre-specified eligibility 126
criteria to answer a particular research question. The research question of this systematic review 127
was formulated using PICOS (Population, Intervention, Comparison, Outcome, and Setting). The 128
population was defined as healthy people with a healthy oral status that would not interfere with 129
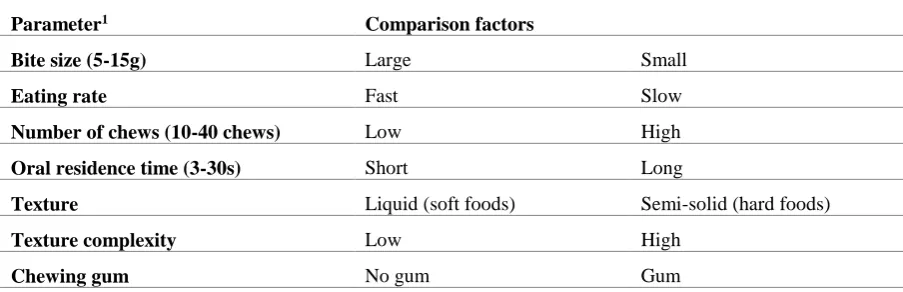
directly or indirectly affecting oral processing characteristics, such as eating rate, oral residence 131
time and number of chews, and where the comparison would involve two extreme conditions (see 132
Table 1). For the outcomes, measures related to subjective appetite (hunger, desire to eat) and/or
133
objectively measured food intake, as a consequence of manipulating oral processing, were included. 134
The setting mostly involved a laboratory environment, but other settings were not excluded. 135
A comprehensive literature search was conducted using six different online databases, including 136
Cochrane Library, OVID Medline, PubMed, OVID Food Science and Technology Abstracts 137
(FSTA), Web of Science (Thomson Reuters) and Scopus (Elsevier). The last search was run on 12 138
May 2017. Additional studies were identified using the reference lists of the articles found in the 139
search. Only articles published in English were included in this systematic review and no time limit 140
was set. A broad range of search terms were used to increase the chance of locating all relevant 141
literature. Three combined searches were performed in the six selected databases, linking chewing 142
to satiety, lubrication to satiety and tribological measurements to satiety (this is related to 143
lubrication, but extra search key words were added at a later stage). The search terms related to 144
chewing were: ["oral processing" OR chewing OR mastication OR "structural breakdown" OR 145
"food breakdown" OR "food destruction" OR "chewing cycle"]. The lubrication related search 146
terms were: ["oral processing" OR "oral behavio*r" OR lubrication OR saliva OR "artificial saliva" 147
OR "oral coating" OR "oral exposure" OR tongue]. For satiety the following search terms were 148
used: [satiety OR satiation OR "expected satiety" OR "food intake" OR appetite OR hunger OR 149
fullness OR "sensory specific satiety" OR "energy intake" OR "food behavio*r" OR "eating 150
behavio*r"]. The selected key words for the added tribological variable were: [tribology OR 151
tribometer OR thin-film rheology OR soft tribology OR tribol*]. 152
The search in Scopus was limited to publications where the search terms appear in the title, abstract 153
or keywords. No additional limitations were set for the other databases. The search strategy was 154
validated by checking that a number of pre-selected relevant articles were indeed retrieved in at 155
research, focusing on more general articles based on the research topic, as well as articles found in 157
previous related systematic review by Miquel-Kergoat, et al. (2015). The citations of all found 158
articles were exported to the reference software Endnote X7 for further processing. 159
Study selection
160
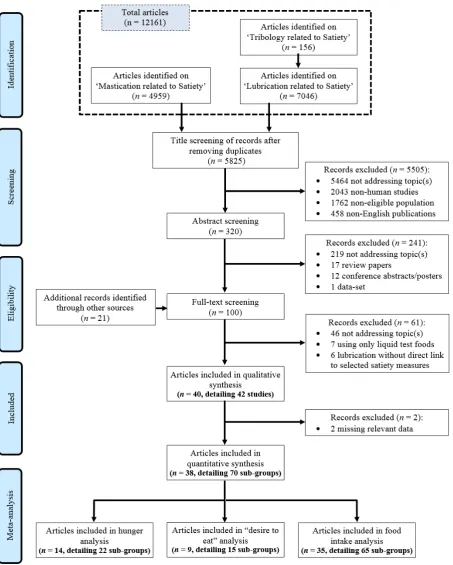
Only original research reports of human studies were included in this systematic review. The study 161
selection phase was executed by first author EK. A summary of the selection procedure (PRISMA 162
four-phase flow diagram) is given in Figure 1. The initial 12161 identified articles were reduced 163
to 5825 after duplicates were removed. The remaining articles were screened for relevance based 164
on their title. An additional 5505 studies were excluded based on the PICOS criteria. Research 165
reports involving animal studies (2043), or medical studies on patients with certain diseases or 166
disorders, studies with children, the elderly or participants of whom it was suspected that normal 167
chewing was hindered (1762) were excluded. Additionally, articles not addressing the topic of 168
interest were excluded (5464), as well as studies published in any other language than English 169
(458). Some articles were excluded for multiple reasons, therefore the total number of articles is 170
lower than the sum. 171
The remaining 320 articles were screened for their abstract, resulting in the exclusion of an 172
additional 241 articles (219 based on their topic, 17 were review papers without original data and 173
12 were meeting and conference abstracts, as well as posters presentation abstracts, and one was a 174
data-set). The remaining number for the next screening step was n=100, including an additional 21 175
articles that were identified through supplementary approaches. For example, the PRISMA 176
statement for reporting systematic reviews (item 7 https://doi.org/10.1136/bmj.b2700) advocates 177
hand searches of the reference lists from screened articles so that relevant papers are not omitted. 178
Finally, after assessing the full-text of these articles, another 61 articles were excluded for one or 179
more reasons. Articles not addressing the topic of interest or studies aiming at validating new 180
achieved by comparing two liquid products of for example differing viscosity (n=7) and studies 182
focusing on lubrication related parameters without direct measures of satiety/satiation (n=6) were 183
eliminated, leading to a set of 40 articles. Two of those articles reported two independent studies 184
(de Wijk, Zijlstra, Mars, de Graaf, & Prinz, 2008; Zijlstra, Mars, de Wijk, Westerterp-Plantenga, & 185
de Graaf, 2008), bringing the total number of studies for qualitative synthesis to 42. 186
The quality assessment tool developed and validated by Moore (2012) was used to assess the quality 187
of the included studies. Additionally, these 42 studies were critically appraised for risk of bias at 188
both the study level and outcome levels. The quality and accuracy of a sample (~35%) of the 189
extracted data was checked by authors MH and AS. 190
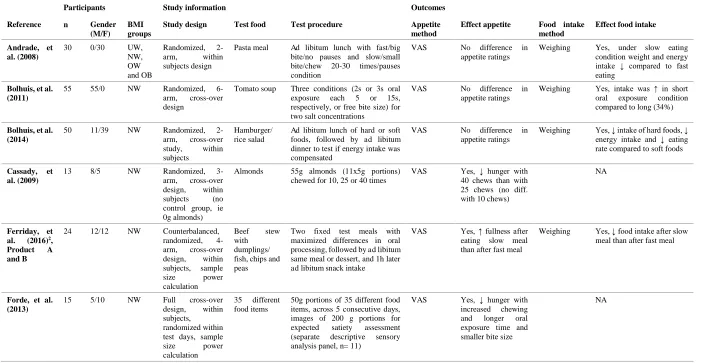
Study characteristics
191
Relevant information, such as study design, participant age, body mass index (BMI) status and 192
gender ratio, as well as study outcomes on appetite ratings and food intake measures, was extracted 193
from the 42 included studies. The key study characteristics are given in Table 2. In addition, means 194
and standard deviations of the two most extreme outcome measures were extracted for the meta-195
analysis by author EK, as well as their statistical significance (p-values). The corresponding authors 196
of more recent articles, where the values of interest were measured but not actually reported, were 197
contacted with a data request. In the case of 9 articles (10 studies) data was received and 198
incorporated into the current systematic research review (Cassady, Hollis, Fulford, Considine, & 199
Mattes, 2009; Higgs & Jones, 2013; Hogenkamp, Mars, Stafleu, & de Graaf, 2010, 2012; 200
Hogenkamp, Stafleu, Mars, & de Graaf, 2012; Smit, Kemsley, Tapp, & Henry, 2011; Zijlstra, Mars, 201
Stafleu, & de Graaf, 2010; Zijlstra, et al., 2008, Study and 2; Zijlstra, de Wijk, Mars, Stafleu, & de 202
Graaf, 2009) and in the case of the study by Ferriday, et al. (2016) additional data was made publicly 203
available online (Bosworth, 2015). 204
All studies selected for qualitative synthesis were well-controlled experiments, in which 205
laboratory based (Zijlstra, et al., 2010; Zijlstra, et al., 2008, Study 1) and all but two had a within 207
subjects design (Higgs & Jones, 2013; Hogenkamp, et al., 2010). In only 10 of the studies, a power 208
calculation was used to determine the number of participants needed to find a meaningful 209
significant difference (Ferriday, et al., 2016; Forde, et al., 2013; Hogenkamp, Mars, et al., 2012; 210
Lasschuijt, et al., 2017; Martens, Lemmens, Born, & Westerterp-Plantenga, 2011; Martin, et al., 211
2007; McCrickerd, Lim, Leong, Chia, & Forde, 2017; Zhang, Leidy, & Vardhanabhuti, 2015; Zhu 212
& Hollis, 2014; Zhu, Hsu, & Hollis, 2013). 213
The total number of participants of all 40 studies included in the quantitative synthesis was 1711, 214
arising from studies with samples varying from 9 to 120 participants, and involved mainly young 215
adults (mean 25.1 years). Ideally studies should have an equal ratio of men to women, however for 216
a number of studies more women than men were included, with six studies using more than 70% 217
women (Bolhuis, et al., 2014; Hetherington & Regan, 2011; Higgs & Jones, 2013; Hogenkamp, 218
Mars, et al., 2012; Weijzen, Liem, Zandstra, & de Graaf, 2008; Zijlstra, et al., 2011). On the other 219
hand, five studies included only males (Bolhuis, Lakemond, de Wijk, Luning, & de Graaf, 2011; 220
Labouré, van Wymelbeke, Fantino, & Nicolaidis, 2002; Li, et al., 2011; Martens, et al., 2011; Zhu, 221
et al., 2013), whereas only four studies included just females (Andrade, Greene, & Melanson, 2008; 222
Komai, et al., 2016; Park, et al., 2016; Spiegel, Kaplan, Tomassini, & Stellar, 1993). Weight status 223
varied across studies, with 20 studies specifically selecting participants within a healthy BMI range, 224
five studies selecting people from specific weight groups to control for the influence of weight 225
status whereas the remaining 15 studies did not specifically select or control for BMI. From those 226
studies, there were two that also included participants with a BMI higher than 25 (Julis & Mattes, 227
2007; Martin, et al., 2007). In most studies (29 out of 40), participants with any dietary restriction 228
or dramatic weight change were specifically excluded as well as those who reported high levels of 229
dietary restraint (27 out of 40) as assessed by either the Dutch Eating Behavior Questionnaire 230
(TFEQ) (Stunkard & Messick, 1985). None of the studies were double blinded, however in 22 232
studies the participants were distracted from the true aim through the use of a cover story. 233
In all studies, the researchers intended to vary only one characteristic of oral processing. However 234
manipulating one characteristic inevitably had an effect on other characteristics (i.e. a higher eating 235
rate might directly shorten the oral residence time). In 16 studies a test food was given with 236
manipulated texture, such as liquid versus semi-solid food, and in two studies a texture complexity 237
component was added. In six studies the number of chews per bite was manipulated, in three studies 238
the oral residence time was directly influenced, and in five studies participants were instructed to 239
eat at a specific chewing rate. Another three studies were included where the bite size was changed, 240
and the final six studies looked at the influence of chewing gum on satiety and food intake during 241
a later meal. For the purpose of the meta-analysis, the minimum and maximum oral processing 242
characteristics were compared to one another (see Table 1). The maximum values were set as the 243
commonly recommended values for reducing food intake and controlling appetite, such as small 244
bites, high number of chews and long oral residence time (Christen & Christen, 1997; Smit, et al., 245
2011). In addition to the 26 studies that directly compared two oral processing parameters, the 246
remaining 14 studies examined other intermediate oral processing conditions that were not 247
considered in this systematic review. However, in the case of the study by Zijlstra, de Wijk, et al. 248
(2009) more separate conditions were considered in the meta-analysis; i.e., conditions comparing 249
different oral residence times after ingestion of free-choice boluses of liquid food (which the authors 250
called “bites”) as well as small and large boluses delivered with a peristaltic pump. 251
In the second search for papers linking lubrication or tribological parameters of food to satiety 252
measures, a relatively small number of studies were found which had a comparable study design. 253
Only six studies emerged investigating a link between a lubrication parameter and satiety. These 254
papers are discussed separately and were not included in the meta-analysis, since most did not 255
Meta-analysis
257
For the purpose of the meta-analysis, an additional two articles were excluded because appropriate 258
data on a number of outcome measures were missing (Forde, et al., 2013; Zandian, Ioakimidis, 259
Bergh, Brodin, & Södersten, 2009). The remaining 38 articles, detailing 40 studies, were further 260
divided in 70 subgroups (See Figure 1), as some studies provided more than one unique comparison 261
group. Rather than combining these groups (study as unit of analysis), we entered each subgroup 262
separately into the meta-analysis (subgroup within study as unit of analysis). These subgroups 263
included the same experiment repeated with different test foods, indicated by Product A, B etc., 264
such as Labouré et al. Part A studying soups and Part B looking at rusks (Labouré, et al., 2002), as 265
well as studies with different participant groups, indicated by Group A, B etc., such as Martin et al. 266
Group A with all males and Group B with all females (Martin, et al., 2007). Some subgroups were 267
indicated with Step 1, 2 etc, such as Bolhuis et al. Step 1 for ad libitum course one: lunch, and 268
Bolhuis et al. Step 2 for ad libitum course 2: dinner (Bolhuis, et al., 2014), as well as Part A, B etc. 269
to indicate different subgroups that did not necessarily have an effect on oral processing for example 270
different energy density products or different test days as extra replicates. The participants’ 271
characteristics of all individual subgroups can be found in Supplementary Table 1. 272
The meta-analysis was conducted on three outcome measures: subjective appetite ratings of hunger 273
and desire to eat and objective measures of food intake (see Supplementary Tables 2 and 3). 274
Despite the importance of standardizing hunger levels before the oral processing manipulation, only 275
seven studies provided a standard or preload meal (Bolhuis, et al., 2011; Lasschuijt, et al., 2017; 276
Mourao, Bressan, Campbell, & Mattes, 2007; Zhang, et al., 2015; Zijlstra, et al., 2010; Zijlstra, et 277
al., 2008, Study 1 and 2). The oral processing intervention consisted of a fixed amount of food or 278
was an ad libitum meal where food intake was measured. In some studies ad libitum intake was 279
permitted during the oral processing intervention, and in others there was a fixed amount of food 280
intervention and again at the test meal (Bolhuis, et al., 2014). Appetite ratings were measured at 282
baseline on arrival in the lab and/or directly after the standard meal. Measurements were repeated 283
directly after the oral processing intervention, and in some cases at 30 minute or hourly intervals 284
after for a specific period of time. 285
Appetite ratings were measured on 100 mm Visual Analog Scales (VAS) or categorical rating 286
scales. The 10-point or 5-point scores were converted to a 100 point scale, so appetite ratings could 287
be better compared against each other. When appetite was assessed at multiple time points after the 288
oral processing manipulation, the ratings directly after the end of manipulation were retrieved. To 289
control for differences in appetite levels before the start of the study due to varying fasting states, 290
for example, the change in mean appetite level was computed (raw mean difference, e.g. hunger 291
level after chewing intervention minus the baseline hunger level). Food intake was measured after 292
the chewing manipulation in either weight (g) or energy (kcal or kJ). Where needed, given values 293
were converted to kcal to standardize the measurement units. Mean, standard deviation and sample 294
size for each group were extracted for all papers where they were reported. To account for 295
differences in the measurement scales, the standardized mean difference (SMD) was used to 296
compute the effect size (Borenstein, Hedges, Higgins, & Rothstein, 2009). The studies employing 297
a between subjects design were treated as independent studies, whereas the studies employing a 298
within subjects design were considered as dependent studies. For the food intake studies a 299
correlation coefficient of 0.5 was assumed and for the appetite studies a correlation coefficient of 300
0.2. Both correlation coefficients were based on the few studies where raw data was available to 301
determine the actual correlation coefficients (Cassady, et al., 2009; Ferriday, et al., 2016; 302
Hetherington & Boyland, 2007; Hogenkamp, Stafleu, et al., 2012; Smit, et al., 2011). 303
Since the studies from our sample used different methodologies, the meta-analysis was performed 304
using a random effects (RE) model. The heterogeneity was assessed with the I2 statistic as indicator 305
for the percentage of statistically meaningful variability between studies. An I2 value of 0% means 306
moderate and above 75% is considered high (Higgins, Thompson, Deeks, & Altman, 2003). If 308
heterogeneity between studies was considered high, we tried to explain this further by implementing 309
a mixed effects (ME) model with a number of moderators, such as fasting time, participants’ age 310
and BMI status. To investigate risk of publication bias across the studies, funnel plots were 311
produced. A funnel plot is used to visually represent high oral processing effect estimates from 312
individual studies against the standard error of each study. Typically the precision of an estimate 313
increases with the size of the study, with studies with a small sample size distributed towards the 314
bottom of the plot and studies with a larger sample size scattered towards the narrower top of the 315
funnel plot as they are more precise. The different shades of the funnel plot correspond to the 90% 316
confidence interval CI (white), 95% CI (light grey) and 99% CI (dark grey). The free statistical 317
software R® (version 3.3.1) and the metaphor package (version 1.9-9) were used to conduct the 318
meta-analyses (forest plots and funnel plots). The software Comprehensive Meta-Analysis (version 319
2.2) was used to conduct the sensitivity and group effect analyses, as well as the Egger’s tests to 320
assess publication bias (Egger, Davey Smith, Schneider, & Minder, 1997). 321
Results
322
A total of 40 articles, that included 42 studies, were found suitable for qualitative analysis (see 323
Figure 1 and Table 2).
324
Effect of food oral processing on appetite
325
Based on the 42 studies that measured appetite ratings, 10 found significant effects on the appetite 326
ratings, such as hunger, fullness and desire to eat. This disparity in the results may be associated 327
with the study methodology employed, such as having a fixed amount of food to chew. For 328
example, Cassady, et al. (2009) provided their participants with a fixed amount of almonds to chew 329
for different number of times (10, 25 or 40 chews). They found that a larger number of chews 330
significantly reduced appetite. A fixed amount of food was also given during the manipulation of 331
Forde, et al., 2013; Hogenkamp, Stafleu, et al., 2012; Zhu, et al., 2013; Zijlstra, de Wijk, et al., 333
2009). When ad libitum meals were provided, participants ate until they reached a certain level of 334
fullness, so the change in appetite ratings was similar regardless of the amount consumed or how 335
much energy was ingested. If an excess amount of food is offered in an ad libitum meal, the 336
motivation to eat may be stronger than the oral processing manipulation itself. 337
Effect of oral processing on food intake
338
Four studies did not measure ad libitum food intake during or after the oral processing intervention 339
(Cassady, et al., 2009; Forde, et al., 2013; Komai, et al., 2016; Martens, et al., 2011), and therefore 340
were not considered in this section of the review. Thus, the total number of studies that measured 341
food intake was 38. Food intake was measured either at the same time as the oral processing 342
intervention occurred, e.g. number of chews was manipulated during an ad libitum meal (Li, et al., 343
2011), or after the oral processing manipulation, e.g. Zhu, et al. (2013). 344
The effect of oral processing on objective measures of food intake was significant in 26 studies, but 345
no clear patterns were evident. The provision of a fixed meal to standardize hunger before the oral 346
processing intervention was linked to a significant effect in food intake in seven studies (Bolhuis, 347
et al., 2011; Hetherington & Boyland, 2007; Hetherington & Regan, 2011; Lasschuijt, et al., 2017; 348
Mourao, et al., 2007; Zijlstra, et al., 2008, Study 1 and 2), which seems to highlight the importance 349
of a standardized meal to ensure a similar level of hunger between participants before the oral 350
processing manipulations. 351
Effect of lubrication on appetite and food intake
352
Six articles were identified that mentioned some links between lubrication and satiety (see 353
Supplementary Table 4). McCrickerd, Chambers, and Yeomans (2014) tested the satiety effects
354
of fruit drinks varying in thickness and creaminess. The viscosity and lubrication profiles of the test 355
traction coefficient than the thin drinks. No effect was found on satiety ratings, but they did observe 357
a difference in food intake where female participants self-selected a smaller portion size when the 358
drink’s visual sensory characteristics indicated it would be more satiating (McCrickerd, et al., 359
2014). A limitation of this study was that participants were allowed to self-select their own portion 360
size in a glass from a larger amount of the drink in a jug, after assessing the sensory characteristics. 361
The results might have been clearer if the sensory aspects were evaluated by a different panel, and 362
if the panelists were instructed to drink directly from a larger or fixed amount to ensure satiation. 363
A mindful assessment of the drink attending to the sensory features of the drinks before ad libitum 364
intake might have influenced the results. Moreover, as also suggested by the authors, the portion 365
size effect might have had a bigger influence on intake than the texture manipulation. It was 366
suggested that the average portion size for men was bigger than the serving glass could hold, but 367
was smaller for women. Therefore the portion size could explain the lack of effect found in male 368
participants, while there was an effect for female participants. 369
In a study by Morell, Fiszman, Varela, and Hernando (2014) the effect of four different 370
hydrocolloids in milkshakes with similar viscosity during pouring and handling conditions on 371
expected satiety was investigated. They found that the starch granules (mainly in modified starch) 372
swell up and disintegrate in presence of artificial saliva. However, the structural properties of guar 373
gum and -carrageenan milkshakes remained more or less intact. In addition, the modified starch 374
milkshake had a higher expected satiety. It was hypothesized that expected satiety was more linked 375
to the initially perceived thickness and creaminess of foods and that the loss of structure in presence 376
of saliva is linked to a melting sensation of the modified starch in the mouth (Morell, et al., 2014). 377
However, this melting sensation could be a function of better lubrication, which in this case seems 378
to be related to higher expected satiety, suggesting later stages of oral processing could be just as 379
important to satiety perceptions as the initial stages. In addition, Stribeck analysis of these 380
milkshakes with or without saliva was not performed to confirm whether the milkshakes had 381
Hernando, Llorca, and Fiszman (2015) the influence of different proteins and presence of starch in 383
yoghurts was studied in relation to expected satiety. In line with their previous study, it was found 384
that addition of starch, as well as addition of protein, increased expected satiety with whey protein 385
having more potential to increase expected satiety than skimmed milk powder. The breakdown of 386
starch in presence of saliva and linked melting sensation was not found here, as the starch granules 387
were incorporated in the protein network, aggregating upon exposure to artificial saliva (Morell, et 388
al., 2015). 389
In a study by Gavião, Engelen, and van der Bilt (2004) several oral processing characteristics of 390
different food products were determined. Dry Melba toast resulted in a longer oral residence time 391
with more chewing cycles, whereas the addition of margarine reduced the time until swallowing as 392
well as the number of chews. This was largely attributed to the lubricating effects of butter 393
facilitating bolus formation (Gavião, et al., 2004), however no quantitative tribological 394
measurement of the bolus was performed to confirm such findings. Joyner, Pernell, and Daubert 395
(2014) tested the friction behavior of acid milk gels with and without the addition of saliva. The 396
addition of saliva was found to cause a significant change in the frictional behavior of the acid milk 397
gels, with a stronger effect seen in samples containing starch (Joyner, et al., 2014). However, in 398
both of these studies no direct link was made with any satiety parameters. Finally, Lett, Norton, and 399
Yeomans (2016) have shown the effects of physicochemical characteristics (e.g. droplet size) of 400
model (emulsions) affecting hunger and food intake. They highlight that the tribological and 401
rheological properties of these emulsions are the same; however, exact coefficients of friction at 402
orally relevant speeds are not mentioned (Lett, Norton, et al., 2016; Lett, Yeomans, Norton, & 403
Norton, 2016). These reports suggests that there is growing interest in lubrication measurements 404
but these have yet to be studied in depth for a potential contribution (if any) to satiety and food 405
intake. 406
Meta-analysis
The 38 articles included in the meta-analysis were divided into 70 individual subgroups. The 408
narrative part of this systematic review indicated that for the two appetite ratings (hunger and desire 409
to eat), the different methodology of a fixed or ad libitum meal might have significant effects on 410
the study outcomes. The studies were divided into groups where either a fixed amount was used for 411
the oral processing manipulation (Type 1), or where an ad libitum amount of food was presented 412
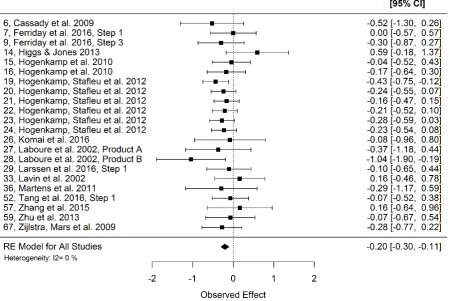
(Type 2). For the meta-analysis on hunger ratings, 14 Type 1 studies including 22 subgroups and 413
14 Type 2 studies with 22 subgroups reported data. The studies where chewing gum was used to 414
manipulate oral processing, and thus no food was ingested, were not included in the meta-analysis 415
for appetite. 416
Figure 2 shows the meta-analysis results of the Type 1 studies. The results confirmed that a higher
417
level of oral processing had a significant effect on reducing hunger ratings (-0.20 effect size, 95% 418
confidence interval CI: -0.30, -0.11, I2 statistic = 0%). The meta-analysis was also performed with 419
both the Type 1 and Type 2 studies included, and the results remained similar (-0.21 effect size, 420
95% CI: -0.27, -0.15, I2 = 0%). The ME model using moderators indicated that the included 421
moderators were unable to better explain the total amount of heterogeneity, as the heterogeneity 422
level was already 0%. Subgroup analysis revealed that the oral processing variables eating rate and 423
texture had a significant effect on hunger ratings, whereas bite size, oral residence time, number of 424
chews and texture complexity on their own did not affect hunger. It is however important to note 425
that few studies were included for the latter variables, where no significant effect was found. For 426
the desire to eat ratings, 9 studies including 15 subgroups reported data. The meta-analysis showed 427
similar results to that of the hunger ratings namely that higher oral processing reduced self-reported 428
desire to eat (-0.21 effect size, 95% CI: -0.31, -0.10, I2 = 0%, see Supplementary Figure 1). 429
Meta-analysis of the food intake data included 35 studies with 65 subgroups. Study 2 by de Wijk, 430
et al. (2008) did not provide the standard deviations for food intake and therefore was not included 431
effect size, 95% CI: -0.36, -0.19, I2 = 61.52%), as can be observed in Figure 3. This is in line with 433
what we expected, given the large amount of individual studies that found a significant effect. The 434
I2 value did indicate a moderate level of heterogeneity, however the ME model using moderators 435
did not result in a consistent improvement. Subgroup analysis revealed that there was no significant 436
effect of oral residence time alone on food intake, however there were only two studies that looked 437
specifically at oral residence time. The other oral processing factors all included more than two 438
studies, and all showed a significant effect on reducing food intake. Furthermore, as there are 439
different processes that might affect food intake over time, such as cephalic-phase responses in 440
anticipation of food after eating chewing gum or cognitive processes due to the increased expected 441
satiating power of harder, thicker and chewier food, the meta-analysis outcome was tested when 442
Type 1 studies were excluded. However, when only looking at the studies that measured ad libitum 443
food intake at the same time as the oral processing intervention, the outcome was not affected (-0.45 444
effect size, 95% CI: -0.55, -0.35, I2 = 69.06%). 445
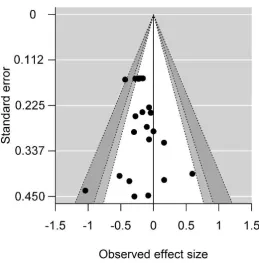
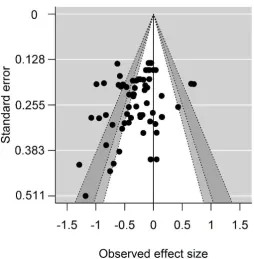
Publication bias was assessed using funnel plots and the Egger’s regression test. The funnel plot 446
for the hunger ratings (Figure 4) shows a relatively good distribution over the vertical axis, 447
indicating that studies with different sample sizes were included. However, the majority of the 448
studies clustered towards to the left of the mean, indicating there might be evidence of publication 449
bias. Nevertheless, this visual impression was not supported by the Egger’s test (P = 0.17, CI: -450
1.01, 0.18). The asymmetry in the funnel plot for food intake in Figure 5 also shows a potential 451
bias in favor of studies that found oral processing had an effect on lowering food intake. This was 452
confirmed by the Eggers’s test (P = 0.000, CI: -3.59, -1.25). 453
Discussion
454
The main aim of this comprehensive systematic review and meta-analysis was to understand the 455
impact of oral processing, including chewing and lubrication, on appetite and food intake. It was 456
intake. Oral processing is an important factor in the development of satiation and satiety. The 458
results of this review indicate that self-reported appetite and measured food intake are influenced 459
by manipulating components of oral processing such as eating rate, texture and chewing. Thus, 460
where participants are instructed to use a certain oral processing strategy such as the number of 461
times a food is chewed, this will alter how much is eaten. Where participants are provided with 462
foods which increase oral residence time, and/or slow the rate of eating, this reduced subjective 463
appetite. The analyses demonstrate that increased oral processing appears to promote satiation, 464
although it is difficult to isolate which specific component is directly influencing the outcome. 465
Larsen, Tang, Ferguson, and James (2016) developed a model food where the oral residence time 466
was kept constant while texture complexity was varied. This enabled the study to examine texture 467
complexity controlling for oral exposure time. They found that providing a more complex, orally 468
stimulating first course promoted satiation and reduced food intake at a subsequent second course. 469
Therefore, enhanced oral processing through greater textural complexity, can lead to enhanced 470
satiety. 471
Few studies have been performed focusing on the effects of oral lubrication on appetite and satiety, 472
even though this is an aspect that is also manipulated when looking at foods with differently 473
designed textures (e.g. soft vs hard). Additionally, it is worth noting that saliva has an important 474
role in the cephalic phase linked to amylase digestion (Giduck, Threatte, & Kare, 1987), however 475
this was not within the scope of the present review and we have only considered the lubrication 476
(tribological) aspects of saliva. 477
The results of these meta-analyses suggest that varying different components of oral processing 478
taken together, can have a significant influence on reducing hunger ratings and food intake. Overall, 479
from the literature included in this systematic review, it is clear that all studies involved a relatively 480
low number of participants (varying from 9 to 120) and a short-term intervention (only once in most 481
(from weeks to months) are needed to understand the impact of oral processing on long-term satiety 483
enhancement and its potential in weight management. In addition, product differences need to be 484
large enough to be detectable by consumers to find a potential influence due to oral processing. 485
The lack in standardization of study design is a key limitation in this systematic review. Blundell 486
et al (2010) have advocated that for all studies of satiation and satiety, a framework should be 487
applied to standardize procedures; as was also suggested by the results in this review, by 488
standardization of prior hunger levels using a fixed meal before the oral processing intervention 489
takes place, the actual study effects can be studied more carefully (Blundell, et al., 2010). The 490
recommended study procedure for satiation studies includes a standard, fixed meal based on 491
individuals’ estimated daily energy needs before oral processing is manipulated. Furthermore, for 492
satiety studies, the satiety quotient, the time until the next eating occasion, should be reported in 493
addition to subjective hunger ratings and how much is eaten at the next eating occasion (Blundell, 494
et al., 2010). Thus, conclusions regarding the effects of oral processing on satiety must be made 495
with caution since varying results may be attributable to differences in study design. Moreover, 496
dimensions such as food type, meal occasion, differences between individuals or specific 497
participant groups, such as male/female (Martin, et al., 2007) or low/high BMI status (Mattes & 498
Considine, 2013; Zhu & Hollis, 2014), appeared to have an influence on the outcome as well. 499
A systematic review and meta-analysis by Robinson, et al. (2014) studied the effects of the specific 500
oral processing characteristic of eating rate on hunger and energy intake. They concluded that a 501
slower eating rate led to a lower energy intake as compared to a faster eating rate, and that different 502
ways in which eating rate could be manipulated (directly or indirectly) did not alter the outcome. 503
No effect of eating rate on hunger was found directly after the meal or up to 3.5h after the meal, 504
both in the analysis with ad libitum studies as well as the fixed studies. The difference with our 505
results on the hunger ratings could be explained by including more oral processing variables, and 506
also many more studies were included (five compared to 22 subgroups in the current review with 507
outcome measure of hunger ratings and energy intake under different oral processing conditions, 509
with the addition of gut hormones and metabolites. Besides hunger ratings, meta-analyses in the 510
current review focused on food intake and desire to eat data, thereby broadening the scope of the 511
review. Also, the oral processing definition was expanded to include aspects of lubrication and 512
saliva incorporation. Finally, oral processing parameters were grouped together according to the 513
recommended oral processing strategies commonly suggested for better weight management such 514
as slow eating rates, high number of chews and longer oral resident time (Christen & Christen, 515
1997; Ford, et al., 2010; Smit, et al., 2011). Moreover, additional data not included in the original 516
publication was requested from authors. Instead of comparing 13 subgroups as was reported by 517
Miquel-Kergoat, et al. (2015), the current review included hunger ratings from 22 subgroups. 518
Therefore, the present review allows a more comprehensive and advanced analysis by broadening 519
the scope of the used measures, expanding the search to include lubrication, and performing detailed 520
analysis using raw data from authors. 521
Conclusions
522
In this study we conducted a comprehensive systematic review to assess different oral processing 523
characteristics on appetite ratings and food intake. In order to address this quantitatively, a meta-524
analysis was undertaken to test the effect size of self-reported appetite ratings and objectively 525
measured food intake in studies that manipulated oral processing parameters, such as oral residence 526
time, texture, eating rate, chewing and lubrication. The meta-analysis demonstrated that 527
manipulating oral processing through slow eating rates and textural complexity reduced subjective 528
appetite and greater oral processing through strategies such as greater chewing reduced food intake. 529
Although evidence was found for the effects of oral processing on appetite ratings and food intake, 530
this systematic review identified a clear gap in knowledge on the influence of saliva incorporation 531
and oral lubrication on appetite ratings and food intake. The influence of the lubrication parameters 532
Furthermore, the studies involving lubrication did not perform tribological measurements of the 534
food and the bolus to quantify differences in lubrication profiles. Future research should be 535
conducted following the framework outlined by Blundell, et al. (2010) and standardize prior hunger 536
before oral processing manipulations, which should be apparent and not subtle. With carefully 537
planned and standardized procedures, the knowledge base on the importance of all aspects of oral 538
processing, including both chewing and lubrication, for satiation and satiety development will be 539
expanded and potential application to weight management can be explored. Such knowledge, 540
together with longer interventions, are needed to underpin the creation of the next generation of 541
foods for weight management and allow the development of coordinated public health strategies to 542
tackle obesity. 543
Acknowledgements
544
We would like to thank all the authors that we contacted for providing the raw data which allowed 545
us to include them into our meta-analyses. We would also like to thank Jon E.L. Day, BSc (Hons), 546
PhD, FSB, CBiol, Cerebrus Associates Limited currently employed as a consultant to Wrigley for 547
his constructive comments and judicious editing of this systematic review and meta-analysis. 548
Author contributions statement
549
The authors’ responsibilities were as follows — MH and AS: designed the research; EK: developed 550
the search protocol, conducted the systematic review and collected and organized the data for the 551
meta-analysis; EK and CN: prepared the data for meta-analyses; LP: ran the meta-analyses; EK, 552
CN and LP: analyzed and interpreted the meta-analysis results; EK: wrote the manuscript; MH, SM 553
and AS: contributed to revisions of the manuscript; AS and MH: had primary responsibility for 554
final content; and all authors: read, edited and approved the final manuscript. 555
Conflict of interest statement
556
Funding
558
This work was supported by the University of Leeds 110 Anniversary Research Scholarship with 559
matched support from Mars-Wrigley, awarded to EK for her PhD studies. 560
References
561
Andrade, A. M., Greene, G. W., & Melanson, K. J. (2008). Eating slowly led to decreases in energy 562
intake within meals in healthy women. Journal of the American Dietetic Association, 108, 563
1186-1191. 564
Blundell, J. E., de Graaf, C., Finlayson, G., Halford, J. C. G., Hetherington, M. M., King, N. A., & 565
Stubbs, J. (2009). Measuring food intake, hunger, satiety and satiation in the laboratory. In 566
D. B. Allison & M. L. Baskin (Eds.), Handbook of Assessment Methods for Eating 567
Behaviours and Weight-Related Problems : Measures, Theory and Research [2nd. ed.] ) 568
(pp. 283-325). Newbury Park, California: Sage. 569
Blundell, J. E., de Graaf, C., Hulshof, T., Jebb, S., Livingstone, B., Lluch, A., Mela, D., Salah, S., 570
Schuring, E., van der Knaap, H., & Westerterp, M. (2010). Appetite control: methodological 571
aspects of the evaluation of foods. Obesity Reviews, 11, 251-270. 572
Bolhuis, D. P., Forde, C. G., Cheng, Y., Xu, H., Martin, N., & de Graaf, C. (2014). Slow food: 573
sustained impact of harder foods on the reduction in energy intake over the course of the 574
day. PLoS One, 9, e93370. 575
Bolhuis, D. P., Lakemond, C. M. M., de Wijk, R. A., Luning, P. A., & de Graaf, C. (2011). Both 576
longer oral sensory exposure to and higher intensity of saltiness decrease ad libitum food 577
intake in healthy normal-weight men. Journal of Nutrition, 141, 2242-2248. 578
Borenstein, M., Hedges, L. V., Higgins, J. P. T., & Rothstein, H. R. (2009). Effect sizes based on 579
means. In Introduction to Meta-Analysis (pp. 21-32): John Wiley & Sons, Ltd. 580
Bosworth, M. L. (2015). Variation in the oral processing of everyday meals is associated with 581
fullness and meal size; a potential nudge to reduce energy intake. In: data.bris Research 582
Data Repository. 583
Cassady, B. A., Hollis, J. H., Fulford, A. D., Considine, R. V., & Mattes, R. D. (2009). Mastication 584
of almonds: effects of lipid bioaccessibility, appetite, and hormone response. Am J Clin 585
Nutr, 89, 794-800. 586
Chen, J. (2009). Food oral processing - a review. Food Hydrocolloids, 23, 1-25. 587
Chen, J., & Stokes, J. R. (2012). Rheology and tribology: two distinctive regimes of food texture 588
sensation. Trends in Food Science & Technology, 25, 4-12. 589
Christen, A. G., & Christen, J. A. (1997). Horace Fletcher (1849-1919): "The Great Masticator.". 590
Journal of the History of Dentistry, 45, 95-100. 591
Egger, M., Davey Smith, G., Schneider, M., & Minder, C. (1997). Bias in meta-analysis detected 592
by a simple, graphical test. Bmj, 315, 629-634. 593
Ferriday, D., Bosworth, M. L., Godinot, N., Martin, N., Forde, C. G., van den Heuvel, E., Appleton, 594
S. L., Moss, F. J. M., Rogers, P. J., & Brunstrom, J. M. (2016). Variation in the oral 595
processing of everyday meals is associated with fullness and meal size; A potential nudge 596
Ford, A. L., Bergh, C., Södersten, P., Sabin, M. A., Hollinghurst, S., Hunt, L. P., & Shield, J. P. H. 598
(2010). Treatment of childhood obesity by retraining eating behaviour: randomised 599
controlled trial. Bmj, 340. 600
Forde, C. G., Kuijk, N., Thaler, T., de Graaf, C., & Martin, N. (2013). Oral processing 601
characteristics of solid savoury meal components, and relationship with food composition, 602
sensory attributes and expected satiation. Appetite, 60, 208-219. 603
Gavião, M. B. D., Engelen, L., & van der Bilt, A. (2004). Chewing behavior and salivary secretion. 604
European Journal of Oral Sciences, 112, 19-24. 605
Giduck, S. A., Threatte, R. M., & Kare, M. R. (1987). Cephalic reflexes: their role in digestion and 606
possible roles in absorption and metabolism. J Nutr, 117, 1191-1196. 607
Hetherington, M. M., & Boyland, E. (2007). Short-term effects of chewing gum on snack intake 608
and appetite. Appetite, 48, 397-401. 609
Hetherington, M. M., Cunningham, K., Dye, L., Gibson, E. L., Gregersen, N. T., Halford, J. C., 610
Lawton, C. L., Lluch, A., Mela, D. J., & van Trijp, H. C. (2013). Potential benefits of satiety 611
to the consumer: scientific considerations. Nutr Res Rev, 26, 22-38. 612
Hetherington, M. M., & Regan, M. F. (2011). Effects of chewing gum on short-term appetite 613
regulation in moderately restrained eaters. Appetite, 57, 475-482. 614
Higgins, J. P. T., Thompson, S. G., Deeks, J. J., & Altman, D. G. (2003). Measuring inconsistency 615
in meta-analyses. Bmj, 327, 557-560. 616
Higgs, S., & Jones, A. (2013). Prolonged chewing at lunch decreases later snack intake. Appetite, 617
62, 91-95. 618
Hill, J. O. (2006). Understanding and Addressing the Epidemic of Obesity: An Energy Balance 619
Perspective. Endocrine Reviews, 27, 750-761. 620
Hogenkamp, P. S., Mars, M., Stafleu, A., & de Graaf, C. (2010). Intake during repeated exposure 621
to low- and high-energy-dense yogurts by different means of consumption. Am J Clin Nutr, 622
91, 841-847. 623
Hogenkamp, P. S., Mars, M., Stafleu, A., & de Graaf, C. (2012). Repeated consumption of a large 624
volume of liquid and semi-solid foods increases ad libitum intake, but does not change 625
expected satiety. Appetite, 59, 419-424. 626
Hogenkamp, P. S., & Schiöth, H. B. (2013). Effect of oral processing behaviour on food intake and 627
satiety. Trends in Food Science and Technology, 34, 67-75. 628
Hogenkamp, P. S., Stafleu, A., Mars, M., & de Graaf, C. (2012). Learning about the energy density 629
of liquid and semi-solid foods. International Journal of Obesity, 36, 1229-1235. 630
Joyner, H. S., Pernell, C. W., & Daubert, C. R. (2014). Impact of formulation and saliva on acid 631
milk gel friction behavior. Journal of Food Science, 79, E867-E880. 632
Julis, R. A., & Mattes, R. D. (2007). Influence of sweetened chewing gum on appetite, meal 633
patterning and energy intake. Appetite, 48, 167-175. 634
Komai, N., Motokubota, N., Suzuki, M., Hayashi, I., Moritani, T., & Nagai, N. (2016). Thorough 635
mastication prior to swallowing increases postprandial satiety and the thermic effect of a 636
meal in young women. Journal of Nutritional Science and Vitaminology, 62, 288-294. 637
Labouré, H., van Wymelbeke, V., Fantino, M., & Nicolaidis, S. (2002). Behavioral, plasma, and 638
calorimetric changes related to food texture modification in men. American Journal of 639
Laguna, L., Farrell, G., Bryant, M., Morina, A., & Sarkar, A. (2017). Relating rheology and 641
tribology of commercial dairy colloids to sensory perception. Food & Function, 8, 563-573. 642
Laguna, L., & Sarkar, A. (2016). Influence of mixed gel structuring with different degrees of matrix 643
inhomogeneity on oral residence time. Food Hydrocolloids, 61, 286-299. 644
Laguna, L., & Sarkar, A. (2017). Oral tribology: update on the relevance to study astringency in 645
wines. Tribology - Materials, Surfaces & Interfaces, 11, 116-123. 646
Larsen, D. S., Tang, J., Ferguson, L. R., & James, B. J. (2016). Increased textural complexity in 647
food enhances satiation. Appetite, 105, 189-194. 648
Lasschuijt, M. P., Mars, M., Stieger, M., Miquel-Kergoat, S., de Graaf, C., & Smeets, P. A. M. 649
(2017). Comparison of oro-sensory exposure duration and intensity manipulations on 650
satiation. In Physiology and behavior. (no pagination), 2017 (Vol. Date of Publication: 651
November 08). 652
Lavin, J. H., French, S. J., Ruxton, C. H. S., & Read, N. W. (2002). An investigation of the role of 653
oro-sensory stimulation in sugar satiety. International Journal of Obesity, 26, 384-388. 654
Lett, A. M., Norton, J. E., & Yeomans, M. R. (2016). Emulsion oil droplet size significantly affects 655
satiety: A pre-ingestive approach. Appetite, 96, 18-24. 656
Lett, A. M., Yeomans, M. R., Norton, I. T., & Norton, J. E. (2016). Enhancing expected food intake 657
behaviour, hedonics and sensory characteristics of oil-in-water emulsion systems through 658
microstructural properties, oil droplet size and flavour. Food Quality and Preference, 47, 659
148-155. 660
Li, J., Zhang, N., Hu, L., Li, Z., Li, R., Li, C., & Wang, S. (2011). Improvement in chewing activity 661
reduces energy intake in one meal and modulates plasma gut hormone concentrations in 662
obese and lean young Chinese men. Am J Clin Nutr, 94, 709-716. 663
Martens, M. J., Lemmens, S. G., Born, J. M., & Westerterp-Plantenga, M. S. (2011). A solid high-664
protein meal evokes stronger hunger suppression than a liquefied high-protein meal. Obesity 665
(Silver Spring, Md.), 19, 522-527. 666
Martin, C. K., Anton, S. D., Walden, H., Arnett, C., Greenway, F. L., & Williamson, D. A. (2007). 667
Slower eating rate reduces the food intake of men, but not women: Implications for 668
behavioral weight control. Behaviour Research and Therapy, 45, 2349-2359. 669
Mattes, R. D., & Considine, R. V. (2013). Oral processing effort, appetite and acute energy intake 670
in lean and obese adults. Physiology & Behavior, 120, 173-181. 671
McCrickerd, K., Chambers, L., & Yeomans, M. R. (2014). Does modifying the thick texture and 672
creamy flavour of a drink change portion size selection and intake? Appetite, 73, 114-120. 673
McCrickerd, K., Lim, C. M., Leong, C., Chia, E. M., & Forde, C. G. (2017). Texture-based 674
differences in eating rate reduce the impact of increased energy density and large portions 675
on meal size in adults. J Nutr. 676
Miquel-Kergoat, S., Azais-Braesco, V., Burton-Freeman, B., & Hetherington, M. M. (2015). 677
Effects of chewing on appetite, food intake and gut hormones: a systematic review and 678
meta-analysis. Physiology and Behavior, 151, 88-96. 679
Moore, C. L. (2012). The caring experience of staff carers working with adults with learning 680
disability and dementia. University of Hull. 681
Morell, P., Fiszman, S. M., Varela, P., & Hernando, I. (2014). Hydrocolloids for enhancing satiety: 682
relating oral digestion to rheology, structure and sensory perception. Food Hydrocolloids, 683
Morell, P., Hernando, I., Llorca, E., & Fiszman, S. M. (2015). Yogurts with an increased protein 685
content and physically modified starch: rheological, structural, oral digestion and sensory 686
properties related to enhanced satiating capacity. Food Research International, 70, 64-73. 687
Mourao, D. M., Bressan, J., Campbell, W. W., & Mattes, R. D. (2007). Effects of food form on 688
appetite and energy intake in lean and obese young adults. Int J Obes, 31, 1688-1695. 689
Nolan, L. J., & Hetherington, M. M. (2009). The effects of sham feeding-induced sensory specific 690
satiation and food variety on subsequent food intake in humans. Appetite, 52, 720-725. 691
Park, E., Edirisinghe, I., Inui, T., Miquel-Kergoat, S., Kelley, M., & Burton-Freeman, B. (2016). 692
Short-term effects of chewing gum on satiety and afternoon snack intake in healthy weight 693
and obese women. Physiology & Behavior, 159, 64-71. 694
Robinson, E., Almiron-Roig, E., Rutters, F., de Graaf, C., Forde, C. G., Tudur Smith, C., Nolan, S. 695
J., & Jebb, S. A. (2014). A systematic review and meta-analysis examining the effect of 696
eating rate on energy intake and hunger. Am J Clin Nutr, 100, 123-151. 697
Sarkar, A., & Singh, H. (2012). Oral behaviour of food emulsions. In Food Oral Processing (pp. 698
111-137): Wiley-Blackwell. 699
Sarkar, A., Ye, A., & Singh, H. (2017). Oral processing of emulsion systems from a colloidal 700
perspective. Food & Function, 8, 511-521. 701
Smit, H. J., Kemsley, E. K., Tapp, H. S., & Henry, C. J. K. (2011). Does prolonged chewing reduce 702
food intake? Fletcherism revisited. Appetite, 57, 295-298. 703
Spiegel, T. A., Kaplan, J. M., Tomassini, A., & Stellar, E. (1993). Bite size, ingestion rate, and meal 704
size in lean and obese women. Appetite, 21, 131-145. 705
Stokes, J. R., Boehm, M. W., & Baier, S. K. (2013). Oral processing, texture and mouthfeel: From 706
rheology to tribology and beyond. Current Opinion in Colloid & Interface Science, 18, 349-707
359. 708
van Strien, T., Frijters, J. E. R., Bergers, G. P. A., & Defares, P. B. (1986). The Dutch Eating 709
Behavior Questionnaire (DEBQ) for assessment of restrained, emotional, and external 710
eating behavior. International Journal of Eating Disorders, 5, 295-315. 711
Stubbs, R. J., Hughes, D. A., Johnstone, A. M., Rowley, E., Reid, C., Elia, M., Stratton, R., Delargy, 712
H., King, N., & Blundell, J. E. (2000). The use of visual analogue scales to assess motivation 713
to eat in human subjects: a review of their reliability and validity with an evaluation of new 714
hand-held computerized systems for temporal tracking of appetite ratings. The British 715
journal of nutrition, 84, 405-415. 716
Stunkard, A. J., & Messick, S. (1985). The three-factor eating questionnaire to measure dietary 717
restraint, disinhibition and hunger. J Psychosom Res, 29, 71-83. 718
Swoboda, C., & Temple, J. L. (2013). Acute and chronic effects of gum chewing on food 719
reinforcement and energy intake. Eating Behaviors, 14, 149-156. 720
Tang, J., Larsen, D. S., Ferguson, L. R., & James, B. J. (2016). The effect of textural complexity of 721
solid foods on satiation. Physiol Behav, 163, 17-24. 722
Viskaal-van Dongen, M., Kok, F. J., & de Graaf, C. (2011). Eating rate of commonly consumed 723
foods promotes food and energy intake. Appetite, 56, 25-31. 724
Weijzen, P. L. G., Liem, D. G., Zandstra, E. H., & de Graaf, C. (2008). Sensory specific satiety and 725
intake: the difference between nibble- and bar-size snacks. Appetite, 50, 435-442. 726
de Wijk, R. A., Zijlstra, N., Mars, M., de Graaf, C., & Prinz, J. F. (2008). The effects of food 727