This is a repository copy of Distance metric choice can both reduce and induce collinearity in geographically weighted regression.
White Rose Research Online URL for this paper: http://eprints.whiterose.ac.uk/131530/
Version: Accepted Version
Article:
Comber, A orcid.org/0000-0002-3652-7846, Chi, K, Quang Huy, M et al. (4 more authors) (2018) Distance metric choice can both reduce and induce collinearity in geographically weighted regression. Environment and Planning B: Urban Analytics and City Science. ISSN 2399-8083
https://doi.org/10.1177/2399808318784017
(c) The Author(s) 2018. This is an author produced version of a paper accepted for
publication in Environment and Planning B: Urban Analytics and City Science. Uploaded in accordance with the publisher's self-archiving policy.
[email protected] https://eprints.whiterose.ac.uk/
Reuse
Items deposited in White Rose Research Online are protected by copyright, with all rights reserved unless indicated otherwise. They may be downloaded and/or printed for private study, or other acts as permitted by national copyright laws. The publisher or other rights holders may allow further reproduction and re-use of the full text version. This is indicated by the licence information on the White Rose Research Online record for the item.
Takedown
If you consider content in White Rose Research Online to be in breach of UK law, please notify us by
1
Distance metric choice can both reduce and induce collinearity in geographically weighted regression
Alexis Comber1, Khanh Chi2, Man Quang Huy3, Quan Nguyen4, Binbin Lu5, Hoang Huu
Phe6 and Paul Harris7
1
School of Geography, University of Leeds, LS2 9JT, UK
2
GeoViet Consulting Co., Ltd, Hanoi, Vietnam
3
Vietnam National University Hanoi
4
National University of Civil Engineering, Hanoi, Vietnam
5
Wuhan University, Wuhan, China
6
Vinaconex R&D, Hanoi, Vietnam
7
Rothamsted Research, North Wyke, EX20 2SB, UK
Abstract
This paper explores the impact of different distance metrics on collinearity in local regression
models such as Geographically Weighted Regression (GWR). Using a case study of house
price data collected in Hˆ Nội, Vietnam, and by fully varying both power and rotation parameters to create different Minkowski distances, the analysis shows that local collinearity
can be both negatively and positively affected by distance metric choice. The Minkowski
distance that maximised collinearity in GWR was approximate to a Manhattan distance with
(power = 0.70) with a rotation of 30¡, and that which minimised collinearity was parameterised
with power = 0.05 and a rotation of 70¡. The results indicate that distance metric choice can
provide a useful extra tuning component to address local collinearity issues in spatially varying
coefficient modelling and that understanding the interaction of distance metric and collinearity
can provide insight into the nature and structure of the data relationships. The discussion
considers first, the exploration and selection of different distance metrics to minimise
collinearity as an alternative to localised ridge regression, lasso and elastic net approaches.
Second, it discusses the how distance metric choice could extend the methods that additionally
optimise local model fit (lasso and elastic net) by selecting a distance metric that further helped
minimise local collinearity. Third, it identifies the need to investigate the relationship between
kernel bandwidth, distance metrics and collinearity as an area of further work.
2 1. Introduction
Geographically weighted regression (GWR) is a technique used to explore spatially-varying
data relationships (Brunsdon et al. 1996, Fotheringham et al. 2002). Its original conception
reflected a desire to move beyond from global, Ôwhole mapÕ (Openshaw 1996) and
Ôone-size-fits-allÕ (Fotheringham and Brunsdon 1999) statistics to ones that captured and reflected local
process heterogeneity. This was reflected in GoodchildÕs (2004) proposal for a second law of
geography, the principle of spatial heterogeneity or nonstationarity, in which he noted the lack
of a Ôconcept of an average place on the Earth's surface comparable, for example, to the concept
of an average humanÕ (Goodchild 2004, p302). For regression, and from a nonstationary
relationship viewpoint, a number of localised approaches have been developed including the
expansion method (Casetti 1972), weighted spatial adaptive filtering model (Gorr and
Olligschlaeger 1994), GWR, Bayesian space-varying coefficient (SVC) models (Gelfand et al.
2003; Assun•‹o 2003) and re-focused versions of eigenvector spatial filtering (ESF) (Griffith
2008; Murakiami et al. 2017). Other aspects of nonstationarity in regression can also be
considered, such as those centred around the error term (e.g. Paez et al. 2002a, 2002b; Harris
et al. 2010; 2011a). In particular, GWR has been the most widely applied localised regression
in geographical analyses. It has conceptual simplicity: as geographers, we implicitly expect
processes and relationships to vary locally and not to be the same everywhere. Rather, we
acknowledge that the relationship among predictor and response variables may change over
space. GWR provides a tool to identify and explore these varying relationships. The originators
have long supported different implementations, either as standalone (e.g. GWR3.x Charlton et
al. 2003) or as packages (e.g. R package GWmodel by Lu et al. 2014a, Gollini et al. 2015). It
has been also incorporated as a tool in the most popular GIS software (ESRI 2009).
The operation of GWR, and other geographically weighted (GW) models such as GW principle
components analysis (Harris et al. 2011b), involves performing location-wise calibrations
using subsets of the data (observations) around each location. Observations nearest to the
calibration point are given the greatest weight, while data points beyond a certain threshold
distance (i.e. bandwidth) are given a negligible or zero weight, depending on the distance-decay
function used. GWR has certain elegance. First, it reflects public and scientific intuition about
and experience of spatial variation: birds of a feather do flock together and most anthropogenic
and environmental processes cluster rather than being evenly or randomly distributed. Second,
3
measurement of geographical processes, and implicitly reflected in ToblerÕs first law of
geography (Tobler 1970).
There are a number of critical considerations in any GW analysis, the most important of which
is bandwidth selection as this determines how many data points could be included in each local
calculation and the associated degree of smoothing in the model outputs. So for a GWR model,
the bandwidth determines the degree of variation in local regression coefficient estimates.
Bandwidths can be a fixed distance or an adaptive distance, where that latter defines a fixed
number of nearest data points. Bandwidth calibration routines exist to determine the optimal
(fixed or adaptive) bandwidth by maximising some measure of model fit such as Akaike
information criterion (Akaike 1973) or leave-one-out cross validation (e.g. Cleveland 1979;
Bowman 1984; Brunsdon et al. 1996). Further studies for selecting bandwidths in GWR include
P‡ez (2004) for anisotropic bandwidths, Farber and P‡ez (2007) for a robust bandwidth
selection, Brunsdon et al. (1999) and Nakaya et al. (2005) for bandwdiths in mixed GWR,
Fotheringham et al. (2017) and Lu et al. (2017a) for scale-dependent bandwidths and
Fotheringham et al. (2015) for spatio-temporal bandwidths. A second important concern is the
nature of the weighting scheme, which is implicitly connected with the selection of a distance
metric. Choice of distance metric in GWR has been advanced by Lu et al. (2014a, 2015, 2016,
2017a) who used network distance, travel times, Minkowski distances and parameter-specific
distance metrics to improve GWR model fit.
GWR has been criticised for its poor inferential properties, which primarily stems from GWR
being a collection of local models, where data are partially re-used from neighbouring local
models, and where no single non-stationary model exists, unlike, say, a Bayesian SVC model
which itself, is based on a multivariate geostatistical construct (e.g. see Finlay 2011). Similarly,
Griffith (2008) notes the degrees-of-freedom problem, describing GWR as a Ôbrute-force
version of indirect spatial filteringÕ. Despite these valid criticisms, a considered application of
GWR can still provide an important and robust exploratory tool, and benefits from an inherent
simplicity.
A criticism of GWR however, that has attracted much attention relates to that of collinearity,
as first articulated by Wheeler and Tiefelsdorf (2005), and first addressed by Wheeler (2007).
Collinearity occurs when pairs of predictor variables have a strong positive or negative
4
and can result in unstable coefficient estimates, inflated standard errors and inferential biases
(Dormann et al. 2013). As a result, model extrapolation may be erroneous and there may be
problems in separating variable effects (Meloun et al. 2002). Various approaches exist to
address collinearity in regression modelling, such as partial least squares regression, principal
component analysis regression, ridge regression (Hoerl 1962, Hoerl and Kennard 1970) and
extensions, such as the lasso (Tibshirani 1996) and the elastic net also provide predictor
variable sub-set selection (Zou and Hastie 2005).
In GWR, collinearity may be observed in the local subsets of the data under the kernel even
when they are not observed globally (Wheeler and Tiefelsdorf 2005, Wheeler 2007).
Accounting for the presence of local collinearity is highly recommended in any GWR analysis
and options include a globally-defined ridge GWR (Wheeler 2007), a locally-defined ridge
GWR (Brunsdon et al. 2012), GWR models where the kernel bandwidth is locally increased in
areas of strong collinearity (Brunsdon et al. 2012; B‡rcena et al. 2014) and a GW lasso
(Wheeler 2009; Yoneoka et al. 2016). Wheeler (2007), Lu et al. (2014b) and Gollini et al.
(2015) describe sets of localised diagnostic tools that can gauge the nature of collinear effects
in any given GWR calibration, such as the mapping of local matrix condition numbers. Such
diagnostics are used in this study.
In summary, a GWR undertakes a series of local regressions. Subsets of data are borrowed
from nearby locations and their contribution is weighted by their distance to the location under
consideration. The kernel bandwidth determines how much data is included in each subset for
each local regression. The distance metric in GWR is commonly Euclidean, but any metric is
possible and a carefully chosen distance metric and associated bandwidth can improve model
fit (e.g. Lu et al. 2014a). Collinearity affects model reliability and precision and may be present
locally in GWR even when not observed in the global regression. Although adaptations of
GWR are available to cater for collinearity (e.g. ridge, lasso), as yet no research has considered
the impacts of the choice of distance metric on collinearity. Whilst Lu et al. (2014a, 2015, 2016,
2017a) have considered different distance metrics these have all been considered with respect
to model fit. This paper explores the impacts of different Minkowski distances, where the
power and rotation parameters are allowed to vary, and road network distance on local
measures of collinearity using a house price case study in Hˆ Nội, Vietnam.
5 2.1 Data
A detailed house price survey of nearly 1,000 households sampled from a 400m x 400m grid
was undertaken in 2014 in Hˆ Nội, Vietnam. It collected data for a range of predictor variables,
describing property characteristics including:
-! Number of residents (TotNum)
-! Years in education of householder (EdYears)
-! Number of separate bedrooms (SepBed)
-! Ground floor area (m2) (GFA)
-! Plot area (m2) (PlotArea)
-! Length of frontage (m) (Frontage)
-! Perceived travel time to city centre (minutes) (TimeCity)
-! House price per square metre (VND m-2) (Ppsqm)
-! Euclidean distance to city centre (m) (DistCity)
The data were cleaned for missing and NULL variables and the result was 558 data points. The
nine predictor variables were used to model house price in millions of Vietnamese Dong. The
6
Figure 1. The study area in Hˆ Nội, the 558 survey data points with a small transparency to
show their density and an OpenStreetMap backdrop.
2.2 Analysis
The study aim was to explore the impacts of different distance metrics in a GWR model with
respect to collinearity. The data points in Figure 1 were used as the GWR calibration points.
GWR is similar to ordinary least squares (OLS) regression, but is an extension to the spatial
domain. As OLS is a non-spatial model, it can be defined as:
�∀ = �&+ �(�∀(+ �∀ +
(,−
(1)
where for observations indexed by i=1,!,n, �∀ is the response variable (house price), �∀(
is the value of the �/0 predictor variable (house characteristic), � is the number of predictor
variables, �& is the intercept term, �( is the regression coefficient for the �/0 predictor
variable and �∀ is the random error term.
Geographically weighted regression
The basic form of GWR is similar to that given in Equation 1, but with locations associated
with the model coefficient terms:
�∀ = �& �∀, �∀ + �( �∀, �∀ �∀( +
(,−
+ �∀ (2)
where
(
ui,vi)
is the spatial location of the thi observation and bk
(
ui,vi)
is a realization ofthe continuous function
(
u v)
k ,
b at point i. In matrix terms, the coefficients of GWR are
estimated from:
(
)
(
T(
)
)
T(
)
ö , , ,
i i i i i i
u v = u v -1 u v
7
where
W
(
u v
i,
i)
is a(
n
!
n
)
spatial weighting diagonal matrix determined from the kernelfunction specified below, X is a
(
n!(
m+1)
)
predictor data matrix and y is a(
n
!
1
)
response data vector.
Kernel bandwidth selection
For this study, an optimum bandwidth for GWR was found by minimizing a model fit
diagnostic via a leave-one-out cross-validation (CV) score (Bowman 1984, Brunsdon et al.
1996). Furthermore, a bi-square weighting kernel was always specified, where for each data
point under this kernel (of a given bandwidth), a weight wi,jwas calculated based on its distance
to the kernel centre as follows:
�∀,6 = 1 −
(�∀,6)<
�< , �∀,6 < � 0, ��ℎ������
(4)
where di,j is the distance in from the kernel centre to the data point Pj and b is the bandwidth.
Collinearity
The preceding section describes the generic construction of a GWR model. In order to
understand the impacts of distance metric choices on collinearity, different distance metrics
were used to parameterise a sequence of GWR models, which were then subject to a collinearity
diagnostic procedure that determined their local design matrix condition number (CN). Other
measures of local collinearity are available, such as local predictor variable correlations, local
variance decomposition proportions (VDPs) and local variance inflation factors (VIFs). A
thorough investigation of local collinearity in a GWR analysis would report, local CNs, local
correlations, local VDPs and local VIFs, as no individual diagnostic provides a full picture of
collinearity (Wheeler 2007). For example, VIFs do not detect collinearity with the intercept
(Wheeler 2010). However, local CNs have been found to provide a superior diagnostic for
investigating local collinearity (Wheeler 2007) and only this diagnostic is reported here.
Specifically, the CN of the local design matrix can be calculated using the method described
in Belsley et al. (1980), and CNs greater than 30 are suggestive of likely collinearity issues
amongst any one pair of predictor variables (heuristics from Belsley et al., 1980). Local CNs
8
implemented using the gwr.collin.diagno function in the GWmodel R package (Lu et al.
2014b, 2017b, Gollini et al. 2015). This returns a local CN for each GWR calibration point.
Distance metrics
GWR and any GW model require some measure of distance in order to determine the
weightings applied to the local data subsets. Typically, the default distance metric is Euclidian
distance. Lu et al. (2016) describe the application of different Minkowski distances in GWR.
Minkowski distance is a metric in vector space which can be considered as a generalization of
Euclidean distance. In 2-dimensional Euclidian space, a generalized Minkowsi distance can be
defined as:
�ΦΓ = �−− �< <+ �−− �< <(| sin � + � |Φ+ | cos � + � |Φ) −
Φ (5)
where (�∀, �∀)∀,−,< are the coordinates in Euclidean space, and the angle a is the rotation angle
equalling to ���Θ−( ΡΣΘΡΤ ΥΣΘΥΤ ).
Different Minkowski distances can be generated by varying the exponent or power parameter,
p, together with the coordinate rotation angle, θ. Lu et al. (2016) note the difficulty in
conceptualising any specific Minkowski distance, except for the common cases of Manhattan
(p = 1), Euclidean (p = 2) and Chebyshev (� = ∞) distances, and that the rotation parameter
θadds to this difficulty. In this study, road network distances for Hˆ Nội and a sequence of
Minkowski distances were investigated, with values of p changing, but initially, the rotation
angle θ was set to 0¡ in each case.
The value of p can be any non-negative real number and θ can lie between 0 and π/2 in radians
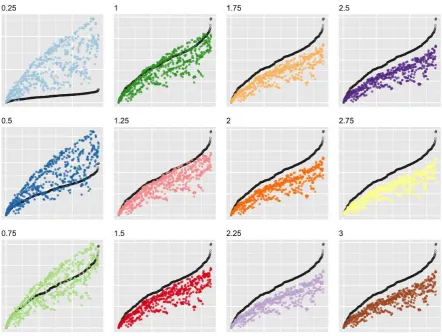
(i.e. between 0¡ and 90¡ rotation). Figure 2 compares Minkowski distances generated using
different values of p andθ = 0¡ with road network distance. The data are ordered on the x-axis
by the smallest network distance and the plots show how different values of p result in different
ranges and distributions when compared to network distances. The closest to the Hˆ Nội road
9
Figure 2. A comparison of different Minkowski distances using different power values with
Hˆ Nội road network distances for the 558 data points, with rotation set to 0 and ordered on
the x-axis by network distance.
Implementation and code
An initial analysis was undertaken to investigate the impact of different values of p on
collinearity. A sequence of values for p were generated ranging from 0.05 to 4 in steps of 0.05.
The stages of analysis for each value of p were as follows:
i.! Calculate the Minkowski distances between each of the calibration points (558 data
locations);
ii.! Determine the optimal adaptive GWR bandwidth using the leave-one-out CV score
approach using the Minkowski distances;
iii.! Run a GWR diagnostic procedure to determine the local CN at each of the 558 data
locations;
iv.! Identify the locations with CNs < 30 (i.e. not exhibiting collinearity).
This resulted in 80 GWR models, generated from Minkowski distances with a rotation, θ, of
10
values were allowed to vary between 0¡ and 90¡ in steps of 10¡, resulting in 800 GWR models
evaluated in the same way.
All of the analyses were undertaken via the R GWmodel package v.2.0-4 (Lu et al, 2017b).
3. Results
3.1 Initial investigations
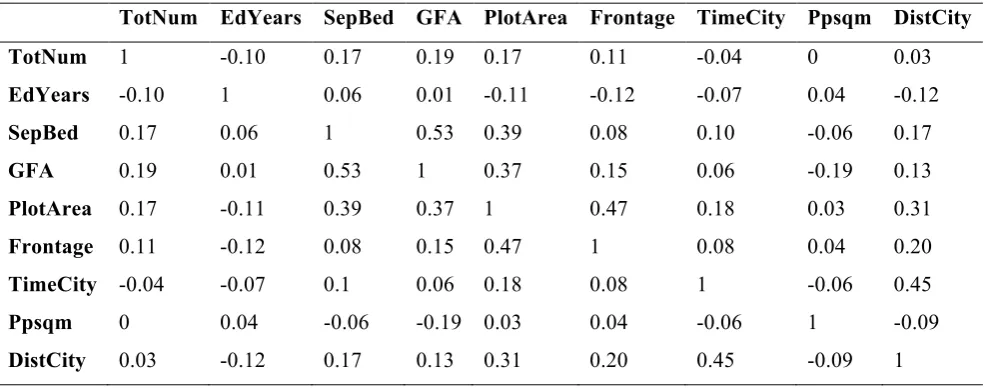
The global correlations between the nine predictor variables are shown in Table 1 and the
global CN for the OLS regression design matrix of these nine variables is 17.6. As none of the
global correlations are particularly strong together with a CN < 30, it is clear that, globally at
least, there is little evidence of collinearity amongst the predictors and that collinearity is highly
[image:11.595.59.553.383.577.2]unlikely to be a problem for this dataset.
Table 1. Global correlation coefficients between the predictor variables.
TotNum EdYears SepBed GFA PlotArea Frontage TimeCity Ppsqm DistCity
TotNum 1 -0.10 0.17 0.19 0.17 0.11 -0.04 0 0.03
EdYears -0.10 1 0.06 0.01 -0.11 -0.12 -0.07 0.04 -0.12
SepBed 0.17 0.06 1 0.53 0.39 0.08 0.10 -0.06 0.17
GFA 0.19 0.01 0.53 1 0.37 0.15 0.06 -0.19 0.13
PlotArea 0.17 -0.11 0.39 0.37 1 0.47 0.18 0.03 0.31
Frontage 0.11 -0.12 0.08 0.15 0.47 1 0.08 0.04 0.20
TimeCity -0.04 -0.07 0.1 0.06 0.18 0.08 1 -0.06 0.45
Ppsqm 0 0.04 -0.06 -0.19 0.03 0.04 -0.06 1 -0.09
DistCity 0.03 -0.12 0.17 0.13 0.31 0.20 0.45 -0.09 1
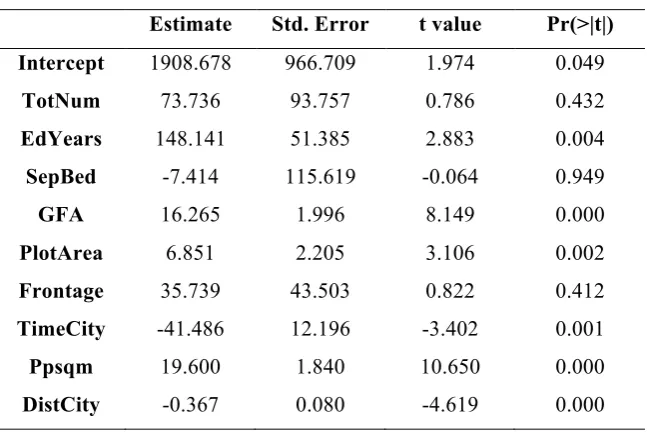
An initial OLS regression analysis was undertaken to generate a model of house price, and the
results are shown in Table 2. The R-squared was 0.35 and the adjusted R-squared was 0.34.
The high intercept value suggests that much of the variance is being captured by this term. The
coefficients for TotNum, SepBed and Frontage are not significantly different from zero. The
model could be improved by transforming the initial data values, but in-depth model
construction is not the purpose of this paper.
11
Estimate Std. Error t value Pr(>|t|)
Intercept 1908.678 966.709 1.974 0.049
TotNum 73.736 93.757 0.786 0.432
EdYears 148.141 51.385 2.883 0.004
SepBed -7.414 115.619 -0.064 0.949
GFA 16.265 1.996 8.149 0.000
PlotArea 6.851 2.205 3.106 0.002
Frontage 35.739 43.503 0.822 0.412
TimeCity -41.486 12.196 -3.402 0.001
Ppsqm 19.600 1.840 10.650 0.000
DistCity -0.367 0.080 -4.619 0.000
3.2 Analysis: distance metric choice and collinearity
A sequence of 80 Minkowski power values were created from 0.05 to 4.00 in steps of 0.05,
with a rotation, θ, of 0¡. For each of these, Minkowski distance matrices were created using the
projected coordinates of the 558 data locations. Then, the optimal adaptive bandwidth was
determined for each GWR model calibrated using each of the 80 Minkowski distance matrices,
and a GWR model was constructed using that bandwidth and that Minkowski distance matrix.
This resulted in 80 GWR models. For each GWR model, the local CNs for each of the 558 data
[image:12.595.137.461.68.284.2]locations were determined and those with a CN < 30 were identified.
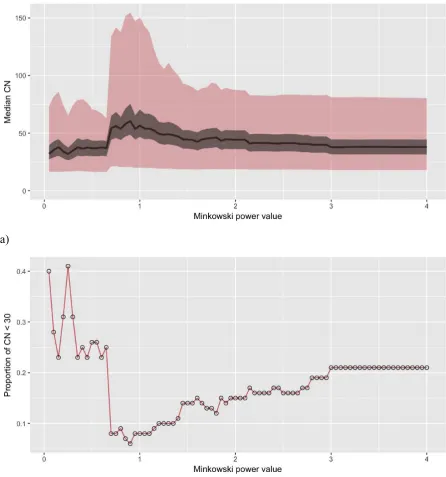
Figure 3a plots all the CN values arising from each of the 80 GWR calibrations using the 80
different Minkowski distances against the distribution of CNs for that distance. Highlighted
are the median CNs. In Figure 3b, the proportion of the local CNs < 30 are plotted. Here is it
evident that local collinearity is a problem for a GWR fit to the case study data, but that the
nature of the problem is dependent on distance metric choice. Figure 3 shows that, the
proportion of local regression design matrices exhibiting local collinearity is lower for GWR
fits with Minkowski distances with values of p ranging fromapproximately 0.05 to 0.75. It is
relatively high for GWR fits with Minkowski distances with values of p ranging from
12
a)
[image:13.595.72.519.73.551.2]b)
Figure 3. The change in local CN values with changes in Minkowski distance power values, a)
showing the median CN, with the CN range (red / light shade) and the CN inter-quartile range
(grey / dark shade), and b) the proportion of the local regressions where CN < 30, i.e. the
proportion of each GWR fit not exhibiting local collinearity.
One of the important advantages of Minkowski distances is their ability to handle anisotropy
in distances or direction-dependent variations in distance, through the rotation parameter θ.
This is an important consideration in the context of GWR. Undertaking GWR in the normal
13
or process under investigation decays with distance evenly regardless of direction, noting that
network distances present a different case. As such, each local regression of GWR is
constructed at a location and nearby observations at any given distance are weighted equally
regardless of direction. This may be an unreasonable assumption where space is not isotropic
and the direction in which distance is measured is important. For example, P‡ez(2004) reported
that GWR models calibrated with anisotropic kernels outperformed those calibrated with
standard isotropic distances. However, identifying the optimal anisotropic distance metric for
any particular spatial process can be difficult because of the diversity within the data and the
nature of the geography of the locations being considered (Lu et al. 2016). Thus the range of
potentially useful distance metrics for spatial analyses is greater than a simple Euclidean or
network distance.
Considering the case study, it is evident that a high degree of anisotropy might be expected as
the study area contains a number of large water bodies (Figure 1). Euclidean or even network
distances, commonly used in spatial analyses, may not adequately describe the directionality
of the distance decay of house price. Houses immediately facing the river might be expected
to have high price and those in a nearby street not facing the river, to have lower values.
Similarly, houses on both sides of the river may be at a long road network distance from each
other and yet be more similar in value than with houses a short distance away, but not on the
river front.
Thus the next stage of the analysis was to evaluate the impact of varying the Minkowski
distance rotation angle from 10¡ to 90¡ in steps of 10¡, as well as varying with the power values
as before. Note that the 0¡ case is presented in Figure 3. Figures 4 and 5 summarise the local
CNs arising from each combination of Minkowski power and rotation. These results are
presented in the same format as that used in Figure 3.
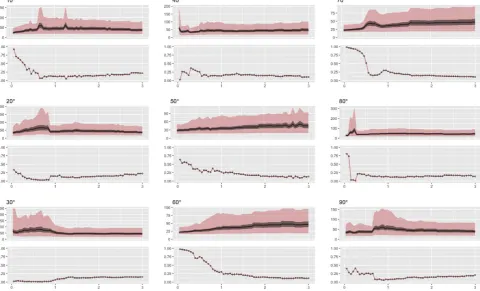
The results summarised by rotation angle are shown in Figure 4. These indicate that for this
dataset and this set of GWR models, instances of local collinearity are highest with a rotation
around 30¡, regardless of the distance metric: compare for instance with Manhattan (p = 1),
Euclidean (p = 2) and Minkowski (p = 3). However, each specific Minkowski power value has
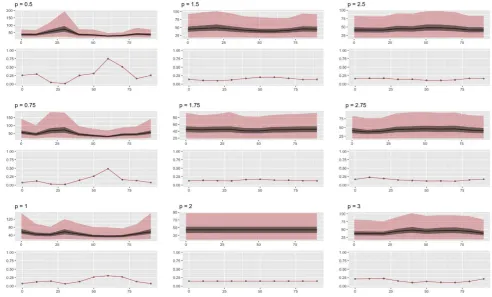
a particular minimum (or sometimes minimums), as shown in Figure 5. There are some general
14
exhibiting collinearity are similar for Minkowski powers between 1.5 and 2.5 Ð i.e.
approximating to Euclidean distance; rotations of around 30¡ have the highest instances of
collinearity for Minkowski powers 0.25 to 1.00. Also of note is a peak in instances of local
[image:15.595.59.540.183.474.2] [image:15.595.58.544.610.703.2]collinearity for a rotation angle of around 80¡, with p = 0.25.
Figure 4. The changes in local CN with Minkowski power values for rotations from 10¡ to 90
degrees. The x-axes indicate the Minkowski power (from 0 to 3). The upper panels show the
distributions of local CN values (where the median, range and IQR are highlighted) and the
lower panels indicate the proportion of local regressions for each GWR fit with local CN < 30
15
Figure 5. The changes in local CN with Minkowski rotation for power values from 0.25 to 3.0.
The x-axes indicate the Minkowski rotation (from 0¡ to 90¡). The upper panels show the
distributions of local CN values (where the median, range and IQR are highlighted) and the
lower panels indicate the proportion of local regressions for each GWR fit with local CN < 30
(i.e. not exhibiting local collinearity).
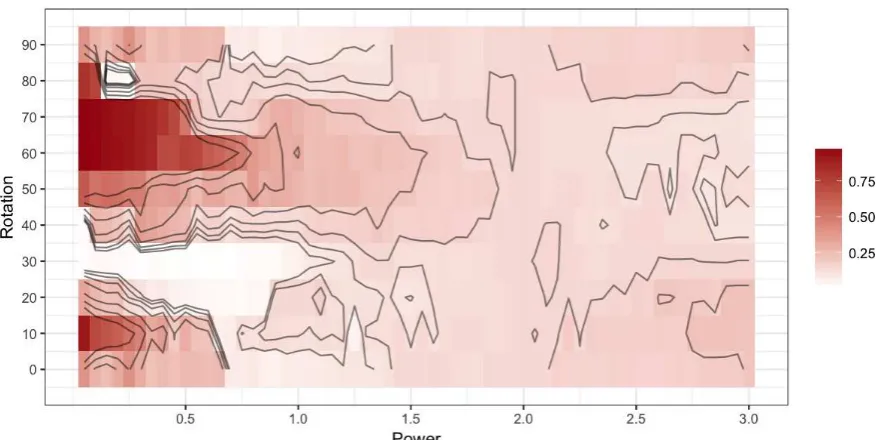
Figure 6 maps the surface of the proportions of local regressions of each GWR model with
local CN < 30 (i.e. not exhibiting local collinearity), given by rotation angle values against Minkowski power values. GWR fits with the highest instances of local regression collinearity
are found for Minkowski distances with rotations of 30¡ for values of p ranging from 0 to 0.95
and, as noted before, for a rotation of 80¡ and p values from 0.15 to 0.25 (the regions shaded
ÔwhiteÕ in Figure 6). The combination of Minkowski power and rotation values that resulted in
the lowest proportion (0.9%) of local CN < 30 (i.e. a GWR fit most likely to suffer from local
collinearity), was for p = 0.70, rotation angle, θ = 30¡ (0.523 radians), and with an adaptive
bandwidth of the nearest 32 data points (5.7%). Conversely, a GWR fit least likely to suffer
from local collinearity), with 98.2% of the local regression models with a CN < 30 , was for p
= 0.05, rotation angle, θ = 70¡ (1.222 radians), and with an adaptive bandwidth of the nearest
16
[image:17.595.76.517.93.313.2]
Figure 6. Surface of the proportion of local regressions of GWR fits that have local CN < 30
(i.e. not exhibiting local collinearity) for different combinations of Minkowski power and rotation values.
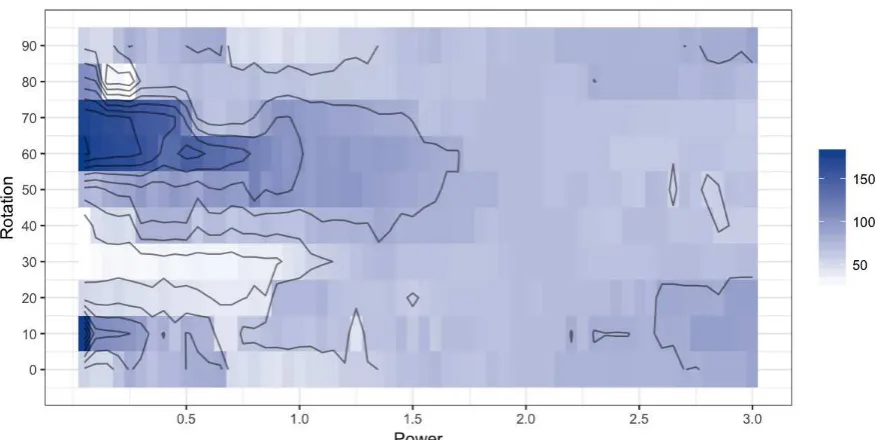
Next, as with any GWR model, the size of the bandwidth is of interest because it provides
information about the expected strength of how relationships between response and predictor
variables may vary across space, and in this case, with different distance metrics. Figure 7
describes a surface of the optimal adaptive bandwidths determined from different distance
metrics, with different rotations and power values. The relationship between Rotation, Power
and the bandwidth is very similar to that between Rotation, Power and the proportion of local
models found to exhibit collinearity (Figure 6), but with some local differences as indicated in
Figure 8. This plots the bandwidth against proportion of local regression models with CN < 30,
for all 600 combinations of power and rotation values. There is a broadly linear relationship
between bandwidth and the proportion of local models with CN < 30 Ð which is entirely
expected as local collinearity is expected to increase as the bandwidth decreases. There is also
a trend and some interaction with Power and Rotation but further investigation would be
17
Figure 7. The surface of kernel bandwidths (given as number of nearest neighbours) for
[image:18.595.76.515.72.292.2]different combination of Minkowski power values and rotations.
Figure 8. A plot of kernel bandwidth (given as %age) and the proportion of CNs < 30 (i.e. not
[image:18.595.77.511.367.646.2]18
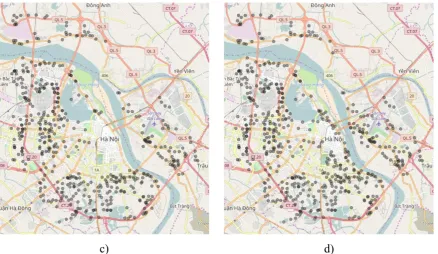
Finally, it is important to provide a series of maps of local CN > 30, for different GWR fits
(Figure 9). Here four GWR fits were chosen by varying the power and rotation of the
Minkowski distance, ranging from a GWR fit least affected by local collinearity, to a GWR fit
most affected by local collinearity. These GWR models can be summarised as follows:
-! Minkowski p = 0.05, Minkowski rotation angle θ = 70¡, a resultant optimal adaptive
bandwidth of 31.5% and local collinearity found in 1.8% of the local regressions;
-! p = 0.10, θ = 80¡, bandwidth = 18.1%, 26.3% collinearity;
-! p = 1.75, θ = 30¡, bandwidth = 11.8%, 87.5% collinearity;
-! p = 0.7, θ = 30¡, bandwidth = 5.7%, 99.1% collinearity.
19
[image:20.595.80.519.70.324.2]c) d)
Figure 9. A comparison of four different combinations of Minkowski power and rotation values
depicting where the resultant GWR fits exhibit local collinearity (i.e. only plot where the local CN > 30) in: a) 1.8% (the minimum), b) 26.3%, c) 87.5%, and d) 99.1% (the maximum) of the
local regression models for each of the four GWR fits.
4. Discussion and concluding remarks
This paper investigates the impacts of different distance metrics on collinearity in the resultant
GWR models. The case study in Hˆ Nội, Vietnam has large water bodies throughout the city
centre in the form of lakes and the Red River, suggesting distance metric choice to be an
important consideration. In this context network distances, may be appropriate Ð they might
capture the structure of water bodies in the study area Ð but equally may not adequately describe
the distance decay of house prices, as properties immediately on opposite sides of the river may
be far away by network distance from each other and yet be more similar in value than with
houses a short distance away, but not on the river front. However, the aim of the paper was to
not to explore the local collinearity associated with network distances, but the degree to which
different Minkowski distances can possibly capture some aspects of spatial structure. Here, the
Minkowski distance found to maximise local collinearity in the GWR fit was approximate to a
Manhattan distance (p = 0.7) but also included a rotation of 30¡. The Minkowski distance found
to minimise local collinearity in the GWR fit was parametrised with p = 0.05 and a rotation of
20
Collinearity in regression models can result in loss of precision and power in the coefficient
estimates. Regression analyses operate under the assumption of independence in predictor
variables. If these are correlated, then the regression model can be sensitive to random errors
in the response variable which can result in a large variance thereby reducing model inferential
power. Collinearity can be a particular problem in local approaches such as GWR, because the
predictor variables in the data subsets may exhibit collinearity locally even when none is
observed globally (Wheeler and Tiefelsdorf, 2005). A number of approaches have been
suggested for handling this in GWR (Wheeler 2007, 2009; Brunsdon et al 2012) transferring
concepts in regression modelling more generally (Hoerl 1962, Hoerl and Kennard 1970;
Tibshirani 1996; Zou and Hastie 2005). These solutions have typically taken one of two routes:
altering the estimator to include a small change to the values of the diagonal of the
cross-product matrix, referred to as the ridge (Hoerl 1962; Hoerl and Kennard 1970), in order to
increase the difference between the diagonal and off-diagonal elements of the matrix, and in
so doing reducing the collinearity among the predictors. Or to use a shrinkage estimator to
generate coefficient estimates that are biased to be small in order to constrain them, with the
so called lasso (Tibshirani, 1996). Elastic nets (Zou and Hastie, 2005) have also been proposed
and are a hybrid of ridge regression and lasso regularization.
The results of this studyÕs analysis suggest a further consideration for reducing local
collinearity in GWR, one that incorporates some form of distance attenuation to weight data
locally, providing a complementary perspective to the importance of bandwidth selection in
GWR analyses. Bandwidth choice is always emphasised as being the critical factor in correctly
parameterising a GWR model (e.g. Lu et al., 2014b; Gollini et al., 2015). It is also well-known,
that bandwidth selection will directly affect collinearity, with small bandwidths more likely to
result in local collinearity problems, than found with large bandwidths (Brunsdon et al. 2012).
The study presented here indicates that the choice of distance metric may be just as important,
as it can negatively and positively affect the collinearity within local data subsets. The most
effective distance metric, of course will relate to the characteristics of the case study data, both
in terms of the Minkowski power and the rotation. The methods described in this paper allow
both power and rotation angle to vary fully and can be used to determine how to best
21
Although this research highlights an important specification issue in GWR, worthy of
reporting, there exists practical caveats that should be adhered to. There are critical tensions in
the context of distance metric choice and addressing collinearity in GWR. Firstly, the distance
metric is problem-dependent. This suggests that distance metrics should be carefully chosen to reflect knowledge of the spatial processes being investigated, to reflect notions of ÒclosenessÓ,
that relate, for example, to the local pattern of house price variations and predictors, such that
similar patterns are closer using that distance metric than dissimilar patterns. Thus, in this case
study, p = 1 (close to the network distance) could be preferred to p = 2 (Euclidean distance),
as it reduces local collinearity, whilst at the same time is not a distance metric that has a rather
abstract meaning (e.g. p = 0.05, which minimised collinearity). Secondly, collinearity is
sample-dependent, which for GWR, is also dependent on the bandwidth. Collinearity should
still primarily be dealt with using standard procedures (e.g. ridge, lasso). However, as
demonstrated, distance metric choice can influence collinearity, but its reduction via distance
metrics should not be at the expense of changing the purpose and logic of the GWR model. In
the extreme, a distance metric could be chosen such that all sample points are the same distance
apart and collinearity minimised, but and this would simply fall back to the global OLS
regression fit, so care must be exercised.
In summary, GWR is an inherently exploratory approach and understanding how the distance
metric and the kernel bandwidth interact with collinearity has the capacity to provide further
insight into the nature and structure of the data relationships being examined. This paper
provides evidence that distance metric choice can provide a useful extra tuning component to
address local collinearity, not only for basic GWR (as demonstrated), but also for adapted
GWR models. Adaptations not only include those already addressing collinearity, such as the
ridge or lasso, but also others such as robust (for outliers) and heteroskedastic (for error
variance) forms (Fotheringham et al. 2002) Ð GWR models that may not be so easily adapted
to ridge or lasso forms. Brunsdon et al. (2012) have already observed that bandwidth size and
collinearity strongly interact, and allowed GWR bandwidths to be locally-specified so that local
collinearity is reduced (i.e. specify bandwidths such that all local CNs < 30). This study has
now highlighted a further important interaction with respect to distance metric choice.
Acknowledgements
This work arose from a Newton Mobility Fund awarded to the National University of Civil
22
on the status-quality trade off theoryÕ, award no. NG150097. This research was also supported by the Natural Environment Research Council Newton Fund grant (NE/N007433/1) and a UK
Biotechnology and Biological Sciences Research Council grant (BB/J004308/1). All of the
analyses and mapping were undertaken in R 3.3.2 the open source statistical software. The
GWR analyses used the GWmodel package, v2.0-1 (Gollini et al, 2015) and the data and code
used to develop this analysis are available at https://github.com/lexcomber/GW-dists.
References
AKAIKE, H., Information Theory and an Extension of the Maximum Likelihood Principle. ed.
2 nd International Symposium on Information Theory, 2Ð8 September 1973 Tsahkadsor. Armenian SSR, 267-281.
ASSUN‚ÌO R.M. (2003) Space varying coefficient models for small area data.
Environmetrics 14, 453-473.
BARCENA, M. J., et al. 2014. Alleviating the effect of collinearity in geographically weighted
regression. Journal of Geographical Systems, 16(4), 441-466.
BELSLEY, D., KUH, E. and WELSCH, R., 1980. Regression diagnostics: Identifying
inuential data and sources of collinearity. John Wiley & Sons, Inc.
BOWMAN, A. W. 1984. An Alternative Method of Cross-Validation for the Smoothing of
Density Estimates. Biometrika, 71(2), 353-360.
BRUNSDON, C., CHARLTON, M. and HARRIS, P., 2012. Living with collinearity in Local
Regression Models. Spatial Accuracy 2012. Brazil.
BRUNSDON, C., FOTHERINGHAM, A. S. and CHARLTON, M. 1999. Some Notes on
Parametric Significance Tests for Geographically Weighted Regression. Journal of
Regional Science, 39(3), 497-524.
BRUNSDON, C., FOTHERINGHAM, A. S. and CHARLTON, M. E. 1996. Geographically
Weighted Regression: A Method for Exploring Spatial Nonstationarity. Geographical
Analysis, 28(4), 281-298.
CASETTI, E. 1972. Generating Models by the Expansion Method: Applications to
Geographical Research. Geographical Analysis, 4(1), 81-91.
CHARLTON, M., FOTHERINGHAM, A. and BRUNSDON, C., 2003. GWR 3: software for
23
CLEVELAND, W. S. 1979. Robust Locally Weighted Regression and Smoothing Scatterplots.
Journal of the American Statistical Association, 74(368), 829-836.
DORMANN, C. F., et al. 2013. Collinearity: a review of methods to deal with it and a
simulation study evaluating their performance. Ecography, 36(1), 27-46.
ESRI, 2009. ArcGIS 9.3: Interpreting GWR results [online].
http://webhelp.esri.com/arcgisdesktop/9.3/index.cfm?TopicName=Interpreting_GWR
_results.
FARBER, S. and PçEZ, A., 2007. A systematic investigation of cross-validation in GWR
model estimation: empirical analysis and Monte Carlo simulations. Journal of
Geographical Systems, 9(4), pp.371-396.
FINLEY, A.O. (2011) Comparing Spatially-Varying Coefficient Models for Analysis of
Ecological Data with Non-Stationary and Anisotropic Residual Dependence. Ecology and
Evolution, 2, 143Ð154.
FOTHERINGHAM, A. S. and BRUNSDON, C. 1999. Local Forms of Spatial Analysis.
Geographical Analysis, 31(4), 340-358.
FOTHERINGHAM, A. S., BRUNSDON, C. and CHARLTON, M., 2002. Geographically
Weighted Regression: the analysis of spatially varying relationships. Chichester: Wiley.
FOTHERINGHAM, A. S., CRESPO, R. and YAO, J. 2015. Geographical and Temporal
Weighted Regression (GTWR). Geographical Analysis, 47(4), 431-452.
FOTHERINGHAM, A.S., YANG, W., & KANG, W. 2017. Multiscale Geographically
Weighted Regression (MGWR). Annals of the American Association of Geographers
107(6), 1247-1265.
GELFAND, A.E., KIM, H-J., SIRMANS C.F. & BANERJEE, S. (2003) Spatial Modeling
with Spatially Varying Coefficient Processes. Journal of the American Statistical
Association, 98, 387-396.
GOLLINI, I., et al. 2015. GWmodel: an R Package for Exploring Spatial Heterogeneity using
Geographically Weighted Models. Journal of Statistical Software, 63(17), 1-50.
GOODCHILD, M. F. 2004. The Validity and Usefulness of Laws in Geographic Information
Science and Geography. Annals of the Association of American Geographers, 94(2),
300-303.
GORR, W. L. and OLLIGSCHLAEGER, A. M. 1994. Weighted Spatial Adaptive Filtering:
Monte Carlo Studies and Application to Illicit Drug Market Modeling. Geographical
24
GRIFFITH, D. A. 2008. Spatial-Filtering-Based Contributions to a Critique of Geographically
Weighted Regression (GWR). Environment and Planning A, 40(11), 2751-2769.
HARRIS P, BRUNSDON C, FOTHERINGHAM AS (2011a) Links, comparisons and
extensions of the geographically weighted regression model when used as a spatial
predictor. Stochastic Environmental Research and Risk Assessment 25:123-138
HARRIS P, FOTHERINGHAM AS, JUGGINS S (2010) Robust geographically weighed
regression: a technique for quantifying spatial relationships between freshwater
acidification critical loads and catchment attributes. Annals of the Association of American Geographers 100(2): 286-306
HARRIS, P., BRUNSDON, C. and CHARLTON, M. 2011b. Geographically weighted
principal components analysis. International Journal of Geographical Information
Science, 25(10), 1717-1736.
HOERL, A. E. 1962. Application of Ridge Analysis to Regression Problems. Chemical
Engineering Progress, 58(3), 54-59.
HOERL, A. E. and KENNARD, R. W. 1970. Ridge Regression: Biased Estimation for
Nonorthogonal Problems. Technometrics, 12(1), 55-67.
LU, B., et al. 2014a. Geographically weighted regression with a non-Euclidean distance metric:
a case study using hedonic house price data. International Journal of Geographical Information Science, 28(4), 660-681.
LU, B., et al. 2014b. The GWmodel R package: further topics for exploring spatial
heterogeneity using geographically weighted models. Geo-Spatial Information Science,
17(2), 85-101.
LU, B., et al. 2015. Calibrating a Geographically Weighted Regression Model with
Parameter-specific Distance Metrics. Procedia Environmental Sciences, 26, 109-114.
LU, B., et al. 2016. The Minkowski approach for choosing the distance metric in
Geographically Weighted Regression. International Journal of Geographical
Information Science, 30(2), 351-368.
LU, B., et al. 2017a. Geographically weighted regression with parameter-specific distance
metrics. International Journal of Geographical Information Science, 31(5), 982-998.
LU, B, HARRIS, P, CHARLTON M, BRUNSDON C , NAKAYA T, GOLLINI I (2017b).
GWmodel, v.2.0-4. Geographically-Weighted Models.
https://cran.r-project.org/web/packages/GWmodel/index.html
MELOUN, M., et al. 2002. Crucial problems in regression modelling and their solutions.
25
MURAKAMI, D., YOSHIDA, T., SEYA, H., GRIFFITH, D.A., & YAMAGATA, Y. (2017)
A Moran coefficient-based mixed effects approach to investigate spatially varying
relationships. Spatial Statistics, 19, 68-89.
NAKAYA, T., FOTHERINGHAM, A.S., CHARLTON, M. and BRUNSDON, C., 2009.
Semiparametric geographically weighted generalised linear modelling in GWR 4.0, available
from http://eprints.maynoothuniversity.ie/4846/1/MC_Semiparametric.pdf
OPENSHAW, S., 1996. Developing GIS-relevant zone-based spatial analysis methods. In:
LONGLEY, P. and BATTY, M. eds. Spatial analysis: modelling in a GIS environment.
New York: John Wiley and Sons, 55-73.
PçEZ, A. 2004. Anisotropic Variance Functions in Geographically Weighted Regression
Models. Geographical Analysis, 36(4), 299-314.
PçEZ, A., UCHIDA, T. and MIYAMOTO, K., 2002. A general framework for estimation and
inference of geographically weighted regression models: 1. Location-specific kernel
bandwidths and a test for locational heterogeneity. Environment and Planning A, 34(4), pp.733-754.
PçEZ, A., UCHIDA, T. and MIYAMOTO, K., 2002. A general framework for estimation and
inference of geographically weighted regression models: 2. Spatial association and
model specification tests. Environment and Planning A, 34(5), pp.883-904.
TIBSHIRANI, R. 1996. Regression Shrinkage and Selection via the Lasso. Journal of the
Royal Statistical Society. Series B (Methodological), 58(1), 267-288.
TOBLER, W. R. 1970. A Computer Movie Simulating Urban Growth in the Detroit Region.
Economic Geography, 46(2), 234-240.
WHEELER, D. and TIEFELSDORF, M. 2005. Multicollinearity and correlation among local
regression coefficients in geographically weighted regression. Journal of Geographical
Systems, 7(2), 161-187.
WHEELER, D. C. 2007. Diagnostic tools and a remedial method for collinearity in
geographically weighted regression. Environment and Planning A, 39(10), 2464-2481.
WHEELER, D. C. 2009. Simultaneous coefficient penalization and model selection in
geographically weighted regression: the geographically weighted lasso. Environment
and Planning A, 41(3), 722-742.
WHEELER, D. C., 2010. Visualizing and Diagnosing Coefficients from Geographically
Weighted Regression Models. In: JIANG, B. and YAO, X. eds. Geospatial Analysis
26
YONEOKA, D., SAITO, E. and NAKAOKA, S., 2016. New algorithm for constructing
area-based index with geographical heterogeneities and variable selection: An application to
gastric cancer screening. Scientific reports 6, availabel from
https://www.ncbi.nlm.nih.gov/pmc/articles/PMC4877577/
ZOU, H. and HASTIE, T. 2005. Regularization and variable selection via the elastic net.