Int. J. Electrochem. Sci., 6 (2011) 492 - 505
International Journal of
ELECTROCHEMICAL
SCIENCE
www.electrochemsci.org
Effect of the Operation and Humidification Temperatures on
the Performance of a Pem Fuel Cell Stack on Dead-End Mode.
M. Pérez-Page, V. Pérez-Herranz*
Ingeniería Electroquímica y Corrosión (IEC)
Depto. Ingeniería Química y Nuclear. Universidad Politécnica de Valencia. Camino de Vera S/N. 46022, Valencia, Spain.
*
E-mail: [email protected]
Received: 29 October 2010 / Accepted: 14 January 2011 / Published: 1 February 2011
Proton exchange membrane (PEM) fuel cells have attracted grate attention in recent years as a promising replacement for traditional engines. The performance of PEM fuel cells is known to be influenced by many parameters such as operation temperature and humidification of the gas streams. In this work, a testbench was developed to monitor and control a 300W fuel cell stack. Series of polarization curves with different fuel cell operation temperatures and humidification temperatures have been studied. From the polarization curves the values of kinetic parameters such as the Tafel slope and the cell resistance have been calculated with the fit of the experimental data to an empirical model. The effect of the fuel cell and humidification temperatures on the kinetic parameters has been studied.
Keywords: PEM, Fuel cell stack, humidity and temperature, empirical modeling, monitoring voltage of individual cell.
1. INTRODUCTION
several remote and mobile applications where they provide quiet operation, high reliability, potentially high energy density and ultra-low emissions. In recent years, research and development in fuel cells and fuel cell systems have accelerated, and although significant improvements in polymer electrolyte membrane fuel cell technology has been achieved over the past decade, the performance, stability, and reliability for today’s fuel cell technology is not sufficient to replace internal combustion engines. On the other hand, the cost of fuel cell systems is still too high for them to become viable commercial products. A number of fundamental problems must be overcome to improve their performance and reduce their cost [1-14].
In a PEM fuel cell stack, the cells are electrically connected in series and the polarization curves of the individual cells can be measured by measuring the current of the entire stack and the voltages of individual cells. For a given set of operating parameters such as system pressure, temperature, humidification, and gas stoichiometry, the fuel cell voltage is essentially determined by the applied current [11-16].
The polarization behavior of a fuel cell exhibit similar voltage/current relationships and it’s the result of three types of phenomena: electrode kinetics, ohmic losses, and transport limitations. The activation polarization loss is dominant at low current densities and is present when the rate of the electrochemical reaction at the electrode surface is controlled by sluggish electrode kinetics. The processes involving adsorption of reactant species, transfer of electrons across the double layer, desorption of product species, the number and distribution of active sites, and the nature of the electrode surface can all contribute to activation polarization. Ohmic losses vary directly with current, increasing over the entire range of current density. These are due to the resistance to the flow of protons in the electrolyte membrane and resistance to flow of electrons through the stack materials, electrode materials, electrode backing, interconnects current collector plates and constant resistance between various interfaces. The ohmic losses can be reduced by using thinner electrolyte membranes with proper humidification, better conductivity cell stack materials, design of the flow field and current collection plates and by reducing contact resistances at various interfaces. The concentration polarization losses occur due to the mass transport limitation to reactants/products to or from the electroactive sites. These voltage losses occur over the entire range of current density, but become prominent especially at high currents, when it is difficult to provide enough reactant flow to the reaction sites. The mass transport voltage losses can be reduced by making the gas distribution over the electrode surfaces more uniform, higher porosity of the backing layer without losing conductivity, or a right combination of the hydrophobic and hydrophilic properties of materials used to construct electrode layer for efficient water removal [3, 11-21].
cases. Polymer membrane materials used in PEM fuel cells must be hydrated in order to maintain high proton conductivity, and at the same time excess water must be removed to prevent flooding. Membrane hydration is affected by the water transport phenomena in the membrane itself, which in turn is affected by the condition of the inlet gases and the operating parameters of the fuel cell. Therefore, it is very important to maintain an optimal water balance during the operation of PEM fuel cells [20, 24-27].
In this work, the effect of the operation and humidification temperatures on the performance of a 300 W fuel cell stack is studied. Polarization curves at different fuel cell temperatures and at different humidification temperatures have been obtained. From the polarization curves the values of kinetic parameters such as the Tafel slope and the cell resistance have been calculated with the fit of the experimental data to an empirical model, and the effect of the fuel cell operation and humidification temperatures on the kinetic parameters have been studied. The fuel cell stack has been operated in dead-end mode. In dead-end mode, the hydrogen outlet is blocked and thus the anode is pressurized. Complete blocking of the hydrogen outlet may cause serious flooding problems in long term operation due to water accumulation in the anode compartment. Dead-end operation also affects the water balance of the cathode due to decreased total water removal from the cell. Therefore, the anode outlet should be equipped with a purge valve to remove excess water [28].
On the other hand, the voltages of the individual cells have been monitored in order to detect possible voltage drops, as if only the stack voltage is monitored, the breakdown of a single cell in a large stack is difficult to detect [11, 29-30].
2. EXPERIMENTAL SET UP
Figure 1 shows a scheme of the experimental arrangement. It consists of a 300 W fuel cell stack with 20 individual cells. Under optimal conditions with regard to pressure, humidity, reactants flow, and temperature, the electrical output capability of the stack is 300 W. The supply of air to the cathode is handled by a compressor and the hydrogen is stored in a high-pressure tank at up to 200 bar. Using reduction valves, mass flow controllers, and an external humidifier, hydrogen and air are fed to the fuel cell stack. Purge valves were used to assist the removal of water droplets in the flow channels. The liquid cooling loop consists of a continuous-controlled pump and a heat exchanger. The temperatures are measured by thermocouples. All experiments were carried out under galvanostatic conditions using a 500 W H&H electronic load.
Figure 1. Diagram of the experimental arrangement, consisting of a fuel cell stack, air supply, hydrogen supply, cooling system, humidifier system and data acquisition system. (1) reduction valves, (2) mass flow controllers, (3) purge valves.
In this work, the fuel cell stack performance was evaluated at different fuel cell operation temperatures from 20 to 80ºC, and humidification temperatures from 40 to 70ºC. Hydrogen was supplied to the fuel cell stack in the dead-end mode, at the exact rate at which is being consumed. In this mode of operation the measurements the hydrogen flow rate was only measured but not controlled, while air was supplied with a stoichiometric ratio of 5. The operation pressure was 1 bar.
3. RESULTS AND DISCUSSION
3.1. Effect of the operation temperature on the fuel cell stack performance in absence of humidification.
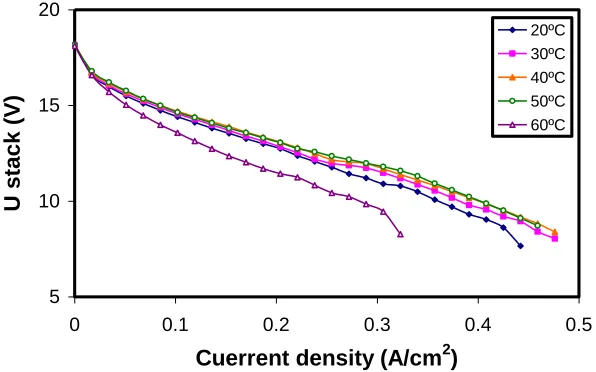
The fuel cell stack performance was first evaluated from the polarization curves at operation temperatures from 20 to 60ºC in absence of humidification. Figure 2 shows the polarization curves of the fuel cell stack at these temperatures. The polarization curves indicate that the fuel cell stack performance was improved with increasing temperature from 20 to 40ºC, it remains almost constant between 40 and 50ºC, and finally decreases for temperatures above 50ºC.
[image:4.596.172.481.114.293.2]
temperature; therefore, the fuel cell stack performance is improved at higher temperatures. Therefore, the kinetics reaction is improved by the high temperatures [31].
5 10 15 20
0 0.1 0.2 0.3 0.4 0.5
Cuerrent density (A/cm2)
U
stack (V)
[image:5.596.149.447.138.324.2]20ºC 30ºC 40ºC 50ºC 60ºC
Figure 2. Effect of the operation temperature on the polarization curves in absence of humidification.
However, if the operation temperature is high enough, the membrane conductivity decreases because of the reduction in the relative humidity of the reactant gases and the water content in the membrane. Therefore, the fuel cell performance was worse when the fuel cell stack temperature was increased to 60ºC. As the temperature increases, there will be a greater rate of water evaporation. When the temperature reaches a critical temperature where the amount of evaporated water exceeds the amount of produced water, the membrane will start to dry out [13, 25-27]. The increase of the resistance when the membranes dry out causes the decrease in the fuel cell stack voltage observed in Figure 2 at the higher operation temperature of 60ºC [32].
3.2. Effect of the humidification temperature on the fuel cell stack performance.
In this work, the simultaneous effect of the operation and humidification temperatures on the performance of the fuel cell stack has been studied. In this way, sets of experiments were carried out where the operation temperature of the fuel cell stack was varied from 20 to 80ºC, and the humidification temperature was varied from 40 to 70ºC. The polarization curves obtained for each set of experiments are shown in the following figures.
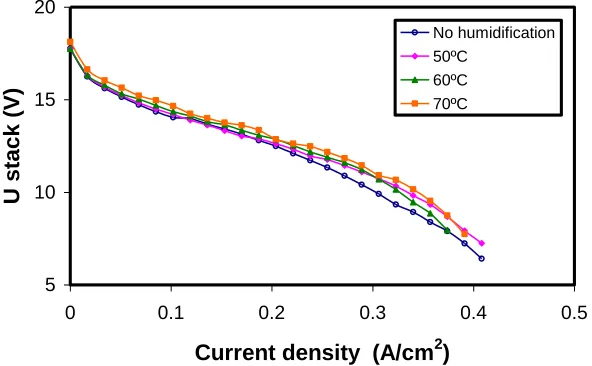
Figure 3 shows the polarization curves of the fuel cell stack for an operation temperature of 40ºC and different humidification temperatures.
5 10 15 20
0 0.1 0.2 0.3 0.4 0.5
Current density (A/cm2)
U
stack (V)
No humidification 50ºC
60ºC 70ºC
Figure 3. Effect of the humidification temperature on the polarization curves for an operation temperature of 40ºC.
Figure 4 shows that at an operation temperature of 60ºC the performance of the fuel cell stack improves with the increase of the humidification temperature, especially at high currents, due to the improvement of mass transport as a consequence of the increase of the gas diffusivity.
5 10 15 20
0 0.1 0.2 0.3 0.4 0.5
Current density (A/cm2)
U s
tac
k
(V)
No humidification 50ºC
60ºC 70ºC
Figure 4. Effect of the humidification temperature on the polarization curves for an operation temperature of 60ºC.
[image:6.596.152.448.85.268.2] [image:6.596.153.444.431.615.2]
the proton conductivity. The limiting current also increases with the increase of humidification temperature, due to the improvement of mass transport.
5 10 15 20
0 0.1 0.2 0.3 0.4 0.5
Current density (A/cm2)
U s
tac
k
(V)
40ºC 50ºC 60ºC 70ºC
Figure 5 Effect of the humidification temperature on the polarization curves for an operation temperature of 70ºC.
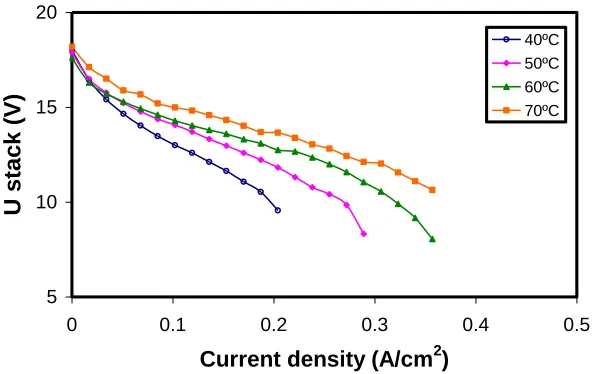
The effect of the operation temperature on the performance of the fuel cell stack is shown in Figures 6 and 7 for two humidification temperatures of 40 and 70ºC respectively. As can be seen in Figure 6, for a humidification temperature of 40ºC and different operation temperatures from 50ºC to 70ºC, the performance of fuel cell stack decrease when the operation temperature increase. At this low humidification temperature, an increase of the operation temperature, causes the membrane to dry, the membrane conductivity decreases and the fuel cell stack performance decreases.
[image:7.596.151.447.137.324.2]5 10 15 20
0 0.1 0.2 0.3 0.4 0.5
Current density (A/cm2)
U stack (V)
50ºC 60ºC 70ºC
Figure 6. Effect of the operation temperature on the polarization curves for a humidification temperature of 40ºC.
5 10 15 20
0 0.1 0.2 0.3 0.4 0.5
Current density (A/cm2)
U
stack (V)
30ºC 50ºC 70ºC 80ºC
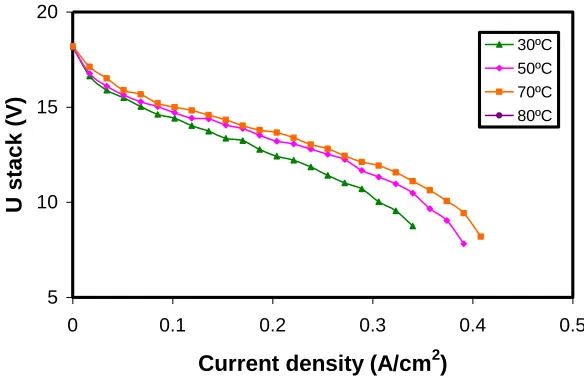
Figure 7. Effect of the operation temperature on the polarization curves for a humidification temperature of 70ºC.
3.3. Monitoring the individual cell voltages.
Since all cells in a stack are electrically connected in series, the reliability of a stack depends on a satisfactory operation of all individual cells. Monitoring of only the stack voltage makes it difficult to distinguish the accumulation of slight deteriorations in all cells from the breackdown of a single cell. A single cell might have failed due to the blocking of channels or reaction sites by excess of water, due to overheating by temporarily insufficient cooling or due to mechanical failure of the membrane.
[image:8.596.151.443.82.270.2] [image:8.596.151.443.353.542.2]
the dehydration of the membrane and a decrease of the conductivity. If the humidification temperature is increased to 70ºC, an increase of the individual cell voltages can be observed, and a more uniform distribution of the individual cell voltages is achieved due to the increase of the membrane conductivity with the humidification temperature.
0 0.1 0.2 0.3 0.4 0.5 0.6 0.7 0.8 0.9 1
1 3 5 7 9 11 13 15 17 19
Cell Number
U
cel
l
(V)
[image:9.596.172.432.159.315.2]40ºC 70ºC
Figure 8. Individual cell voltages at two different humidification temperatures of 40ºC and 70ºC and at fuel cell stack operation temperature of 70ºC.
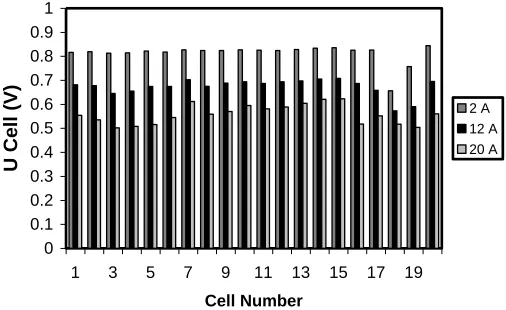
Figure 9 shows the individual cell voltages at three polarization levels of the fuel cell stack for humidification and operation temperatures of 70ºC. When the stack is working at 2 A, the distribution of the individual cell voltages is practically uniform. At 12 A the distribution of the individual cell voltages is less uniform, the voltage of the firsts and lasts cells are lower than the voltage of the internal cells. At 20 A, the distribution of the individual cell voltages is similar than at 12 A, but the mean voltage is lower as the fuel cell stack is operating in the mass transfer control zone. For given operation and humidification temperatures, with the increase of current, the water production rate increases proportionally. The higher rates of water production can cause flooding in some cells and the uneven distribution of the individual cell voltages observed at high currents.
0 0.1 0.2 0.3 0.4 0.5 0.6 0.7 0.8 0.9 1
1 3 5 7 9 11 13 15 17 19
Cell Number
U
C
el
l
(V) 2 A
12 A 20 A
[image:9.596.175.428.565.720.2]conditions can be attributed to different phenomena occurring throughout the stack, such as dehydration of the membranes or flooding of the gas diffusion electrodes, depending on the operation and humidification temperatures, and on the applied current. These phenomena cause a slight deterioration in every cell. Therefore, the monitoring of only the stack voltage makes it difficult to distinguish the accumulation of slight deteriorations in all cells from the breakdown of a single cell.
3.3 Effect of the humidification and operation temperatures on the kinetic parameters of the fuel cell stack.
The kinetic parameters of the fuel cell stack can be obtained by the non-linear regression fit of the experimental data to the following empirical equation [33-36]:
n Im I R I
I b E
E log exp
0
0 [1]
Where E and I are the experimentally measured potential and current respectively, E0 is the open circuit potential, I0 is the exchange current, b is the Tafel slope for the oxygen reduction reaction, and R represents the resistance. The parameters m and n describe mass-transport limitations. The m value affects both the slope of the linear region of the polarization curve, and the current at which there is departure of this plot from linearity. The n value has a major effect on the dependence of polarization curve after the linear region, the rapid fall-off of potential with increasing of current, the major mass-transport limitation region. The value of n has only a small effect on the slope of the linear region; its dominant effect is in dramatically changing the slope of the polarization curve in the major mass-transport limitation region [34].
0.15 0.17 0.19 0.21 0.23 0.25
20 30 40 50 60 70 80
Operation Temperature (ºC)
b
(v/
d
ec)
50ºC 60ºC 70ºC
[image:10.596.157.439.527.706.2]
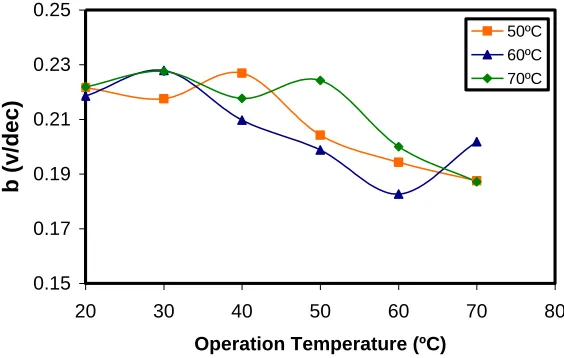
The Tafel slope, b, which represents the voltage losses due to activation polarization, calculated from the fitting of the experimental data to equation [1], is represented in Figure 10 as a function of the operation temperature and the humidification temperature.
As can be seen in Figure 10, for a given humidification temperature, the increase of the fuel cell temperature improves the electrochemical reaction, decreasing the necessary activation energy to improve the transference of electrons and decreasing the Tafel slope. The effect of the humidification temperature on the Tafel slope depends on the operation temperature. The lower values of the Tafel slope are obtained when the combination of the operation temperature and the humidification temperature produce the best conditions for the access of reactants to the electroactive sites.
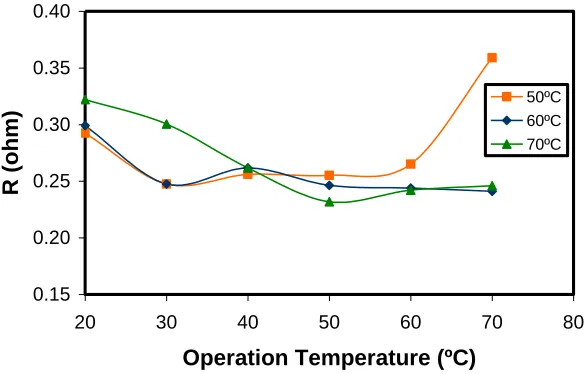
Figure 11 shows the effect of the operation and the humidification temperatures on the resistance calculated from the fitting of the experimental data to equation [1]. The resistance, R, represents three resistive factors of the fuel cell stack, the resistance for the transportation of electrons, the resistance of contact of the constituent members of the cell and the resistance transport of protons through the membrane. Resistance and conductivity of protons are related to the operation temperature and with the current. If the operation temperature is excessive and the humidity decrease, the resistance increases. Otherwise, when the current increase there is an increase of the water production and the water transfer by electro-osmosis from the anode to the cathode, therefore, the anode is dehydrated and the cathode is flooded.
0.15 0.20 0.25 0.30 0.35 0.40
20 30 40 50 60 70 80
Operation Temperature (ºC)
R
(o
h
m)
50ºC 60ºC 70ºC
Figure 11. Variation of resistance, R, with the operation temperature at different humidification temperatures.
[image:11.596.151.445.409.596.2]with the increase of the operation temperature is more pronounced. When the membrane is well humidified, the resistance decreases with the operation temperature due to the improvement of the gas diffusivity and membrane conductivity at higher temperatures.
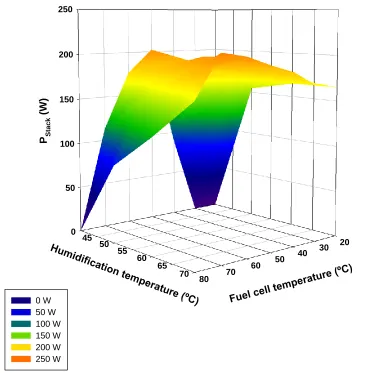
As it has been found previously, the operation temperature and the humidification temperature have a great influence on the performance of the fuel cell stack. In order to select the operation and humidification temperatures for the best performance of the fuel cell stack, in Figure 12 is represented the maximum power generated by the fuel cell stack as a function of the humidification and operation temperatures. In this figure can be observed that the highest power is achieved either at low humidification temperatures and intermediate operation temperatures or at high humidification temperatures and high operation temperatures, since in these conditions a good balance between the different factors affecting the performance of the fuel cell stack is reached. Maintaining an optimal water balance between the anode and the cathode cause a good hydration of the membrane material in the catalyst layer, and this causes the increase of the active surface area of the catalyst layers, and improves the reactant transport and the electrode reaction kinetics.
0 50 100 150 200 250
20 30 40 50 60 70 80 45
50 55
60 65
70
PS
ta
c
k
(W)
Fuel cell tempe
rature (ºC)
Humid ificati
on tempe rature
(ºC)
[image:12.596.114.480.355.728.2]0 W 50 W 100 W 150 W 200 W 250 W
4. CONCLUSIONS
In this work, the effect of the operation and humidification temperatures on the performance of a 300 W PEM fuel cell stack has been studied. In absence of humidification the polarization curves of the fuel cell stack showed that the fuel cell performance was improved with increase temperature from 20ºC to 40ºC. At higher temperatures, the performance of the fuel cell stack decreases as the membranes can be dried. This causes a decrease on the mean stack voltage and an uneven distribution of the individual cell voltages.
The effect of the humidification temperature on the fuel cell stack performance depends on the operation temperature. At the higher humidification temperatures, the membrane material in the catalysts layer is better hydrated, which causes the increase of the active surface area of the catalyst layers and leads to improvement of the fuel cell performance. But if the fuel cell temperature is very high, water is evaporated; the membrane start to dry, the conductivity decrease and the fuel cell performance is deteriorated. Therefore, when the operation temperature is high, higher humidification temperatures are required. On the contrary, for low operation temperatures, an excess of water due to high humidification temperatures causes flooding in some individual cells.
The effect of the operation and humidification temperatures on the Tafel slope and the resistance has been studied in this work. For a given humidification temperature the Tafel slope decreases with the operation temperature. The resistance was strongly influenced by water content of the reactants and by the operation temperature. When the membrane is well humidified, the resistance decreases with the operation temperature due to the improvement of the gas diffusivity and the membrane conductivity at higher temperatures.
References
1. Xiaochen Yu, Biao Zhou, Andrzej Sobiesiak. J. Power Sources, 147 (2005) 184. 2. Bauen, D. Hart, J. Power Sources, 86 (2000) 482.
3. Moisés Bautista Rodríguez, M.G. Araceli Rosas Paleta, J. Antonio Rivera Marquez, A. Belén Tapia Pachuca, J. Roberto García de la Vega. Int. J. Electrochem. Sci., 4 (2009) 1754.
4. Moisés Bautista Rodriguez, Araceli Rosas Paleta, J. Antonio Rivera Marquez, A. Belén Tapia Pachuca, J. Roberto García de la Vega. Int. J. Electrochem, Sci., 4 (2009) 1754.
5. Rongzhong Jiang, Deryn Chy. J. Power Sources, 92 (2001) 193.
6. Moisés Bautisata Rodriguez, Araceli Rosas Paleta, Andrés Rodríguez Castellanos, J. Antonio Rivera Márquez, Omar Solorza Feria, J. Antonio Guevara Garcia, J. Ignacio Castillo Velásquez. Int. J. Electrochem. Sci., 2 (2007) 820.
7. A.Bilodeau, K. Agbossou. J. Power Sources, 162 (2006) 757. 8. P. Costamagana, S. Srinivasan, J. Power Sources, 102 (2001) 242. 9. P.Costamagana, S. Srinivasan, J. Power Sources, 102 (2001) 253. 10.M. Ceraolo, C. Miulli, A. Pozio. J. Power Sources, 113 (2003) 131.
11.P. Rodatz, F. Büchi, C. Onder, L. Guzzela. J. Power Sources, 128 (2004) 208. 12.R. Buxbaum, H. Lei, J. Power Sources, 123 (2003) 43.
13.Q.Yan, H. Toghiani, H. Causey. J. Power sources, 161 (2006) 492.
(1991) 299.
16.T. Mennola, M. Mikkola, M. Noponen, T. Hottinen, T. Lund. J. Power Sources, 112 (2002) 261. 17.F. Barbir, PEM Fuel Cells, (2005) p.33.
18.Matthew M. Mench, Fuel Cell Engines. John Wiley & Sons, Inc. (2008). 19.S. Giddey, F.T. Ciacchi, S.P.S. Badwal. J. Power Sources, 125 (2004) 155.
20.Moisés Bautista Rodríguez, M.G. Araceli Rosas Paleta, J. Antonio Rivera Márquez, J. Roberto García de la Vega. Int. J. Electrochem. Sci., 5 (2010) 414.
21.Moisés Bautista-Rodríguez, Araceli Rosas-Paleta, J. Antonio Rivera-Márquez, Omar Solorza-Feria. Int. J. Electrochem. Sci., 4 (2009) 60.
22.S. Lister, C. R. Buie, T. Fabian, J. K, Eaton, J. G. Santiago. J. Electrochem. Soc. 154 (2007) B1049.
23.P. Berg, K. Promislow, J St. Pierre, J. Stumper, B. Wetton. J. Electrochem. Soc. 151 (2004) A341. 24.N. Büchi, S. Srinivasan. J. Electrochem. Soc. 144 (1997) 8.
25.Q. Yan, H. Toghiani, J. Wu. J. Power Sources, 158 (2006) 316.
26.M.M. Saleh, T. Okajima, M. Hayase, F. Kitamura, T. Ohsaka. J.Power Sources, 164 (2007) 503. 27.L.Wang, A. Husar, T. Zhou, H. Liu. International Journal of Hydrogen Energy, 28 (2003) 1263. 28.O. Himanen, T. Hottinen, S. Tuurala. Electrochemistry Comunications, 9 (2007) 891.
29.Mulder, Fjo De Ridder, P. Coenen, D. Wyen, A. Martens, International Journal of Hydrogen Energy, 33 (2008) 5728.
30.Z. Lui, L. Yang, Z. Mao, W. Zhuge, Y. Zhang, L. Wang. J. Power Sources, 157 (2006) 166. 31.J. Zhang, Y. Tang, C. Song, X. Cheng, J. Zhang, H. Wnag. Electrochimica Acta, 52 (2007) 5095. 32.M. Amirinejad, S. Rowshanzamir, M. H. Eikani. J. Power Sources, 161 (2006) 872.
33.J. Hamelin, K. Agbossou, A. Laperrière, F. Laurencelle, T. T. Bose. International Journal of Hydrogen Energy, 26 (2001) 625.
34.K. Junbom, L. Seong-Min, S. Supramaniam. J. Eclectrochemical Society, 142 (1995) 8.
35.D.R. Sena, E.A. Ticianelli, V.A. Paganin, E.R. Gonzalez. J. Electroanalytical Chemistry, 477 (1999) 164.
36.Deryn Chu, Rongzhong Jiang. J Power Sources, 80 (1999) 226.