This is a repository copy of
Certolizumab pegol and secukinumab for treating active
psoriatic arthritis following inadequate response to disease-modifying antirheumatic
drugs : a systematic review and economic evaluation
.
White Rose Research Online URL for this paper:
http://eprints.whiterose.ac.uk/122272/
Version: Published Version
Article:
Corbett, Mark orcid.org/0000-0002-5937-1493, Chehadah, Fadi, Biswas, Mousumi
orcid.org/0000-0001-6781-7400 et al. (8 more authors) (2017) Certolizumab pegol and
secukinumab for treating active psoriatic arthritis following inadequate response to
disease-modifying antirheumatic drugs : a systematic review and economic evaluation.
Health technology assessment. pp. 1-326. ISSN 2046-4924
https://doi.org/10.3310/hta21560
eprints@whiterose.ac.uk https://eprints.whiterose.ac.uk/
Reuse
Items deposited in White Rose Research Online are protected by copyright, with all rights reserved unless indicated otherwise. They may be downloaded and/or printed for private study, or other acts as permitted by national copyright laws. The publisher or other rights holders may allow further reproduction and re-use of the full text version. This is indicated by the licence information on the White Rose Research Online record for the item.
Takedown
If you consider content in White Rose Research Online to be in breach of UK law, please notify us by
VOLUME 21 ISSUE 56 OCTOBER 2017 ISSN 1366-5278
Certolizumab pegol and secukinumab for treating
active psoriatic arthritis following inadequate
response to disease-modifying antirheumatic drugs:
a systematic review and economic evaluation
treating active psoriatic arthritis following
inadequate response to disease-modifying
antirheumatic drugs: a systematic review
and economic evaluation
Mark Corbett,
1
Fadi Chehadah,
2
Mousumi Biswas,
1
Thirimon Moe-Byrne,
1
Stephen Palmer,
2
Marta Soares,
2
Matthew Walton,
1
Melissa Harden,
1
Pauline Ho,
3
Nerys Woolacott
1
* and Laura Bojke
2
1
Centre for Reviews and Dissemination, University of York, York, UK
2
Centre for Health Economics, University of York, York, UK
3
The Kellgren Centre for Rheumatology, Central Manchester and Manchester
Children
’
s University Hospitals Trust, Manchester, UK
*Corresponding author
Declared competing interests of authors:none
Published October 2017
DOI: 10.3310/hta21560This report should be referenced as follows:
Corbett M, Chehadah F, Biswas M, Moe-Byrne T, Palmer S, Soares M,et al. Certolizumab pegol and secukinumab for treating active psoriatic arthritis following inadequate response to disease-modifying antirheumatic drugs: a systematic review and economic evaluation.Health Technol Assess2017;21(56).
Health Technology Assessmentis indexed and abstracted inIndex Medicus/MEDLINE,Excerpta Medica/EMBASE,Science Citation Index Expanded(SciSearch®) andCurrent Contents®/
ISSN 1366-5278 (Print)
ISSN 2046-4924 (Online)
Impact factor: 4.236
Health Technology Assessmentis indexed in MEDLINE, CINAHL, EMBASE, The Cochrane Library and the Clarivate Analytics Science Citation Index.
This journal is a member of and subscribes to the principles of the Committee on Publication Ethics (COPE) (www.publicationethics.org/).
Editorial contact: journals.library@nihr.ac.uk
The full HTA archive is freely available to view online at www.journalslibrary.nihr.ac.uk/hta. Print-on-demand copies can be purchased from the report pages of the NIHR Journals Library website: www.journalslibrary.nihr.ac.uk
Criteria for inclusion in theHealth Technology Assessmentjournal
Reports are published inHealth Technology Assessment(HTA) if (1) they have resulted from work for the HTA programme, and (2) they are of a sufficiently high scientific quality as assessed by the reviewers and editors.
Reviews inHealth Technology Assessmentare termed‘systematic’when the account of the search appraisal and synthesis methods (to minimise biases and random errors) would, in theory, permit the replication of the review by others.
HTA programme
The HTA programme, part of the National Institute for Health Research (NIHR), was set up in 1993. It produces high-quality research information on the effectiveness, costs and broader impact of health technologies for those who use, manage and provide care in the NHS. ‘Health technologies’are broadly defined as all interventions used to promote health, prevent and treat disease, and improve rehabilitation and long-term care.
The journal is indexed in NHS Evidence via its abstracts included in MEDLINE and its Technology Assessment Reports inform National Institute for Health and Care Excellence (NICE) guidance. HTA research is also an important source of evidence for National Screening Committee (NSC) policy decisions.
For more information about the HTA programme please visit the website: http://www.nets.nihr.ac.uk/programmes/hta
This report
The research reported in this issue of the journal was commissioned and funded by the HTA programme on behalf of NICE as project number 15/06/04. The protocol was agreed in January 2016. The assessment report began editorial review in September 2016 and was accepted for publication in March 2017. The authors have been wholly responsible for all data collection, analysis and interpretation, and for writing up their work. The HTA editors and publisher have tried to ensure the accuracy of the authors’report and would like to thank the reviewers for their constructive comments on the draft document. However, they do not accept liability for damages or losses arising from material published in this report.
This report presents independent research funded by the National Institute for Health Research (NIHR). The views and opinions expressed by authors in this publication are those of the authors and do not necessarily reflect those of the NHS, the NIHR, NETSCC, the HTA programme or the Department of Health. If there are verbatim quotations included in this publication the views and opinions expressed by the
interviewees are those of the interviewees and do not necessarily reflect those of the authors, those of the NHS, the NIHR, NETSCC, the HTA programme or the Department of Health.
© Queen’s Printer and Controller of HMSO 2017. This work was produced by Corbettet al.under the terms of a commissioning contract issued by the Secretary of State for Health. This issue may be freely reproduced for the purposes of private research and study and extracts (or indeed, the full report) may be included in professional journals provided that suitable acknowledgement is made and the reproduction is not associated with any form of advertising. Applications for commercial reproduction should be addressed to: NIHR Journals Library, National Institute for Health Research, Evaluation, Trials and Studies Coordinating Centre, Alpha House, University of Southampton Science Park, Southampton SO16 7NS, UK.
Editor-in-Chief
Health Technology Assessment
NIHR Journals Library
Professor Tom Walley Director, NIHR Evaluation, Trials and Studies and Director of the EME Programme, UK
NIHR Journals Library Editors
Editor-in-Chief
Professor Hywel Williams Director, HTA Programme, UK and Foundation Professor and Co-Director of the Centre of Evidence-Based Dermatology, University of Nottingham, UK
Professor Ken Stein Chair of HTA and EME Editorial Board and Professor of Public Health, University of Exeter Medical School, UK
Professor Andrée Le May Chair of NIHR Journals Library Editorial Group (HS&DR, PGfAR, PHR journals)
Dr Martin Ashton-Key Consultant in Public Health Medicine/Consultant Advisor, NETSCC, UK
Professor Matthias Beck Chair in Public Sector Management and Subject Leader (Management Group), Queen’s University Management School, Queen’s University Belfast, UK
Dr Tessa Crilly Director, Crystal Blue Consulting Ltd, UK
Dr Eugenia Cronin Senior Scientific Advisor, Wessex Institute, UK
Dr Peter Davidson Director of the NIHR Dissemination Centre, University of Southampton, UK
Ms Tara Lamont Scientific Advisor, NETSCC, UK
Dr Catriona McDaid Senior Research Fellow, York Trials Unit, Department of Health Sciences, University of York, UK
Professor William McGuire Professor of Child Health, Hull York Medical School, University of York, UK
Professor Geoffrey Meads Professor of Wellbeing Research, University of Winchester, UK
Professor John Norrie Chair in Medical Statistics, University of Edinburgh, UK
Professor John Powell Consultant Clinical Adviser, National Institute for Health and Care Excellence (NICE), UK
Professor James Raftery Professor of Health Technology Assessment, Wessex Institute, Faculty of Medicine, University of Southampton, UK
Dr Rob Riemsma Reviews Manager, Kleijnen Systematic Reviews Ltd, UK
Professor Helen Roberts Professor of Child Health Research, UCL Institute of Child Health, UK
Professor Jonathan Ross Professor of Sexual Health and HIV, University Hospital Birmingham, UK
Professor Helen Snooks Professor of Health Services Research, Institute of Life Science, College of Medicine, Swansea University, UK
Professor Jim Thornton Professor of Obstetrics and Gynaecology, Faculty of Medicine and Health Sciences, University of Nottingham, UK
Professor Martin Underwood Director, Warwick Clinical Trials Unit, Warwick Medical School, University of Warwick, UK
Please visit the website for a list of members of the NIHR Journals Library Board: www.journalslibrary.nihr.ac.uk/about/editors
Editorial contact: journals.library@nihr.ac.uk
Abstract
Certolizumab pegol and secukinumab for treating active
psoriatic arthritis following inadequate response to
disease-modifying antirheumatic drugs: a systematic
review and economic evaluation
Mark Corbett,
1Fadi Chehadah,
2Mousumi Biswas,
1Thirimon Moe-Byrne,
1Stephen Palmer,
2Marta Soares,
2Matthew Walton,
1Melissa Harden,
1Pauline Ho,
3Nerys Woolacott
1*
and Laura Bojke
21Centre for Reviews and Dissemination, University of York, York, UK 2Centre for Health Economics, University of York, York, UK
3The Kellgren Centre for Rheumatology, Central Manchester and Manchester Children’s University
Hospitals Trust, Manchester, UK
*Corresponding author nerys.woolacott@york.ac.uk
Background:Several biologic therapies are approved by the National Institute for Health and Care
Excellence (NICE) for psoriatic arthritis (PsA) patients who have had an inadequate response to two or more synthetic disease-modifying antirheumatic drugs (DMARDs). NICE does not specifically recommend switching from one biologic to another, and only ustekinumab (UST; STELARA®, Janssen Pharmaceuticals,
Inc., Horsham, PA, USA) is recommended after anti-tumour necrosis factor failure. Secukinumab (SEC; COSENTYX®, Novartis International AG, Basel, Switzerland) and certolizumab pegol (CZP; CIMZIA®, UCB
Pharma, Brussels, Belgium) have not previously been appraised by NICE.
Objective:To determine the clinical effectiveness and cost-effectiveness of CZP and SEC for treating active
PsA in adults in whom DMARDs have been inadequately effective.
Design:Systematic review and economic model.
Data sources:Fourteen databases (including MEDLINE and EMBASE) were searched for relevant studies
from inception to April 2016 for CZP and SEC studies; update searches were run to identify new comparator studies.
Review methods:Clinical effectiveness data from randomised controlled trials (RCTs) were synthesised
using Bayesian network meta-analysis (NMA) methods to investigate the relative efficacy of SEC and CZP compared with comparator therapies. A de novo model was developed to assess the cost-effectiveness of SEC and CZP compared with the other relevant comparators. The model was specified for three subpopulations, in accordance with the NICE scope (patients who have taken one prior DMARD, patients who have taken two or more prior DMARDs and biologic-experienced patients). The models were further classified according to the level of concomitant psoriasis.
Results:Nineteen eligible RCTs were included in the systematic review of short-term efficacy. Most studies
were more likely to be responders than patients taking placebo. The NMA results for the biologic-naive subpopulations indicated that the effectiveness of SEC and CZP relative to other biologics and each other was uncertain. Limited data were available for the biologic-experienced subpopulation. Longer-term evidence suggested that these newer biologics reduced disease progression, with the benefits being similar to those seen for older biologics. The de novo model generated incremental cost-effectiveness ratios (ICERs) for three subpopulations and three psoriasis subgroups. In subpopulation 1 (biologic-naive patients who had taken one prior DMARD), CZP was the optimal treatment in the moderate–severe psoriasis subgroup and 150 mg of SEC was optimal in the subgroups of patients with mild–moderate psoriasis or no concomitant psoriasis. In subpopulation 2 (biologic-naive patients who had taken two or more prior DMARDs), etanercept (ETN; ENBREL®, Pfizer Inc., New York City, NY, USA) is likely to be the optimal treatment in all subgroups. The ICERs
for SEC and CZP versus best supportive care are in the region of £20,000–30,000 per quality-adjusted life-year (QALY). In subpopulation 3 (biologic-experienced patients or patients in whom biologics are contraindicated), UST is likely to be the optimal treatment (ICERs are in the region of £21,000–27,000 per QALY). The optimal treatment in subpopulation 2 was sensitive to the choice of evidence synthesis model. In subpopulations 2 and 3, results were sensitive to the algorithm for Health Assessment Questionnaire-Disability Index costs. The optimal treatment is not sensitive to the use of biosimilar prices for ETN and infliximab (REMICADE®, Merck
Sharp & Dohme, Kenilworth, NJ, USA).
Conclusions:SEC and CZP may be an effective use of NHS resources, depending on the subpopulation
and subgroup of psoriasis severity. There are a number of limitations to this assessment, driven mainly by data availability.
Future work:Trials are needed to inform effectiveness of biologics in biologic-experienced populations.
Study registration:This study is registered as PROSPERO CRD42016033357.
Funding:The National Institute for Health Research Health Technology Assessment programme.
ABSTRACT
Contents
List of tables xi
List of figures xxv
Glossary xxvii
List of abbreviations xxxiii
Plain English summary xxxvii
Scientific summary xxxix
Chapter 1Background 1
Description of health problem 1
Diagnosis 1
Epidemiology 2
Measurement of disease 2
Current service provision 3
Description of the technology under assessment 4
Chapter 2Definition of the decision problem 5
Previous National Institute for Health and Care Excellence appraisals 5
Overall aims and objectives of assessment 5
Chapter 3Assessment of clinical effectiveness 7
Methods for reviewing clinical effectiveness 7
Search strategies 7
Inclusion criteria 7
Data extraction 9
Quality assessment 9
Methods of data synthesis 10
Quantity and quality of the identified evidence 10 Characteristics of the randomised controlled trials included in the systematic review of
short-term efficacy 11
Risk-of-bias assessments 22
Short-term efficacy of secukinumab 22
FUTURE 2 trial 32
ERASURE and FIXTURE trials 39
CLEAR trial 40
Summary 41
Efficacy at 12–24 weeks in the RAPID PsA full-trial population 46
Efficacy in the RAPID-PsA biologic-naive and biologic-experienced subgroups 46
Other efficacy results 47
Summary 48
Evaluating the secukinumab and certolizumab pegol trial results in comparison with
other treatments 48
Long-term effectiveness 52
Review of anti-tumour necrosis factor patient registry studies 61
Drug survival and anti-tumour necrosis factor switching 61
Review of the natural history of psoriatic arthritis: registry and cohort study data 67 Review of adverse effects of certolizumab pegol, secukinumab and comparators 70
Randomised trials of certolizumab pegol or secukinumab for psoriatic arthritis 70
Open-label extensions of randomised controlled trials of certolizumab pegol
and secukinumab 70
Reviews of safety outcomes for other biologics 71
Recent large observational studies 73
Summary 73
Chapter 4Evidence synthesis: relative efficacy of treatments 75
Framework of analyses 75
Psoriatic Arthritis Response Criteria response 78
Subpopulation: biologic naive 78
Subpopulation: biologic experienced 84
Health Assessment Questionnaire-Disability Index changes conditional on Psoriatic
Arthritis Response Criteria response/non-response 86
Subpopulation: biologic naive 86
Subpopulation: biologic experienced 88
Psoriasis Area and Severity Index response 88
Subpopulation: biologic naive 88
Subpopulation: biologic experienced 94
American College of Rheumatology response 96
Subpopulation: biologic naive 96
Subpopulation: biologic experienced 100
Limitations 102
Summary of findings of relative efficacy from network meta-analysis 102
Biologic-naive patients 102
Biologic-experienced patients 103
Chapter 5Assessment of existing cost-effectiveness evidence 105
Methods 105
Results 105
Identified published studies 105
Review of the existing published cost-effectiveness studies 106
Critique of company submissions 114
Cost-effectiveness results from the company submissions 128
Relevance of submitted cost-effectiveness evidence for National Institute for Health and
Care Excellence decision-making: summary and motivation for de novo model 132
Chapter 6Independent economic assessment 135
Introduction 135
Methods 135
Overview 135
Model structure and assumptions 136
Patient characteristics 138
Choice of intervention and comparators 140
Withdrawal from treatment and the natural history of psoriatic arthritis 141
Sources of effectiveness data 143
Mortality 148
Sources of utility data 148
Sources of resource utilisation and costs data 149
CONTENTS
Scenario analyses 154
Analytic methods 154
Probabilistic sensitivity analysis 155
Results 155
Results of the base-case cost-effectiveness analysis 155
Results of the scenario analyses 163
Results from the probabilistic sensitivity analysis 166
External validation of results 174
Discussion of the York model 175
Chapter 7Assessment of factors relevant to the NHS and other parties 177
Chapter 8Discussion 179
Statement of principal findings 179
Strengths and limitations of the assessment 180
Uncertainties 181
Chapter 9Conclusions 183
Implications for service provision 183
Suggested research priorities 183
Acknowledgements 185
References 187
Appendix 1Database search strategies 199
Appendix 2Inclusion and exclusion criteria of the included studies 219
Appendix 3Detailed evidence synthesis 225
Appendix 4Search strategy for cost-effectiveness studies 279
Appendix 5Quality assessment checklists for company-submitted models 291
Appendix 6Clinical effectiveness inputs applied in the company models 295
Appendix 7R code for the updated York model 299
Appendix 8Cost-effectiveness results using infliximab and etanercept biosimilar
prices, subpopulation 2 301
Appendix 9Estimating health-related quality of life for the updated York model 303
Appendix 10Search strategy for utility studies 305
Appendix 11Identifying additional psoriatic arthritis health state costs 307
Appendix 12Metaregression results 309
Appendix 13Results from alternative scenarios 311
List of tables
TABLE 1 The Classification Criteria for Psoriatic Arthritis 2
TABLE 2 Trial durations (including open-label extensions) and dosing regimens
of key interventions studied 12
TABLE 3 Treatment doses studied in the review of short-term efficacy 15
TABLE 4 Baseline population characteristics of the included randomised trials 17
TABLE 5 Previous and concomitant treatment details for the included studies 23
TABLE 6 Risk-of-bias judgements for randomised trials (for time points before
early escape crossover) 26
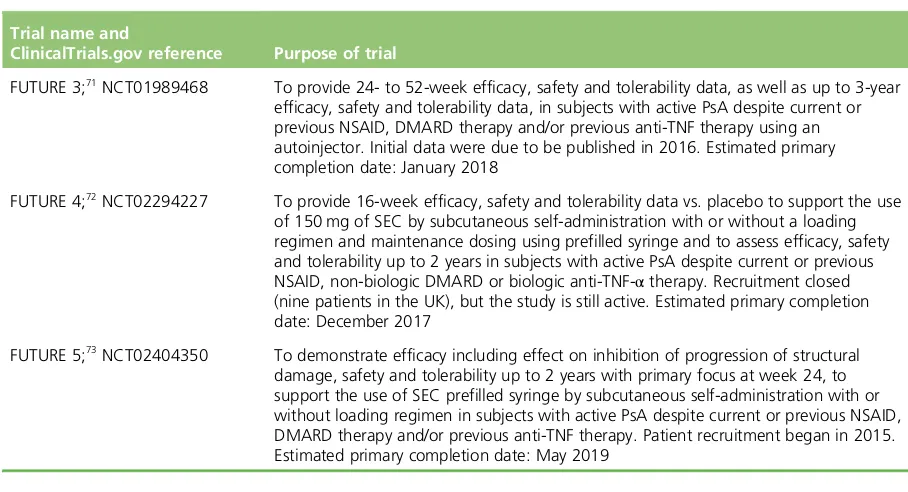
TABLE 7 Ongoing trials of SEC in patients with active PsA 32
TABLE 8 Psoriatic Arthritis Response Criteria, ACR and HAQ-DI responses in the
FUTURE 2 trial 33
TABLE 9 Psoriasis Area and Severity Index response rates in the FUTURE 2 trial 33
TABLE 10 Psoriatic Arthritis Response Criteria and ACR response rates for
biologic-naive and biologic-experienced subgroups in the FUTURE 2 trial 34
TABLE 11 Psoriasis Area and Severity Index response rates for biologic-naive and
biologic-experienced subgroups in the FUTURE 2 trial 35
TABLE 12 Relative risks for key dichotomous outcomes in the FUTURE 2 trial:
150 or 300 mg of SEC vs. placebo 36
TABLE 13 Health Assessment Questionnaire-Disability Index changes based on
PsARC responder status in the FUTURE 2 trial 38
TABLE 14 Health Assessment Questionnaire-Disability Index changes based on
PsARC responder status for biologic-naive and biologic-experienced subgroups in
the FUTURE 2 trial 39
TABLE 15 Efficacy in treating dactylitis and enthesitis in the FUTURE 2 trial 40
TABLE 16 Efficacy outcomes in the ERASURE and FIXTURE trials at 12 weeks 40
TABLE 17 Efficacy outcomes in the CLEAR trial at 16 weeks for the subgroup of
PsA patients 41
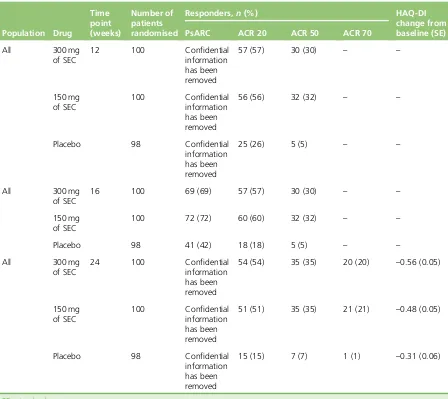
TABLE 18 Psoriatic Arthritis Response Criteria, ACR and HAQ-DI responses in the
RAPID-PsA trial 42
TABLE 20 The RAPID-PsA trial ACR 20 response rates at 12 weeks for subgroups
of previous DMARD use 43
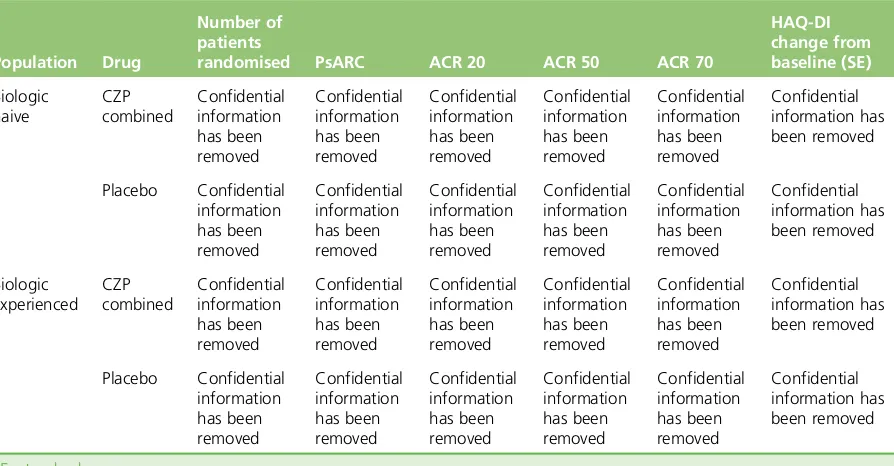
TABLE 21 Biologic-naive and biologic-experienced subgroup PsARC, ACR and
HAQ-DI results in the RAPID-PsA trial at 12 weeks 43
TABLE 22 Biologic-naive and biologic-experienced subgroup PASI response rates
in the RAPID-PsA trial at 12 weeks 44
TABLE 23 Biologic-naive and biologic-experienced PsARC, ACR and HAQ-DI
subgroup results from the RAPID-PsA trial at 24 weeks 44
TABLE 24 Biologic-naive and biologic-experienced PASI subgroup results from
the RAPID-PsA trial at 24 weeks 44
TABLE 25 Relative risks for key outcomes in the RAPID-PsA trial: 200 or 400 mg
of CZP vs. placebo 45
TABLE 26 The RAPID-PsA trial HAQ-DI changes from baseline based on PsARC
responder status 46
TABLE 27 The HAQ-DI changes based on PsARC responder status for
biologic-naive and biologic-experienced subgroups in the RAPID-PsA trial 47
TABLE 28 Efficacy in treating dactylitis and enthesitis in the RAPID-PsA trial 48
TABLE 29 Unadjusted RRs (compared with placebo) across the trials included in
the evidence synthesis 49
TABLE 30 Efficacy results for the FUTURE 2 trial at 52 weeks 53
TABLE 31 Efficacy results for the FUTURE 1 trial at 52 weeks and 104 weeks 54
TABLE 32 Long-term efficacy results for Rapid-PsA trial at 216 weeks 55
TABLE 33 Open-label extension studies of other therapies for PsA 57
TABLE 34 Registry studies reporting data on anti-TNF drug survival and switching 62
TABLE 35 Registries reporting the effects of anti-TNF treatment on HAQ-DI and
radiographic progression 65
TABLE 36 Registries reporting on natural history of PsA 68
TABLE 37 Results of a meta-analysis of safety outcomes for CZP 72
TABLE 38 List of comparators included in evidence synthesis 75
TABLE 39 Evidence on PsARC, HAQ-DI conditional on PsARC, PASI and ACR, by trial 77
TABLE 40 Summary of trial-specific data in the biologic-naive subpopulation for
PsARC response 79
LIST OF TABLES
TABLE 41 Key assumptions of models implemented for the evidence synthesis of
PsARC response 81
TABLE 42 Network meta-analysis results of PsARC response: log-ORs (median) of
treatments analysed (including the studies of Genoveseet al.and Measeet al.)
in the biologic-naive subpopulation 82
TABLE 43 Network meta-analysis results: probability of PsARC response and ORs
by treatments in the biologic-naive subpopulation 84
TABLE 44 Summary of trial-specific data in the biologic-experienced
subpopulation for PsARC response outcome 85
TABLE 45 Network meta-analysis results of PsARC response: probability
of a PsARC response, ORs and treatment effects on a log-scale in the
biologic-experienced subpopulation 86
TABLE 46 The HAQ-DI changes conditional on PsARC response and non-response
by trials and treatments in the biologic-naive subpopulation: observed data 87
TABLE 47 Network meta-analysis results of HAQ-DI score changes (median)
conditional on PsARC response and non-response in the biologic-naive subpopulation 89
TABLE 48 The HAQ-DI score changes conditional on PsARC response and
non-response by trials and treatments in the biologic-experienced subpopulation:
observed data 90
TABLE 49 Network meta-analysis results of evidence synthesis of HAQ-DI changes
conditional on PsARC response and non-response in biologic-experienced
subpopulation 91
TABLE 50 Summary of trial-specific data in the biologic-naive subpopulation for
PASI response outcome 92
TABLE 51 Summary of models implemented for evidence synthesis of the
PASI response 93
TABLE 52 Network meta-analysis results of the PASI response: treatment effects
(median) on a probit scale in the biologic-naive subpopulation 93
TABLE 53 Network meta-analysis results of the PASI response: probability of
achieving PASI 50, PASI 75 and PASI 90 in the biologic-naive subpopulation 94
TABLE 54 Summary of trial-specific data in the biologic-experienced
subpopulation for PASI response outcome 95
TABLE 55 Network meta-analysis results of the PASI response: probability
of achieving PASI 50, PASI 75, PASI 90 and treatment effects in the
biologic-experienced subpopulation 96
TABLE 56 Summary of trial-specific data in the biologic-naive subpopulation for
TABLE 57 Key assumptions of models implemented for evidence synthesis of
ACR response 98
TABLE 58 Network meta-analysis results of ACR response: treatment effects
(median) on a probit scale in a biologic-naive subpopulation 99
TABLE 59 Network meta-analysis results of ACR response: probability of
achieving ACR 20, ACR 50 and ACR 70 responses in a biologic-naive subpopulation 100
TABLE 60 Summary of trial-specific data in a biologic-experienced subpopulation
for ACR response outcome 101
TABLE 61 Network meta-analysis results of ACR response: probability of
achieving ACR 20, ACR 50 and ACR 70 responses, and treatment effects in a
biologic-experienced subpopulation 102
TABLE 62 Baseline patient characteristics used in the York model 109
TABLE 63 Psoriasis (PASI) costs applied in the York model 111
TABLE 64 Summary of cost-effectiveness results from the published studies and
NICE TAs 114
TABLE 65 Summary of the Novartis and UCB Pharma models 115
TABLE 66 Baseline characteristics in subpopulations 1–3 (UCB Pharma) 123
TABLE 67 Baseline characteristics in subpopulations 1–3 (Novartis) 123
TABLE 68 Discontinuation rates applied in sensitivity analysis (Novartis) 124
TABLE 69 Utility algorithms used in the CSs 126
TABLE 70 Health Assessment Questionnaire-Disability Index and PASI costs
applied in the Novartis model 127
TABLE 71 Health Assessment Questionnaire-Disability Index and PASI costs
applied in the UCB Pharma model 128
TABLE 72 Base-case results for subpopulation 1 (biologic naive, one prior
DMARD): the UCB Pharma submission 128
TABLE 73 Base-case results for subpopulation 1 (biologic naive, one prior
DMARD): the Novartis submission 129
TABLE 74 UCB Pharma’s base-case ICER results for subpopulation 2 (biologic
naive, one or more prior DMARDs) 129
TABLE 75 Novartis’base-case ICER results for subpopulation 2 (biologic naive,
two or more prior DMARDs) 130
TABLE 76 UCB Pharma’s base-case ICER results for subpopulation 3 (biologic
experienced) 131
LIST OF TABLES
TABLE 77 Novartis’base-case ICER results for subpopulation 3 (biologic
experienced) 131
TABLE 78 Summary of data inputs for the York model 139
TABLE 79 Effectiveness data utilised in the economic model 145
TABLE 80 Probabilities of PsARC and PASI 75 responses at 3 months:
independent analysis 147
TABLE 81 Probabilities of PsARC and PASI 75 responses at 3 months:
metaregression, shrunken estimates 147
TABLE 82 Intervention-related costs applied in the updated York model 149
TABLE 83 Summary of drug acquisition, administration and monitoring costs
used in the economic model 150
TABLE 84 Number of vials administered for each treatment 150
TABLE 85 Distribution of weights used to determine INF vials required 151
TABLE 86 Acquisition costs used in the updated York model 151
TABLE 87 Administration costs used in the updated York model 152
TABLE 88 Initiation and monitoring resource use and costs 152
TABLE 89 Costs (£) assigned for PASI 75 non-responders and patients not
receiving biologics 153
TABLE 90 Treatment effects from the independent analysis for moderate–severe
psoriasis, subpopulation 1: fully incremental cost-effectiveness analysis 156
TABLE 91 Treatment effects from the independent analysis for mild–moderate
psoriasis, subpopulation 1: fully incremental cost-effectiveness analysis 156
TABLE 92 Treatment effects from the independent analysis for no concomitant
psoriasis, subpopulation 1: fully incremental cost-effectiveness analysis 157
TABLE 93 Summary of differences between independent and metaregression
approaches, subpopulation 1 158
TABLE 94 Treatment effects from the independent analysis for moderate–severe
psoriasis, subpopulation 2: fully incremental cost-effectiveness analysis 158
TABLE 95 Treatment effects from the independent analysis for mild–moderate
psoriasis, subpopulation 2: fully incremental cost-effectiveness analysis 159
TABLE 96 Treatment effects from the independent analysis for no concomitant
TABLE 97 Summary of differences between independent and metaregression
approaches, subpopulation 2 160
TABLE 98 Moderate–severe psoriasis, subpopulation 3: fully incremental
cost-effectiveness analysis 161
TABLE 99 Mild–moderate psoriasis, subpopulation 3: fully incremental
cost-effectiveness analysis 161
TABLE 100 No concomitant psoriasis, subpopulation 3: fully incremental
cost-effectiveness analysis 161
TABLE 101 Moderate–severe psoriasis, subpopulation 4, contraindicated: fully
incremental cost-effectiveness analysis 162
TABLE 102 Mild–moderate psoriasis, subpopulation 4, contraindicated: fully
incremental cost-effectiveness analysis 162
TABLE 103 No concomitant psoriasis, subpopulation 4, contraindicated: fully
incremental cost-effectiveness analysis 163
TABLE 104 Summary of differences between base-case models and alternative
scenarios, subpopulation 1 163
TABLE 105 Summary of differences between base-case models and alternative
scenarios, subpopulation 2 164
TABLE 106 Summary of differences between base-case models and alternative
scenarios, subpopulation 3 165
TABLE 107 Moderate–severe psoriasis, subpopulation 4, secondary failures: fully
incremental cost-effectiveness analysis 165
TABLE 108 Mild–moderate psoriasis, subpopulation 4, secondary failures: fully
incremental cost-effectiveness analysis 166
TABLE 109 No concomitant psoriasis, subpopulation 4, secondary failures: fully
incremental cost-effectiveness analysis 166
TABLE 110 Treatment effects from the independent analysis for moderate–severe
psoriasis, subpopulation 1: fully incremental cost-effectiveness PSA 167
TABLE 111 Treatment effects from the independent analysis for mild–moderate
psoriasis, subpopulation 1: fully incremental cost-effectiveness PSA 167
TABLE 112 Treatment effects from the independent analysis for no concomitant
psoriasis, subpopulation 1: fully incremental cost-effectiveness PSA 167
TABLE 113 Summary of differences for the PSA results between independent
and metaregression approaches, subpopulation 1 168
TABLE 114 Treatment effects from the independent analysis for moderate–severe
psoriasis, subpopulation 2: fully incremental cost-effectiveness PSA 168
LIST OF TABLES
TABLE 115 Treatment effects from the independent analysis for mild–moderate
psoriasis, subpopulation 2: fully incremental cost-effectiveness PSA 169
TABLE 116 Treatment effects from independent analysis for no concomitant
psoriasis, subpopulation 2: fully incremental cost-effectiveness PSA 170
TABLE 117 Summary of differences for the PSA results between independent
and metaregression approaches, subpopulation 2 170
TABLE 118 Moderate–severe psoriasis, subpopulation 3: fully incremental
cost-effectiveness PSA 171
TABLE 119 Mild–moderate psoriasis, subpopulation 3: fully incremental
cost-effectiveness PSA 171
TABLE 120 No concomitant psoriasis, subpopulation 3: fully incremental
cost-effectiveness PSA 171
TABLE 121 The 12- and 24-week full population results across recent trials that
used an early escape at 16 weeks design 226
TABLE 122 Key assumptions of models implemented for evidence synthesis of
PsARC response 229
TABLE 123 Description of models and underlying assumptions for PsARC response 230
TABLE 124 Results of PsARC response: log-ORs (median) of treatments analysed
(including Genoveseet al.and Measeet al.studies) in the biologic-naive
subpopulation 231
TABLE 125 Results of PsARC response: log-ORs (median) of treatments analysed
(excluding Genoveseet al.and Measeet al.studies) in the biologic-naive
subpopulation 232
TABLE 126 Result of PsARC response: baseline effect (log-odds) in the
biologic-naive subpopulation 232
TABLE 127 Results of model A1: treatment effects (treatment, independent;
studies, fixed effect) 233
TABLE 128 Results of model B1: treatment effects (metaregression; treatment,
independent; studies, fixed effect) 233
TABLE 129 Results of model C1: treatment effects (metaregression; treatment,
equal | class; studies, fixed effect) 234
TABLE 130 Results of model C2: treatment effects (metaregression; treatment,
APR=independent, other biologics=equal | class; studies, fixed effect) 234
TABLE 131 Results of model C3: treatment effects [metaregression; treatment,
APR=independent, equal | class (ILs, anti-TNFs); studies, fixed effect, including all
TABLE 132 Results of model D1: treatment effects (metaregression; treatment, APR=independent, other biologics=exchangeable | class; studies, fixed effect,
including all studies) 235
TABLE 133 Results of model D2: treatment effects [metaregression; treatment,
APR=independent, exchangeable | class (ILs, anti-TNFs); studies: fixed effect,
including all studies] 235
TABLE 134 Results of model A1: treatment effects (treatment, independent;
studies, fixed effect, excluding Genoveseet al.and Measeet al.) 236
TABLE 135 Results of model B1: treatment effects (metaregression; treatment,
independent; studies, fixed effect, excluding Genoveseet al.and Measeet al.) 236
TABLE 136 Results of model C1: treatment effects (metaregression; treatment,
equal | class; studies, fixed effect, excluding Genoveseet al.and Measeet al.) 237
TABLE 137 Results of model C2: treatment effects (metaregression; treatment,
APR=independent, other biologics=equal | class; studies, fixed effect, excluding
Genoveseet al.and Measeet al.) 237
TABLE 138 Results of model C3: treatment effects (metaregression; treatment,
APR=independent, equal | class (ILs, anti-TNFs); studies, fixed effect, excluding
Genoveseet al.and Measeet al.) 237
TABLE 139 Results of model D1: treatment effects (metaregression; treatment,
APR=independent, exchangeable | class; studies, fixed effect, excluding
Genoveseet al.and Measeet al.) 238
TABLE 140 Results of model D2: treatment effects [metaregression; treatment,
APR=independent, exchangeable | class (ILs, anti-TNFs); studies, fixed effect,
excluding Genoveseet al.and Measeet al.] 238
TABLE 141 Comparison of evidence synthesis of PsARC responses in the CSs
(Novartis and UCB Pharma), a previous MTA and the current AG 240
TABLE 142 Key assumptions in the synthesis models for PsARC responses in the
CSs (Novartis and UCB Pharma), a previous MTA and the current AG 241
TABLE 143 Comparison of probability of PsARC response in Novartis’submission,
a previous MTA and the current AG in the biologic-naive subpopulation 242
TABLE 144 Comparison of PsARC response (ORs) at 12 weeks between UCB
Pharma’s submission and the current AG in the biologic-naive subpopulation 242
TABLE 145 Description of the models and underlying assumptions for HAQ-DI
changes conditional on PsARC response 244
TABLE 146 Results of HAQ-DI score changes (median) conditional on PsARC
response and non-response in biologic-naive subpopulation 245
TABLE 147 Results of model E1: treatment effects (treatment, independent;
difference between PR/TNR/TR and PNR pooled using fixed effects) 246
LIST OF TABLES
TABLE 148 Results of model E2: treatment effects [treatment, exchangeable | class (ILs, anti-TNF), APR=independent; difference between PR/TNR/TR and PNR pooled
using fixed effects] 247
TABLE 149 Results of model E3: treatment effects [treatment, equal | class
(ILs, anti-TNF), APR=independent; difference between PR/TNR/TR and PNR
pooled using fixed effects] 248
TABLE 150 Comparison of evidence synthesis of HAQ-DI score changes
conditional on PsARC response/non-response in UCB Pharma’s submission,
a previous MTA and the current AG 248
TABLE 151 The HAQ-DI score changes conditional on PsARC response model
results in the biologic-naive subpopulation 249
TABLE 152 Summary of models implemented for evidence synthesis of
PASI response 253
TABLE 153 Description of models and underlying assumptions for PASI response
and ACR response 253
TABLE 154 Results of PASI response: treatment effects (median) on a probit scale
in the biologic-naive subpopulation 254
TABLE 155 Results of model F1: treatment effects (on a probit scale) and the
different cut-off points (PASI 50, PASI 75 and PASI 90) 255
TABLE 156 Results of model G1: treatment effects (on a probit scale) and the
different cut-off points (PASI 50, PASI 75 and PASI 90) 255
TABLE 157 Results of model G2: treatment effects (on a probit scale) and the
different cut-off points (PASI 50, PASI 75 and PASI 90) 256
TABLE 158 Comparison of evidence synthesis of PASI responses in the CSs
(Novartis and UCB Pharma), a previous MTA and the current AG 257
TABLE 159 Key assumptions in the synthesis models for PASI responses in the CSs
(Novartis and UCB Pharma), a previous MTA and the current AG 258
TABLE 160 Comparison of PASI response in the CSs (Novartis and UCB Pharma),
a previous MTA and the current AG in the biologic-naive subpopulation 258
TABLE 161 Comparison of PASI response in the UCB Pharma submission and the
current AG in the biologic-experienced subpopulation 261
TABLE 162 Key assumptions of models implemented for evidence synthesis of
ACR response 264
TABLE 163 Description of models and underlying assumptions for ACR response 265
TABLE 164 Results of ACR response: treatment effects (median) on a probit scale
TABLE 165 Results of model H1: treatment effects (on a probit scale) and the
different cut-off points (ACR 20, ACR 50 and ACR 70) 267
TABLE 166 Results of model I1: treatment effects (on a probit scale) and the
different cut-off points (ACR 20, ACR 50 and ACR 70) 267
TABLE 167 Results of model J1: treatment effects (on a probit scale) and the
different cut-off points (ACR 20, ACR 50 and ACR 70) 268
TABLE 168 Results of model J2: treatment effects (on a probit scale) and the
different cut-off points (ACR 20, ACR 50 and ACR 70) 268
TABLE 169 Results of model J3: treatment effects (on a probit scale) and the
different cut-off points (ACR 20, ACR 50 and ACR 70) 269
TABLE 170 Results of model K1: treatment effects (on a probit scale) and the
different cut-off points (ACR 20, ACR 50 and ACR 70) 269
TABLE 171 Results of model K2: treatment effects (on a probit scale) and the
different cut-off points (ACR 20, ACR 50 and ACR 70) 270
TABLE 172 Comparison of evidence synthesis of ACR responses in CSs (Novartis
and UCB Pharma), the previous MTA and the current AG 271
TABLE 173 Key assumptions in the synthesis models for ACR responses in CSs
(Novartis and UCB Pharma), the previous MTA and the current AG 272
TABLE 174 Comparison of ACR response in the CSs (Novartis and UCB Pharma),
the previous MTA and the current AG in the biologic-naive subpopulation 273
TABLE 175 Comparison of ACR response in UCB Pharma submission and the
current AG in the biologic-experienced subpopulation 275
TABLE 176 Response parameters applied in model for subpopulation 1:
UCB Pharma 295
TABLE 177 Response parameters applied in model for subpopulation 1: Novartis 295
TABLE 178 Health Assessment Questionnaire-Disability Index score change
according to the PsARC response for subpopulation 1: UCB Pharma 295
TABLE 179 Health Assessment Questionnaire-Disability Index score change
according to the PsARC response for subpopulation 1: Novartis 295
TABLE 180 Response parameters applied in model for subpopulation 1:
UCB Pharma 296
TABLE 181 Response parameters applied in model for subpopulation 2: Novartis 296
TABLE 182 Health Assessment Questionnaire-Disability Index score change
according to the PsARC response for subpopulation 2: UCB Pharma 297
LIST OF TABLES
TABLE 183 Health Assessment Questionnaire-Disability Index score change
according to the PsARC response for subpopulation 2: Novartis 297
TABLE 184 Response parameters applied in model for subpopulation 3:
UCB Pharma 297
TABLE 185 Response parameters applied in model for subpopulation 3: Novartis 298
TABLE 186 Health Assessment Questionnaire-Disability Index score change
according to the PsARC response for subpopulation 3: UCB Pharma 298
TABLE 187 Health Assessment Questionnaire-Disability Index score change
according to the PsARC response for subpopulation 3: Novartis 298
TABLE 188 Treatment effects from independent analysis for moderate–severe
psoriasis, subpopulation 2: fully incremental cost-effectiveness analysis,
biosimilar prices 301
TABLE 189 Treatment effects from independent analysis for mild–moderate
psoriasis, subpopulation 2: fully incremental cost-effectiveness analysis,
biosimilar prices 302
TABLE 190 Treatment effects from independent analysis for no concomitant
psoriasis, subpopulation 2: fully incremental cost-effectiveness analysis,
biosimilar prices 302
TABLE 191 Full results of Wyeth’s linear regressions of utility vs. HAQ-DI, PASI
and HAQ-DI × PASI 303
TABLE 192 Utilities papers screened for inclusion 304
TABLE 193 Treatment effects from metaregression for moderate–severe
psoriasis, subpopulation 1: fully incremental cost-effectiveness analysis 309
TABLE 194 Treatment effects from metaregression for mild–moderate psoriasis,
subpopulation 1: fully incremental cost-effectiveness analysis 309
TABLE 195 Treatment effects from metaregression for no concomitant psoriasis,
subpopulation 1: fully incremental cost-effectiveness analysis 309
TABLE 196 Treatment effects from metaregression for moderate–severe
psoriasis, subpopulation 2: fully incremental cost-effectiveness analysis 310
TABLE 197 Treatment effects from metaregression analysis for mild–moderate
psoriasis, subpopulation 2: fully incremental cost-effectiveness analysis 310
TABLE 198 Treatment effects from metaregression for no concomitant psoriasis,
subpopulation 2: fully incremental cost-effectiveness analysis 310
TABLE 199 Treatment effects from independent analysis for moderate–severe
psoriasis, subpopulation 1: fully incremental cost-effectiveness analysis,
TABLE 200 Treatment effects from independent analysis for mild–moderate psoriasis, subpopulation 1: fully incremental cost-effectiveness analysis,
subpopulation-specific baseline HAQ-DI score 311
TABLE 201 Treatment effects from independent analysis for no concomitant
psoriasis, subpopulation 1: fully incremental cost-effectiveness analysis,
subpopulation-specific baseline HAQ-DI score 311
TABLE 202 Treatment effects from independent analysis for moderate–severe
psoriasis, subpopulation 2: fully incremental cost-effectiveness analysis,
subpopulation-specific baseline HAQ-DI score 311
TABLE 203 Treatment effects from independent analysis for mild–moderate
psoriasis, subpopulation 2: fully incremental cost-effectiveness analysis,
subpopulation-specific baseline HAQ-DI score 312
TABLE 204 Treatment effects from independent analysis for no concomitant
psoriasis, subpopulation 2: fully incremental cost-effectiveness analysis,
subpopulation-specific baseline HAQ-DI score 312
TABLE 205 Treatment effects from independent analysis for moderate–severe
psoriasis, subpopulation 3: fully incremental cost-effectiveness analysis,
subpopulation-specific baseline HAQ-DI score 312
TABLE 206 Treatment effects from independent analysis for mild–moderate
psoriasis, subpopulation 3: fully incremental cost-effectiveness analysis,
subpopulation-specific baseline HAQ-DI score 312
TABLE 207 Treatment effects from independent analysis for no concomitant
psoriasis, subpopulation 3: fully incremental cost-effectiveness analysis,
subpopulation-specific baseline HAQ-DI score 313
TABLE 208 Treatment effects from independent analysis for moderate–severe
psoriasis, subpopulation 2: fully incremental cost-effectiveness analysis, HAQ-DI
costs from Pooleet al. 313
TABLE 209 Treatment effects from independent analysis for mild–moderate
psoriasis, subpopulation 2: fully incremental cost-effectiveness analysis, HAQ-DI
costs from Pooleet al. 313
TABLE 210 Treatment effects from independent analysis for no concomitant
psoriasis, subpopulation 2: fully incremental cost-effectiveness analysis, HAQ-DI
costs from Pooleet al. 314
TABLE 211 Treatment effects from independent analysis for moderate–severe
psoriasis, subpopulation 3: fully incremental cost-effectiveness analysis, HAQ-DI
costs from Pooleet al. 314
TABLE 212 Treatment effects from independent analysis for mild–moderate
psoriasis, subpopulation 3: fully incremental cost-effectiveness analysis, HAQ-DI
costs from Pooleet al. 314
LIST OF TABLES
TABLE 213 Treatment effects from independent analysis for no concomitant psoriasis, subpopulation 3: fully incremental cost-effectiveness analysis, HAQ-DI
costs from Pooleet al. 314
TABLE 214 Treatment effects from independent analysis for moderate–severe
psoriasis, subpopulation 2: fully incremental cost-effectiveness analysis,
withdrawal scenario 1 315
TABLE 215 Treatment effects from independent analysis for mild–moderate
psoriasis, subpopulation 2: fully incremental cost-effectiveness analysis,
withdrawal scenario 1 315
TABLE 216 Treatment effects from independent analysis for no concomitant
psoriasis, subpopulation 2: fully incremental cost-effectiveness analysis,
withdrawal scenario 1 315
TABLE 217 Treatment effects from independent analysis for moderate–severe
psoriasis, subpopulation 3: fully incremental cost-effectiveness analysis,
withdrawal scenario 1 315
TABLE 218 Treatment effects from independent analysis for mild–moderate
psoriasis, subpopulation 3: fully incremental cost-effectiveness analysis,
withdrawal scenario 1 316
TABLE 219 Treatment effects from independent analysis for no concomitant
psoriasis, subpopulation 3: fully incremental cost-effectiveness analysis,
withdrawal scenario 1 316
TABLE 220 Treatment effects from independent analysis for moderate–severe
psoriasis, subpopulation 2: fully incremental cost-effectiveness analysis,
withdrawal scenario 2 316
TABLE 221 Treatment effects from independent analysis for mild–moderate
psoriasis, subpopulation 2: fully incremental cost-effectiveness analysis,
withdrawal scenario 2 316
TABLE 222 Treatment effects from independent analysis for no concomitant
psoriasis, subpopulation 2: fully incremental cost-effectiveness analysis,
withdrawal scenario 2 317
TABLE 223 Treatment effects from independent analysis for moderate–severe
psoriasis, subpopulation 3: fully incremental cost-effectiveness analysis,
withdrawal scenario 2 317
TABLE 224 Treatment effects from independent analysis for mild–moderate
psoriasis, subpopulation 3: fully incremental cost-effectiveness analysis,
withdrawal scenario 2 317
TABLE 225 Treatment effects from independent analysis for no concomitant
psoriasis, subpopulation 3: fully incremental cost-effectiveness analysis,
List of figures
FIGURE 1 Flow chart showing the number of studies identified and eligible
for inclusion 10
FIGURE 2 Forest plot of the efficacy of 300 mg of SEC vs. placebo for PASI 75 at
12 weeks in PsA patients with moderate–severe psoriasis 41
FIGURE 3 Long-term response rates in the FUTURE 2 trial SEC patients who were
(a) ACR 20, (b) ACR 50 or (c) ACR 70 responders at 16 weeks 53
FIGURE 4 Long-term response rates in the FUTURE 2 trial SEC patients who were
(a) PASI 50, (b) PASI 75 or (c) PASI 90 responders at 16 weeks 53
FIGURE 5 Long-term response rates in the RAPID-PsA trial CZP patients who
were (a) ACR 20, (b) ACR 50 or (c) ACR 70 responders at 12 weeks 56
FIGURE 6 Long-term response rates in the RAPID-PsA trial CZP patients who
were (a) PASI 50, (b) PASI 75 or (c) PASI 90 responders at 12 weeks 56
FIGURE 7 Network of evidence (not outcome or subgroup specific) 76
FIGURE 8 Schematic of the York model 107
FIGURE 9 Illustration of the progression of arthritis for a patient successfully
maintained on a biologic, a patient without a biologic and a patient who
withdraws at 5 years, as implemented in the York model 110
FIGURE 10 Overview of the UCB Pharma model structure 116
FIGURE 11 Overview of the Novartis model structure 117
FIGURE 12 Illustration of HAQ-DI score change for patients responding to a
biologic treatment in the UCB Pharma model 118
FIGURE 13 Interventions and comparators according to subpopulations
(UCB Pharma) 120
FIGURE 14 Interventions and comparators according to subpopulations (Novartis) 120
FIGURE 15 Overview of the model structure 137
FIGURE 16 Treatment sequences in subpopulation 1 141
FIGURE 17 Treatment sequences in subpopulation 2 142
FIGURE 18 Treatment sequences in subpopulation 3 142
FIGURE 20 Range of values and distributions for PASI 75 response for
the treatments 169
FIGURE 21 The PsARC response in the biologic-naive subpopulation: plot of
trial-specific observed log-odds of placebo responses and ORs on log-scale
(all 13 trials) 227
FIGURE 22 The PsARC response in the biologic-naive subpopulation: plot of
trial-specific observed log-odds of placebo responses and ORs on log-scale
(excluding Measeet al.and Genoveseet al.) 228
LIST OF FIGURES
Glossary
Adverse effect An abnormal or harmful effect, such as death, a physical symptom or visible illness,
caused by, and attributable to, exposure to a chemical (e.g. a drug). An effect may be classed as adverse if it causes functional or anatomical damage or irreversible change in the homeostasis of the organism, or if it increases the susceptibility of the organism to another chemical or biological stress.
American College of Rheumatology improvement criteria Measures of the improvement in disease
severity based on threshold percentage improvements of 20%, 50% or 70%. To meet the criteria, a reduction in the tender joint count and swollen joint count and an improvement in at least three out of the five additional measures (patient and physician global health assessment, pain, disability and levels of an acute-phase reactant) are required.
Anti-tumour necrosis factor/biologic experienced Previously treated with a biologic therapy.
Anti-tumour necrosis factor/biologic naive Not previously treated with a biologic therapy.
Apremilast An orally administered small-molecule drug that inhibits an enzyme involved in tumour
necrosis factor production. Apremilast (Otezla®, Celgene Corporation, Summit, NJ, USA) is not a
biologic therapy.
Arthritis A disorder involving inflammation of the joint(s), but which is often taken to include all joint
disorders. Joints can be permanently damaged through the disease process of arthritis.
Articular Of or relating to joints.
Between-study variance A measure of statistical heterogeneity that depends on the scale of the
outcome measured. It represents the variation in reported study effects over and above the variation expected given the within-study variation.
Biological therapy (biologic) Any pharmaceutical product derived from biological sources. Biologics used
in the treatment of psoriatic arthritis treatment are generally monoclonal antibodies that bind to, and
inactivate, immune cell-signalling molecules (e.g. tumour necrosis factor and interleukins), thereby dampening the inflammatory response.
Biosimilar An imitation biological medical product (such as an anti-tumour necrosis factor) usually
marketed by a manufacturer other than the manufacturer of the original biological product once a patent has expired. It should be similar to the original licensed product in terms of safety and efficacy.
C-reactive protein A protein found in the blood, the concentration of which is a raised by inflammation,
for example in rheumatoid arthritis, and the level of which is used as a measure of disease activity.
Ciclosporin A medication originally developed to prevent the immune system from rejecting transplanted
organs but which has also proved helpful in treating psoriasis.
Confidence interval The typical (‘classical’or‘frequentist’) definition is the range within which the‘true’
Cost–benefit analysis An economic analysis that converts the effects or consequences of interventions into the same monetary terms as the costs and compares them using a measure of net benefit or a cost–benefit ratio.
Cost-effectiveness analysis An economic analysis that expresses the effects or consequences of
interventions on a single dimension. This would normally be expressed in‘natural’units (e.g. cases cured, life-years gained). The difference between interventions in terms of costs and effects is typically expressed as an incremental cost-effectiveness ratio (e.g. the incremental cost per life-year gained).
Cost–utility analysis The same as a cost-effectiveness analysis, but the effects or consequences of
interventions are expressed in generic units of health gain, usually quality-adjusted life-years.
Credible interval In Bayesian statistics, a posterior probability interval estimation that incorporates
problem-specific contextual information from the prior distribution. It is used for a purpose similar to that of a confidence interval in frequentist statistics.
Crohn’s disease An inflammatory condition of the digestive tract; rheumatic diseases are often associated
with it and ulcerative colitis is related to it.
Dactylitis Inflammation of an entire digit caused by simultaneous joint and tendon inflammation.
Deviance information criterion A model fit statistic and used for Bayesian model comparison. The
model with the smallest deviance information criterion is estimated to be the model that would best predict a replicate data set that has the same structure as that currently observed.
Disease-modifying antirheumatic drugs Drugs capable of modifying the progression of rheumatic
disease. The term is, however, applied to what are now considered to be traditional (or conventional) disease-modifying drugs, in particular sulfasalazine, methotrexate and ciclosporin, as well as azathioprine, cyclophosphamide, antimalarials, penicillamine and gold. The newer agent leflunomide is also a disease-modifying antirheumatic drug. Biologics are not generally referred to as disease-disease-modifying antirheumatic drugs, although occasionally biological disease-modifying antirheumatic drugs may be used.
Dominated A term, used in this report in the cost-effectiveness sections, that describes a treatment
associated with higher costs and a lower number of quality-adjusted life-years than another treatment.
Enthesitis Inflammation of the region where tendons and ligaments attach to the bone (enthesis).
Erythrocyte sedimentation rate One of the tests designed to measure the degree of inflammation.
EuroQol-5 Dimensions questionnaire A standardised instrument for measuring generic health-related
quality of life, used in the computation of the number of quality-adjusted life-years gained.
Extendedly dominated A term, used in this report in the cost-effectiveness sections, to describe a
strategy in which the incremental cost-effectiveness ratio is higher than that of the next most effective strategy. Therefore, an extendedly dominated strategy produces additional gains in effectiveness at incremental costs higher than those of the next most effective strategy.
Fixed-effect model A statistical model that stipulates that the units under analysis (e.g. people in a trial
or study in a meta-analysis) are the ones of interest, and thus constitute the entire population of units. Only within-study variation is taken to influence the uncertainty of results (as reflected in the confidence interval) of a meta-analysis using a fixed-effect model.
GLOSSARY
Health Assessment Questionnaire-Disability Index A self-administered questionnaire measuring an individual’s physical disability and pain. It scores ability to perform various activities between 0 (without any difficulty) and 3 (unable to do). It is reported as an average of all activity scores.
Heterogeneity In systematic reviews, the variability or differences between studies in the estimates of
effects. A distinction is sometimes made between‘statistical heterogeneity’(differences in the reported effects),‘methodological heterogeneity’(differences in study design) and‘clinical heterogeneity’
(differences between studies in key characteristics of the participants, interventions or outcome measures).
Intention-to-treat analysis An analysis in which all the participants in a trial are analysed according to
the intervention to which they were allocated, whether they received it or not.
Leeds Dactylitis Index A measure of swelling between digital joints. A dactylometer is used to measure
the circumference of an affected digit, and the contralateral unaffected digit, and the ratio of the
circumferences is calculated. If both hands are affected, a standard reference is used to calculate the ratio. A difference in circumference of≥10% defines a finger with dactylitis. The tenderness of each digit is also taken into account to generate a score for each. If multiple digits are affected, the scores for each are added together.
Leeds Enthesitis Index A measure of tenderness over six tendon attachment sites (enthuses). It also
includes an assessment for soft tissue swelling. It is scored from 0 to 6.
Methotrexate One of the oldest chemotherapy drugs used in the treatment of cancer and autoimmune
diseases, such as rheumatoid and psoriatic arthritis.
Modified total Sharp score One of several radiological assessments used to measure joint damage in
psoriatic arthritis. This method grades all joints of the hand separately for erosions and joint space narrowing for 64 and 52 joints (out of a maximum score of 149), respectively, with higher scores representing greater damage. The total Sharp score is modified to include other joints in the assessment.
Monoclonal antibody An antibody produced using a single clone of cells with affinity for one
particular antigen.
Network meta-analysis (Synonyms: mixed treatment comparison, indirect treatment comparison.)
Used when there is insufficient direct evidence linking two interventions, this is a type of meta-analysis comparing three or more different treatments using both direct comparison within randomised controlled trials and indirect comparison between trials based on a common comparator (such as placebo).
Non-steroidal anti-inflammatory drug Any of a large range of drugs in the aspirin family, prescribed
for different kinds of arthritis, that reduces inflammation and controls pain, swelling and stiffness.
Placebo An inactive substance or procedure administered to a patient, usually to compare its effects with
those of a real drug or other intervention, but sometimes for the psychological benefit to the patient through a belief that she/he is receiving treatment.
Plaque psoriasis The most common form of psoriasis, also known as psoriasis vulgaris, characterised by
red, raised lesions covered by silvery scales. About 80% of patients with psoriasis have this type.
Psoriasis A chronic skin disease characterised by inflammation and scaling. Scaling occurs when cells in
Psoriasis Area and Severity Index A measure of the extent of skin affected and of the redness, scaliness and thickness of psoriatic plaques. Response is presented as PASI 50, PASI 75 or PASI 90, the number being the percentage reduction in Psoriasis Area and Severity Index score from baseline.
Psoriatic arthritis A disease characterised by stiffness, pain and swelling in the joints, especially of the
hands and feet. It affects about 30% of people with psoriasis. Early diagnosis and treatment can help inhibit the progression of joint deterioration.
Psoriatic Arthritis Response Criteria response An improvement of at least 30% in the tender or
swollen joint count as well as a 1-point improvement on a 5-point scale of the patient’s and/or physician’s assessment. The National Institute for Health and Care Excellence defines a response as an improvement in two or more of the four assessment criteria (with no worsening of any of these four measures).
Quality-adjusted life-year An index of health gain according to which survival duration is weighted or
adjusted by the patient’s quality of life during the survival period. It has the advantage of incorporating changes in both quantity (mortality) and quality (morbidity) of life.
Quality of life A concept incorporating all the factors that might have an impact on an individual’s life,
including factors such as the absence of disease or infirmity as well as other factors that might affect that individual’s physical, mental and social well-being.
Random-effects model A statistical model sometimes used in meta-analysis in which both within-study
sampling error (variance) and between-studies variation are included in the assessment of the uncertainty (confidence interval) of the results of a meta-analysis.
Randomised controlled trial (Synonym: randomised clinical trial.) An experiment in which investigators
randomly allocate eligible people to intervention groups to receive or not receive one or more interventions that are being compared.
Relative risk (Synonym: risk ratio.) The ratio of risk in the intervention group to the risk in the control
group. The risk (proportion, probability or rate) is the ratio of people with an event in a group to the total number in the group. A relative risk of 1 indicates no difference between comparison groups. In the case of undesirable outcomes, a relative risk of<1 indicates that the intervention was effective in reducing the
risk of that outcome.
Remission A lessening or abatement of the symptoms of a disease.
Residual deviance An analysis used for model comparison and goodness of fit. It is equal to the deviance
for a given model minus the deviance for a saturated model. A saturated model is one in which all of the predictions from the model are equal to the observed data values. Total residual deviance should
approximate the number of data points for a good fit.
Rheumatoid arthritis A chronic autoimmune disease characterised by pain, stiffness, inflammation,
swelling, and, sometimes, destruction of joints.
Sensitivity analysis An analysis used to determine how sensitive the results of a study or systematic
review are to changes in how it was done. It is used to assess how robust the results are to uncertain decisions or assumptions about the data and the methods that were used.
Short Form questionnaire-36 items A patient-reported survey of general health status.
Statistical significance An estimate of the probability of an association (effect) as large as or larger than
what is observed in a study occurring by chance, usually expressed as ap-value.
GLOSSARY
Subpopulation 1 Patients who are biologic naive but have tried one previous conventional disease-modifying antirheumatic drug.
Subpopulation 2 Patients who are biologic naive but have tried two or more previous conventional
disease-modifying antirheumatic drugs.
Subpopulation 3 Patients who are biologic experienced.
Tender joint count and swollen joint count Assessment of the condition of 28 joints important to
functional status. Used in the calculation of several composite disease activity scores such as Disease Activity Score 28.
Tumour necrosis factor alpha A cell signalling molecule (cytokine) involved in the inflammatory
List of abbreviations
ACR American College of Rheumatology
ACR 20 20% improvement in the American
College of Rheumatology criteria
ACR 50 50% improvement in the American
College of Rheumatology criteria
ACR 70 70% improvement in the American
College of Rheumatology criteria
ADA adalimumab
ADEPT ADalimumab Effectiveness in
Psoriatic arthritis Trial
AE adverse event
AG Assessment Group
APR apremilast
BNF British National Formulary
BSA body surface area
BSC best supportive care
BSR British Society for Rheumatology
BSRBR British Society for Rheumatology
Biologics Register
CASPAR Classification Criteria for Psoriatic Arthritis
cDMARD conventional disease-modifying
antirheumatic drug
CDSR Cochrane Database of Systematic
Reviews
CENTRAL Cochrane Central Register of
Controlled Trials
CI confidence interval
CLEAR Efficacy of Secukinumab Compared
to Ustekinumab in Patients with Plaque-type Psoriasis
CPCI-S Conference Proceedings Citation
Index–Science
CrI credible interval
CRP C-reactive protein
CS company submission
CZP certolizumab pegol
DA deterministic analysis
DANBIO Danish Database for Biological
Therapies
DARE Database of Abstracts of Reviews
of Effects
DIC deviance information criterion
DMARD disease-modifying antirheumatic
drug
EQ-5D EuroQol-5 Dimensions
ERASURE Efficacy of Response and Safety of
Two Fixed Secukinumab Regimens in Psoriasis
ERG Evidence Review Group
ESR erythrocyte sedimentation rate
ETN etanercept
EULAR European League Against
Rheumatism
FIXTURE Full Year Investigative Examination of Secukinumab vs. Etanercept Using Two Dosing Regimens to Determine Efficacy in Psoriasis
FUTURE Efficacy at 24 Weeks and Long
Term Safety, Tolerability and Efficacy up to 2 Years of
Secukinumab (AIN457) in Patients With Active Psoriatic Arthritis
GO-REVEAL Golimumab–A Randomized
Evaluation of Safety and Efficacy in Subjects with Psoriatic Arthritis Using a Human Anti-TNF Monoclonal Antibody
GOL golimumab
GP general practitioner
HAQ-DI Health Assessment