This is a repository copy of
Efficient, non-stochastic, Monte-Carlo-like-accurate method for
the calculation of the temperature-dependent mobility in nanocrystal films
.
White Rose Research Online URL for this paper:
http://eprints.whiterose.ac.uk/131329/
Version: Accepted Version
Article:
Gómez-Campos, FM, Rodríguez-Bolívar, S, Skibinsky-Gitlin, ES et al. (1 more author)
(2018) Efficient, non-stochastic, Monte-Carlo-like-accurate method for the calculation of
the temperature-dependent mobility in nanocrystal films. Nanoscale, 10 (20). pp.
9679-9690. ISSN 2040-3364
https://doi.org/10.1039/c8nr00227d
© 2018, The Royal Society of Chemistry. This is an author produced version of a paper
published in Nanoscale. Uploaded in accordance with the publisher's self-archiving policy.
[email protected]
https://eprints.whiterose.ac.uk/
Reuse
Items deposited in White Rose Research Online are protected by copyright, with all rights reserved unless
indicated otherwise. They may be downloaded and/or printed for private study, or other acts as permitted by
national copyright laws. The publisher or other rights holders may allow further reproduction and re-use of
the full text version. This is indicated by the licence information on the White Rose Research Online record
for the item.
Takedown
If you consider content in White Rose Research Online to be in breach of UK law, please notify us by
Efficient, non-stochastic, Monte-Carlo-like-accurate
method for the calculation of the
temperature-dependent mobility in nanocrystal films
†
Francisco M. Gómez-Campos,a,b Salvador Rodríguez-Bolívar,a,b Erik S. Skibinsky-Gitlin,aand Marco Califano,∗c
We present a new non-stochastic framework for the calculation of the temperature dependence of the mobility in nanocrystal films, that enables speed-ups of several orders of magnitude com-pared to conventional Monte Carlo approaches, while maintaining a similar accuracy. Our model identifies a new contribution to the reduction of the mobility with increasing temperature in these systems (conventionally attributed to interactions with phonons), that alone is sufficient to explain the observed experimental trend up to room temperature. Comparison of our results with the theoretical predictions of the hopping model and the observed temperature dependence of recent field-effect mobility measurements in nanocrystal films, provides the means to discriminate be-tween band-like and hopping transport and a definitive answer to whether the former has been achieved in quantum dot films.
Transport, mobility, nanocrystal films, colloidal quantum dot su-perlattices, pseudopotential method, temperature
1
Introduction
Continuing advances in synthetic methods yielding nearly monodisperse semiconductor nanocrystals, with uniform shape and composition1,2, coupled with the ability to tailor the length of their capping agents (enabling interparticle separations from as small as 0.3 nm2, down to virtually zero after annealing3,5), are paving the way to the creation of quantum dot superlat-tices with long-range order on the micrometre scale1,2. Such strongly coupled quantum dot films exhibit very high field-effect mobilities5,6, whose observed increase with decreasing temper-ature has been interpreted as indication of band-like transport through extended states. However, as it was recently pointed
out7, a similar temperature dependence may also be
exhib-ited by hopping transport, in a specific temperature range, and should therefore not be considered as incontrovertible evidence of band-like conduction. Indeed the mobility in the hopping regime is expected to depend on temperature exponentially, ac-cording to either (1/T)exp(−Ea/kBT) (Einstein’s relation)7 or to(1/√T)exp(−Eb/kBT) (Marcus’ theory)8 (whereEa and Eb
aDepartamento de Electrónica y Tecnología de Computadores, Facultad de Ciencias, Universidad de Granada, 18071 Granada, Spain.
bCITIC-UGR, C/ Periodista Rafael Gómez Montero, n 2, Granada, Spain.
cPollard Institute, School of Electronic and Electrical Engineering, University of Leeds, Leeds LS2 9JT, United Kingdom. E-mail: [email protected]
†Electronic Supplementary Information (ESI) available: [Smoothing procedure
to remove fluctuations in the mobility caused by the finite discretization of theQ space]. See DOI: 10.1039/b000000x/
are some characteristic energies), whereas different expressions (µ ∝1/Txwithxinteger or fractional), derived from simple
mod-els, have been proposed for its temperature dependence in band-like transport5,11. An accurate theoretical determination of the temperature dependence of the mobility would provide the ability to discriminate between the two mechanisms at room tempera-ture, where they may both exhibit a negativedµ/dT, and a
defini-tive answer to whether band-like transport has been achieved in quantum dot films.
This is what we aim to do here: We develop a new theoret-ical framework to calculate the temperature-dependent electron mobility in a semiconductor nanocrystal film (2D quantum dot superlattice), which approximates the accuracy of a full Monte Carlo calculation, at a much reduced computational cost. Our model combines an atomistic semiempirical pseudopotential ap-proach9, to obtain the wave functions for the isolated quantum dot, and a tight-binding formalism to solve the Schrödinger equa-tion for the array10. Mobility is assumed to be limited by quan-tum dot size variations11. Starting from a suitably simplified Monte Carlo formulation of the problem, we derive expressions for the temperature-dependent electron mobilities in a quantum dot superlattice, which relate average velocities with the applied electric field. Our algorithm replaces the stochastic carrier flight times used in the Monte Carlo approach with their average. Their numerical fluctuations, unavoidable when using a finite sampling of the q-space, are then cleverly reduced by introducing a frac-tional occupancy function, based on accurate estimates for the miniband density of states. The use of Markov’s chain framework further simplifies the description and the computational complex-ity of the whole dynamical process. Finally, the introduction of
phonons allows the system to thermalize and provides a temper-ature dependence for the calculated mobility.
2
Theoretical method
Possible sources of scattering in nanocrystal films include struc-tural disorder and interactions with phonons. According to a re-cently proposed theoretical expression for the mobility in quan-tum dot solids due to dark- and photo-conductivity11, we assume that the former (fluctuations in the quantum dot sizes) represent the limiting mechanism for conduction. Phonon scattering is also present in the system, but its impact on the mobility is considered negligible11, i.e.,
1/µT=1/µphonons+1/µsize variation≈1/µsize variation (1)
although its presence guarantees thermalisation. Indeed, despite recent findings12of a strong electron-phonon interaction inbulk polar semiconductors, electron-phonon coupling is expected to be strongly suppressed in 0D systems. In particular, in CdSe nanocrystals the Huang-Rhys parameter has been predicted13–15 to be over 2 orders of magnitude smaller than in the bulk for both optical and acoustic modes.
Detailed expressions for phonon scattering rates in a quantum dot superlattice can be very difficult to obtain, because of the complex atomic distribution in the system. In our approach, how-ever, such expressions are not required, as the interaction with phonons is captured through Fermi-Dirac’s statistics, which the electron gas in the superlattice must obey because it is in thermo-dynamical equilibrium with the phonon’s reservoir.
In a quantum dot superlattice under the drift effect of low elec-tric fields (close to equilibrium conditions), in which size varia-tion is the limiting mechanism for the mobility, the carrier stories include loops of series of a large number of slightly-drifted car-rier flights, interrupted by energy-conserving (mobility-limiting) size variation scatterings, followed by temperature-dependent, energy-non-conserving (system-thermalising) phonon scattering events (in a negligible number compared to those due to the first mechanism). This scenario can be modelled using Monte Carlo simulations, which are ideally suited to study transport proper-ties in semiconductors of any dimensionality16–18. Our approach, however, avoids the computationally expensive implementation of a full Monte Carlo algorithm by resorting to a non-stochastic simplification based on averaged quantities, which, nevertheless, allows it to retain the relevant physical description of the prob-lem.
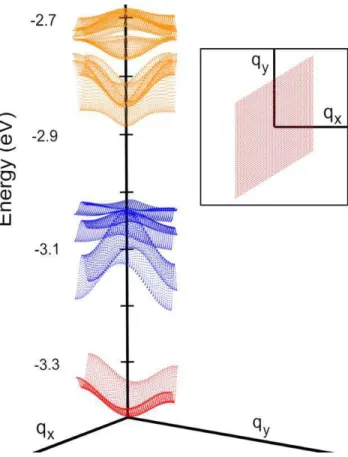
The miniband structure of the periodic system (Fig. 1) is ob-tained by solving the Schrödinger equation on a (51×51) grid
discretization19of the Brillouin zone of the quantum dot super-lattice within a tight-binding approach, where the wave functions of the periodic system are expanded in a basis of individual quan-tum dot conduction band eigenstates, obtained within the atom-istic semiempirical pseudopotential framework10. Although we calculate up to 9 minibands (Fig. 1), the results presented here will focus on the mobility of the lowest energy miniband only.
The fact that size-variation scattering is an energy-conserving
Fig. 1 Miniband structure for the lowest conduction band states in an
hexagonal periodic structure of wurtzite CdSe quantum dots with radius 1.84 nm separated by a bond length. The inset shows the Brillouin zone in reciprocal space. The energies are referred to the vacuum level.
process implies that, within the miniband, there are sets of same-energy, mutually accessible states when only this mechanism is considered. In order to define such same-energy electron states we divided the miniband into a set of 100 equally-spaced en-ergy intervals. With the typical miniband widths obtained in this study, the width of each resulting energy interval is about 1 meV. We assumed all the states within each energy interval to be mutually accessible after size-variation scattering events, and computed the respective mobility tensor (see below). In a sec-ond step the phonon thermalizing role was included by adding a weighting of the calculated mobility tensors by the thermal car-rier population given by Fermi-Dirac’s statistics, which finally led to a temperature-dependent expression for the mobility.
2.1 Mobility in an energy interval
The wave vector evolution~q(t)is obtained from the set of
mini-band states in a particular energy interval using a semiclassical model:
~q(t) =~qi−e
¯h
~
Et (2)
where~qi is the initial wave vector,eis the absolute value of the electron charge,¯his the reduced Planck constant,~Eis the applied
electric field, andtis the flight time. In a Monte Carlo
descrip-tion,twould be a stochastic quantity that can be obtained from
Golden Rule. These size-variation scattering ratesΓi
→f, from an initial stateito a final state f, are given by the following
expres-sion10:
Γi →f=
γ Qst 2π ¯h 1 ∆E 1 p
K~qiK~qf
¯ ¯ ¯ ¯ ¯
∑
m,sb∗m,~qfbs,~qi
Z
φ∗
m(~r)∆V(~r)φs(~r)d~r ¯ ¯ ¯ ¯ ¯ 2 (3) whereγis the percentage of ’defect’ (i.e., differently-sized) quan-tum dots in the superlattice,Qst is the number of states in the Brillouin zone (51×51in this study),∆E is the width of the
en-ergy interval (∼1 meV, here), φn(~r) is the n-th wave function of the isolated quantum dot used in the tight-binding expansion for the periodic system (depending on their energy spread in our calculations we used from 9 to 11 single quantum dot wave func-tions),bn,~qis the coefficient multiplying the n-th state of the tight-binding expansion relative to a particular value for~q,K~q is the normalization constant of the periodic system wave function hav-ing wave vector~q,~qiand~qf are the wave vectors before (i) and
after (f) the scattering, respectively, and∆V(~r) is the
perturba-tion, i.e., the difference between the potentials of a ’normal-sized’ quantum dot and a ’defect’ quantum dot, which has an atomistic character in this study.
The new method presented in this paper (which is applicable to semiconductors of any dymensionality)21, unlike Monte Carlo algorithms, assumes that the stochastic flight time can be substi-tuted by the average flight time, which is the inverse of the sum-mation of all the scattering probabilities to reach all the states in the same interval21. As a consequence:
~qfin,i=~qi−
e
¯h
~
E 1
∑fΓi→f
(4)
where~qfin,iis the final wave vector for the flight started from state qi. The carrier velocity after the flight,~v(~qfin,i), can be computed
in a semiclassical fashion, i.e.
~v(~qfin,i) = 1
¯h∇ε
¯ ¯ ¯ ¯~q
fin,i
, (5)
which involves the evaluation of the miniband energy gradient at
~qfin,i.
In a Monte Carlo description, each scattering process due to structural disorder has the probability
Pi→f=
Γi →f
∑f′Γi→f′ (6)
to take the system from an initial stateito a particular final state fwithin the same energy interval. Then a new flight starts withf
as the initial state. This procedure is repeated a large number of times, allowing the history of the carrier to be tracked within that specific energy interval, from which, in turn, the displacement, the average velocity and the mobility tensor can be obtained.
The present model tries to mimic the Monte Carlo method, us-ing, however, a much more computationally efficient technique. Assuming the fractionspi=Ni/NT to be known (whereNiis the number of flights starting from stateiandNT is the total number of flights simulated in a Monte Carlo calculation - usually a very
large number), the carrier displacement within an energy interval can be estimated as
~r=
nint
∑
i=1
piNT×~v(~qfin,i)
∑fΓi→f
(7)
(where we implicitly assumed the drift to be a constant-velocity flight), and the total time of the simulationtsimis simply the sum of all the flight times:
tsim=
nint
∑
i=1
piNT ∑fΓi→f
. (8)
The average velocity can therefore be obtained by dividing (7) by (8)
h~vi=∑
nint
i=1
pi×~v(~qfin,i) ∑fΓi→f
∑nint
i=1 pi ∑fΓi→f
(9)
Our model differentiates itself from the cumbersome Monte Carlo approach by resorting to Markov’s theory formalism20 for the computation of the unknown fractions pi. Indeed, the
scat-tering process considered here is an example of Markov chain20. Thenint×nint transition probability matrix between all states is
constructed starting from the knownPi→f(6).
In the spirit of Markov’s formalism we calculated the 104th power of such a matrix (equivalent to computing the probabil-ity after 104transitions) obtaining the probabilities p
iof starting flights from each of thenint states. The result of this procedure
is that, after such a large number of transitions, all the matrix’s columns are the same, so that the memory of the state from which the first flight started is lost, and the probability is independent of the initial state. This enables a 4-orders-of-magnitude speedup compared to conventional Monte Carlo methods, making it possi-ble to run a full calculation in less than 12 hours on a single CPU, and a considerable improvement in the dispersion of our results (which is reduced by a factor of1/√N, whereNis the number of
scattering events).
For a given applied field, the mobility could then be obtained fromh~vi=µˆ~E. However, in order to obtain the four components
of the mobility tensorµˆ in the planar periodic system for any
par-ticular energy interval in the miniband, two separate calculations are needed, each with the electric field pointing along a different direction.
As the negative charge of the electron causes the velocity to be opposite to the applied electric field, the mobilities should be negative. However, for the sake of clarity, and when indicated, we sometimes show their absolute value in the figures.
2.2 Total mobility
The total mobility tensor is obtained as a combination of the mo-bility tensorsµˆncalculated for each energy intervaln(containing nint,nstates), weighted by the respective thermal population dis-tribution fn(T , EF)
ˆ
µ(T) =∑
100
n=1µˆnfn(T , EF)nint,n
∑100
n=1fn(T , EF)nint,n
(the summation limit corresponds to the number of constant-energy intervals in which the miniband has been divided). As the tensor (10) is not necessarily diagonal, we present the eigen-valuesµ1andµ2obtained by diagonalising it.
2.3 Sources of numerical noise
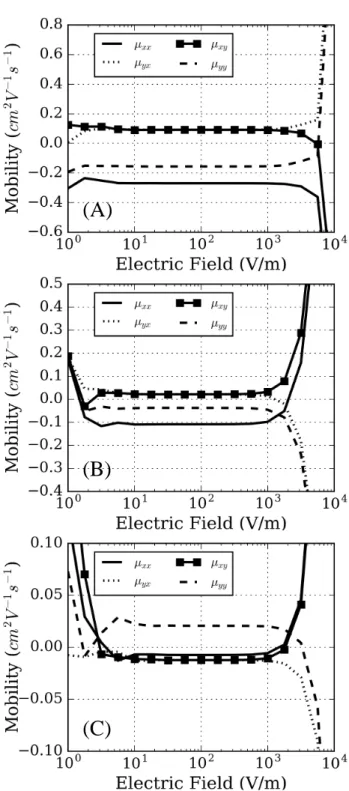
Before carrying out any calculation, however, it is necessary to determine a range of suitable values for the electric field, the de-pendence on which is contained in (5). Indeed, a value too low would drift the initial state to another state too similar to it, lead-ing to numerical noise in the algorithm, whereas a value too high, apart from being inconsistent with the assumed conditions of near equilibrium for the system, would drift the initial state out of the energy interval to which it belongs. We performed a set of calcula-tions for a 2D hexagonal periodic array of wurtzite CdSe quantum dots with radius 1.84 nm (the same system considered in section 3.A below), separated by a bond length, applying electric fields of different strengths along two perpendicular directions (xand y). The mobility tensor components calculated in three different
energy intervals (1, 25 and 50) out of the set of 100 considered are presented in Fig. 2. One should not try to associate a specific significance to the different componentsµi j separately: it is the result of the tensor diagonalization - the eigenvalues and eigen-vectors - that is meaningful. The important point here is that this tensor should not depend on the applied field. The electric fields for which the different components are constant (10-1000 V/m) represent suitable values: we chooseE=100V/m for all our
cal-culations.
A further source of numerical noise in the results may be rep-resented by our choice of Brillouin zone discretization (51×51),
owing to the resulting different number of states in each interval. Such fluctuations could be reduced by reducing the number of in-tervals in which the miniband width is divided, but this strategy would lead to a relaxation of the energy conservation condition, and is therefore not a desirable solution. Another option could be to use a denser discretization of the reciprocal space, but this would result in an increased computational complexity, due to the increased number of transitions involved. The fluctuations are es-pecially relevant in calculations at low temperatures when only the lowest energy intervals are populated and stem from the poor approximation for the actual density of states (i.e., that obtained with an infinitely dense discretization of the reciprocal space) ob-tained with our coarse sampling of the Brillouin zone. Taking into account the miniband 180 degree symmetry, the51×51
dis-cretization used here produces an even number of states in each interval which includes pairs of symmetrical q states (i.e.,~qand
−~q, the exception being the lowest energy interval containing the Γ point~q=0). This choice, while ensuring that the correct q
states are assigned to each energy interval (i.e., that if~qbelongs
to a particular interval, then−~q, which has the same energy, is
also correctly included in the same interval), also leads to differ-ences in the occupation numbers of neighbouring intervals which are multiples of 2. Such differences cause abrupt variations in the flight times calculated for these intervals, because in our model they depend on the occupation number of each interval (if, e.g.,
(A)
(B)
(C)
Fig. 2 Mobility tensor components calculated for the energy intervals 1
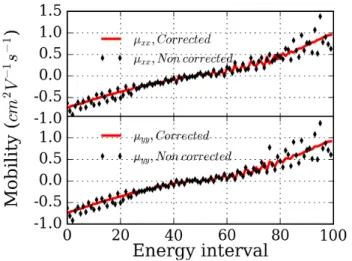
Fig. 3 Comparison between as-calculated (black symbols) and
cor-rected (red line) mobility tensor componentsµxxandµyyfor each energy
interval in a square periodic structure of zincblende CdSe quantum dots with radius 1.84 nm separated by a bond length. Fluctuations are no-ticeably reduced when using fractional number of states in the energy intervals (see text).
intervalicontains 10 states and intervali+1contains 12 states,
the 20% difference in their occupation numbers leads to a 20% difference in the respective flight times, which, in turn, yields a similar variation in the calculated mobilities). Furthermore, dif-ferent discretizations may also yield noticeably difdif-ferent numbers of states in neighbouring intervals, leading to significant flight time fluctuations between them and, as a result, to considerable fluctuations in their mobilities. In order to correct for this effect we calculated the miniband structure by solving the Schrödinger equation for500×500 q-points (instead of the51×51
discretiza-tion inq-space used so far), obtaining the density of states in each
of the 100 energy intervals. This more accurate estimate was then used to assign a fractional number of states to each energy in-terval of the51×51discretization22, leading to low-fluctuation
flight times (see Supporting Information)†.
An example of this smoothing is shown in Fig. 3: The non-corrected mobility tensor components (black symbols) exhibit sig-nificant fluctuations in the highest energy intervals as well as in the three lowest ones, which are particularly relevant in the cal-culations at low temperature. The red curve shows how using fractional numbers of states derived from a500discretization
cor-rects the flight times adequately and, as a consequence, removes most of the fluctuations from the calculated mobility tensor.
2.4 Influence of the Fermi level position
The position of the Fermi level also influences the mobility, through Fermi-Dirac’s statistics (10). We investigated the effect of three different values forEF: (i) at the minimum of the mini-band, (ii) 100 meV below it, and (iii) 100 meV above it. The latter value was used just as test for the algorithm, because at that en-ergy the additional effects of Pauli’s exclusion principle need to be taken into account to obtain accurate mobility estimates.
The results are presented in Fig. 4(A): Both mobility eigenval-ues increase with decreasing Fermi energies, for every value of
(B)
(C)
(A)
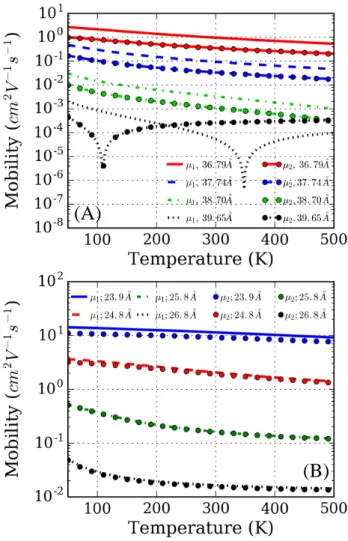
Fig. 4 Mobility eigenvalues vs temperature in an hexagonal periodic
structure of wurtzite CdSe quantum dots with radius 1.84 nm separated by a bond length, calculated for different values of the Fermi energy level referred to the miniband minimum:+100meV,0meV,−100meV (A) and <−100meV (B, C).
the temperature. We find, however, (Fig. 4(B)) that the mobil-ities become independent of the position of the Fermi level for
EF<EBandMin−100meV. This result is not surprising considering
that, for Fermi energies well below the miniband, Dirac’s statis-tics in (10) becomes similar to Boltzmann’s. In all the following calculations the Fermi level was therefore placed about 1.5 eV belowEBandMin(i.e., 5 eV below the vacuum level), in the CdSe
bandgap.
3
Results and Discussion
3.1 Wurtzite CdSe dots withR=1.84nm
In this section we study the mobility dependence on tempera-ture and dot-to-dot separation in 2D hexagonal periodic arrays of CdSe nanocrystals with R=1.84nm and a wurtzite crystal
(B)
(A)
Fig. 5 Absolute value of mobility eigenvalues (µ1andµ2) calculated for 2D hexagonal periodic arrangements of wurtzite CdSe nanocrystals with
R=1.84nm (A) andR=1.26nm (B) with dot-to-dot separations from 1 to 2 bond lengths.
about 2 bond lengths23 (0.26 to 0.52 nm), which are within a range achievable experimentally5. The results for the absolute value of the mobility eigenvalues, presented in Fig. 5(A), show a decreasing behaviour with increasing temperature and separa-tion, in qualitative agreement with experiment5,6. The latter is found to be exponential and reflects the dependence exhibited by the calculated wave function overlaps (i.e., coupling) between neighbouring dots24,25: Increasing the separation by 3 Å reduces the mobility by three orders of magnitude. This large reduction is due to the fact that our model assumes the dots to be sur-rounded by vacuum. In a more realistic scenario, the presence of ligands would provide some coupling between the wave func-tions in neighbouring dots, mitigating the overlap reduction. We can therefore consider our results as a lower limit for the mobili-ties in these systems.
Interestingly both mobility eigenvalues exhibit a very different temperature dependence for a separation of 3.95 nm. We men-tioned before that the mobility of the electron, due to the sign of its charge, should be negative. When the mobility changes sign and becomes positive, it must therefore relate to a posi-tive charge carrier - the hole. We find that the mobility due to
quantum dot size variations is electron-like around the miniband minimum and hole-like around the miniband maximum. At low temperatures the mobility is mainly determined by its behaviour at the miniband minimum. Increasing the temperature increases the contribution of higher energy intervals, leading, as a result, to a reduction of the total mobility. This constitutes an entirely new interpretation of the observed decrease in mobility with increas-ing temperature, conventionally attributed to carrier interactions with phonons, and here explained instead in terms of a purely energy-conserving mechanism. This reduction may eventually lead to a zero mobility, which means that hole-like transport bal-ances electron-like transport. If hole-like transport dominates, the mobility changes sign and electrons in the miniband show hole-like mobility for the whole ensemble. This explains the observed behaviour aroundT=110K and 350 K for the largest quantum
dot separation. At temperatures higher than 350 K [110 K]µ1 [µ2] is hole-like, and at lower temperatures electron-like, where it exhibits the same behaviour observed, in the whole range of tem-peratures, for all other quantum dot separations. The occurrence of this kind of behaviour makes it impossible to fit the mobility vs separation curves using a decreasing exponential function.
For smaller separations, we fitted the dependence onT of the
absolute value of the mobility eigenvalues to the following ex-pression:
µ(T) = 1
(αT+β)n. (11)
The best fit (R2=0.9997) was obtained forn=2. The resulting
values forα andβ are shown in 1. As each simulation provides two mobility eigenvalues, two fitted values for both parameters are presented.
3.2 Wurtzite CdSe withR=1.26nm
We also studied electron transport when the 2D periodic structure
is built from smaller quantum dots withR=1.26 nm and the
radius of the ’defect’ dots (still representing 1% of the total) is 1.1 nm, corresponding to a size distribution of 10.4%(Fig. 5(B)). We find that, although, similarly to the previous case, increasing the quantum dot separation decreases mobility, the difference in the eigenvalues calculated for different separations is not as marked as for larger dots.
A more detailed inspection of our results reveals a higher anisotropy in the miniband structure obtained for larger nanocrystals than in that calculated for dots withR=1.2 nm.
This feature is evident in Fig. 6, where we show, for both sys-tems, a cross section of the miniband taken 5 meV above the
miniband minimum (here each dot represents aq state). Our
results therefore indicate that the smaller the quantum dots, the more isotropic the minibands (which exhibit a similar curvature in every direction). Furthermore, the anisotropy around the mini-band minimum exhibits maximum curvature along the diagonals of the Brillouin zone, i.e. along~b
1+~b2and~b1−~b2(where~b1and ~b
qy
qx R=1.26 nm
R=1.92 nm
Fig. 6 States in reciprocal space located 5 meV above the miniband
minima in 2D hexagonal periodic arrays of wurtzite CdSe nanocrystals withR=1.84nm (blue line) andR=1.26nm (red line).
dots, for small nanocrystal arrays we find no change in sign for the electron mobility in the temperature range considered. The results of the fitting of the mobility vsT curves to (11) (with n=2)26are shown in 1. When the quantum dots are placed one
bond length apart (the shortest separation considered here), we find that smaller quantum dots yield larger mobilities. In this case the highest mobilities are of the order of 10 cm2/V·s.
3.3 Zincblende CdSe dots withR=1.22nm
In order to investigate the influence of the dot’s crystal structure and the array’s symmetry on the calculated mobilities, we con-sidered zincblende CdSe nanocrystals in a square lattice. In this case the highest mobilities are found to be about one order of magnitude lower than for same-size wurtzite quantum dots in an hexagonal lattice (see Fig. 7A), mainly because of the lower coor-dination number of the array. For the largest dot-to-dot distance considered, the mobility eigenvalues show the change in sign al-ready found for the larger wurtzite nanocrystals (Fig. 5), and no fitting was carried out consequently.
3.4 Cd-centred zincblende CdSe withR=1.22nm
In previous work10we found that the nanostructure’s surface sto-ichiometry may have a considerable impact on the mobility in the 2D array. By growing the quantum dot around a central cation, instead of a Se atom (as it was the case for all structures consid-ered so far), we obtained a Cd-rich surface. This choice reduces the mobility by a factor of up to about 2 (see Fig. 7B), for the shortest separations, and yields almost identical results to anion-centred structures for larger displacements. The atomic compo-sition of the surface, therefore, seems to be important only for closely-spaced quantum dot arrays.
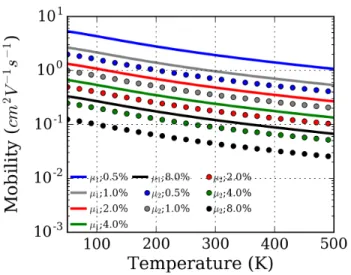
3.5 Dependence on the number of defects
All calculations so far have been carried out assuming the ’defect’ dots to represent 1% of the total number of dots in the array. This value is not too far from present experimental capabilities1, and well within the limits of applicability of our model29,30, where we assume no correlations between defects. The effect of varying the defect ratio from 0.5% to 8%, is shown in Fig. 8. The dependence
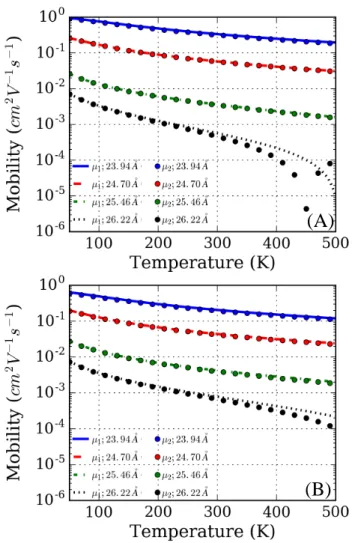
(A)
(B)
Fig. 7 Mobility eigenvalues (|µ1|and|µ2|, in absolute value) for square periodic arrays of Se-centred (a) and Cd-centred (B) zincblende CdSe dots withR=1.2nm, calculated for different centre-to-centre separations: 2.39 nm (blue lines and symbols), 2.47 nm (red lines and symbols), 2.55 nm (green lines and symbols) and 2.62 nm (black lines and symbols).
on this ratio in our model is simplistic: an inspection of (3) reveals that the scattering probabilities are proportional to this quantity. This leads to flight times inversely proportional to the defect ratio.
3.6 Simplified ("Toy") model
Although it is not straightforward to see, we found that, in our treatment, the flight time dependence of the mobilities is the same as in the Drude model. Indeed, if we assume (i) the miniband to be parabolic with a specific effective mass and (ii) the transition ratesΓi
→ffrom every initial state to every final state to be equal in each interval, our approach will yield Drude’s model. Our calcu-lations show assumption (ii) to be reasonable (as an example, for a 2D hexagonal array of wurtzite CdSe nanocrystals withR=1.84
nm, we find that the average over all the energy-conserving tran-sitions in the miniband yieldsΓi
Fig. 8 Absolute value of the mobility eigenvalues vs temperature in
hexagonal periodic arrays of wurtzite CdSe quantum dots withR=1.84 nm and a 7.6% size dispersion, separated by a bond length, calculated for different defect ratios (0.5%, 1%, 2%, 4% and 8%).
equal too, because they are related toΓi →f by:
ti=
1
∑fΓi→f
(12)
which, assuming a single rateΓ˜ for all transitions, simplifies to:
ti=
1
∑fΓi→f ≈
1
nintΓ˜. (13)
The transitions probabilities to each accessible final state after a scattering (6) would then become
Pi→f=
Γi →f ∑f′Γi→f′ ≈
1
nint (14)
(It needs to be stressed here that (12) to (14) refer to asingle
interval). These probabilities yield transition matrices for the Markov’s chain that are themselves the limit matrix of the iter-ative process, and therefore no Markov’s chain calculations are needed. The probabilities of starting a flight from a certain initial stateiare then simplypi≈1/nint.
Once the group velocity along the miniband is calculated, the average velocity in an interval (9) could be simplified as:
h~vi=∑
nint
i=1
pi×~v(~qfin,i) ∑fΓi→f
∑nint
i=1 pi ∑fΓi→f
≈ ∑ nint
i=1~v(~qfin,i)
nint . (15)
The value of~qfin,i(4) can be obtained as:
~qfin,i≈~qini− e
¯hΓ˜nint ~
E (16)
and the mobility tensor in a given intervaliin the presence of an
electric field~Eis obtained as:
ˆ
µi≈
1
nint×E×
∑nint
i=1vx
³
qx,ini− e
¯hΓ˜nintE, qy,ini ´
∑nint
i=1vx
³
qx,ini, qy,ini− e ¯hΓ˜nintE,
´
∑nint
i=1vy
³
qx,ini− e
¯hΓ˜nintE, qy,ini
´ ∑nint
i=1vy
³
qx,ini, qy,ini− e ¯hΓ˜nintE,
´
(17)
Using this in (10) the mobility tensor’s dependence on tempera-ture is obtained.
When the miniband is isotropic and parabolic, and the calcu-lation is carried out around its minimum, the dispersion recalcu-lation can be written as:
ε(qx, qy) =
¯h2 2m(q
2
x+q2y) (18)
The group velocity is then:
~v=1
¯h∇ε(qx, qy) = ¯h
m(qx, qy) (19)
The calculation of the mobility matrix terms, for exampleµxx, can be done by grouping together pairs of opposite initial~q
vec-tors in the interval, obtaining:
µxx=
¯h
m
nint/2
∑
i=1 −2e ¯hΓ˜nintE=
−e
mΓ˜E (20)
which, finally, is Drude’s mobility expression. (According to the latter, the mobility in each energy interval would be inversely pro-portional to the defect ratio, in agreement with our results).
The results of this simplified (or "Toy") model are compared with those of the full method in Fig. 10: the curves are indistin-guishable. This proves that in each energy interval all the transi-tion ratesΓi
→f can be considered equal (Γ˜). As a consequenceΓ˜ can be extracted from a fit to experimental data. The results of this procedure are also shown in Fig. 10 where the best fits were obtained for the following values ofΓ˜: 0.7×10¹³ s−1, 1013 s−1, and 1.2×10¹³s−1.
3.7 Dependence on dot-to-dot separation
Increasing the separation between dots reduces their mutual wave function overlap leading to a flattening of the minibands: The miniband effective mass increases and the mobility is re-duced. The dependence of the overlap reduction with distance is approximately exponential, however, the complexities of the calculation and the influence of high-energy states far from the miniband minimum (especially at room and higher temperatures) could modify this exponential dependence. We investigated the effects of quantum dot separation at 50 K and 300 K (Fig. 9 -The centre-to-centre separations shown correspond to wall-to-wall separations of 1 to 2 bond lengths). At 50 K we expect to see the closest behaviour to an exponential decrease of mobility with displacement,
µi(T ,∆) =γi(T)eη(T) ∆
(a)
(b)
Fig. 9 Mobility eigenvalues (absolute values) vs quantum dot
centre-to-centre distance in a hexagonal periodic array of wurtzite CdSe quantum dots withR=1.84nm, 7.6% size distribution, and 1% defect ratio (sym-bols) atT=50K (a) andT=300K (b). The analytical exponential fittings are shown as solid lines.
(where i=1, 2 is the eigenvalue index, T is the temperature,
∆=d−d0,dis the wall-to-wall separation andd0=1bond length
- the shortest distance considered here - both in Å), because at this temperature the main contribution to the calculation comes from the states around the miniband minimum, where the effec-tive mass approach provides a suitable description of the system. Nevertheless, the mobilities still exhibit an exponential behaviour at 300 K, although the agreement with the exponential curves in Fig. 9 is not as good as for 50 K, due to the occurrence of instances where the mobility changes sign and the electron behaviour is hole-like. This occurs at high energies, when the miniband curva-ture is inverted.
The most interesting common feature for both eigenvalues is a larger decrease of mobility with separation at high temperatures than at low temperatures. The fitted exponential factors range between 1.9 and about 3.5, (see 2) with the exponent calculated at T=300 K about 20%-25% higher than that obtained at 50 K, roughly according to
µ(300K, d−d0) =µ(300K, d0)×
µµ
(50K, d−d0)
µ(50K, d0)
¶5/4
. (22)
As discussed earlier, we also find that smaller quantum dots show smaller reduction in mobility with increasing separation. This is due to a combination of two factors: (i) a stronger inter-dot coupling (i.e., a larger wave function overlap) and (ii) a more isotropic miniband for smaller quantum dots.
3.8 Comparison with hopping theory and experiment Available experimental data for electron mobilities as a func-tion of temperature have been measured, in a FET configurafunc-tion, in In2Se24−-capped 3.9 nm CdSe nanocrystal arrays6 and in In-doped, thiocyanate-exchanged CdSe films5. A direct quantitative comparison with these results is therefore difficult, as such
sys-150 200 250 300
T (K)
0 5 10 15 20 25 30
µ
(cm
2 /Vs)
exp. Kagan exp. Talapin1 exp. Talapin2 theory µ1 (FM)
theory µ2 (FM)
hopping (x103)
α/T1/2 (x9.3)
150 200 250 300
T (K)
0 5 10 15 20 25 30
µ
(cm
2 /Vs)
TM: Γ=0.7x10¹³s-1 TM: Γ=1.0x10¹³s-1 TM: Γ=1.2x10¹³s-1 TM: Γ=2.2x10¹³s-1
Fig. 10 The absolute values of the mobility eigenvalues as a function
of temperature for wurtzite CdSe nanocrystals withR=1.84nm (1% de-fect density, 5% size distribution), calculated with our "Full Model" (FM) for wall-to-wall separations of 1 bond length (µ1, full green circles; µ2, full dark green circles), are compared with the theoretical predictions of (i) the hopping model obtained using the parameters suggested in Fig.2 of Ref.7 and an activation energyE
a=25meV (black diamonds -
val-ues multiplied by 1000), and (ii) a recent model proposed by Shabaev and Efros11 (where, for E
F <EBandMin (as we assume in our model) µ∝1/T1/2- black crosses - values multiplied by 9.3), and with the experi-mental results reported by Talapin’s group6for In
2Se4-capped CdSe dots withD=3.9nm in both linear (orange triangles - Talapin1) and satura-tion (red triangles - Talapin2) regimes and the data from Kagan’s group5 relative to In-doped, thiocyanate-exchanged CdSe films made of simi-larly sized dots (blue squares). The solid and dashed lines represent the prediction of the "Toy Model" (TM) forµ1andµ2 respectively, using the following values forΓ˜:0.7×10¹³s−1(blue),1013s−1(orange),1.2
×1013 s−1(red), and2.2×1013s−1(green). Shabaev and Efros’ mobility curve is obtained according to Eq. (21) in Ref.11, using our calculated values for overlap integrals and depth of the confining potential, and assuming a size dispersion of 5%. The curves relative to (i) the hopping model and (ii) Shabaev and Efros’ model are rescaled (using multiplicative factors of 1000 and 9.3, respectively) so that they overlap with the red triangle at the lowermost temperature to allow for a fairer comparison of the different T dependencies.
tems are clearly very different from the ones studied here: (i) the nanocrystals are sandwiched between dielectric substrates and metal electrodes and (ii) their surface is covered by inorganic lig-ands that fill the inter-dot space. In contrast, we modelled an array with free surfaces whose constituents are separated by vac-uum. Considering that the presence of inorganic ligands should increase the wave function overlap between neighbouring dots, compared to vacuum, and therefore increase electron mobilities, we expect our results to represent a lower limit for the mobili-ties measured in FETs. This expectation is confirmed by Fig. 10 which shows a comparison of our results for arrays of wurtzite CdSe nanocrystals withR=1.92 nm, 1% defect ratio, 5% size
dispersion, and an inter-dot separation of 1 bond length, with the measured field-effect experimental mobilities5,6, and the pre-dictions of the hopping model7 (the curve displayed here was taken from Fig.2 of Ref.7 and refers to Ea =25 meV), and of a model recently proposed by Shabaev and Efros11, where, for
EF<EBandMin(as we assume in our calculations),µ ∝T−1/2(The
temperature, to allow for a fairer comparison of the different T dependencies). The experimental mobilities exhibit a very good qualitative and quantitative agreement with the temperature de-pendence predicted by band-like transport. Interestingly, they are fitted very well up to room temperature by the "Toy model" (TM) withΓ˜=0.7−1.2×10¹³s−1(whereas the theoretical results of the
"Full Model" (FM) are reproduced by the TM at all temperatures forΓ˜ =2.2×10¹³ s−1). For higher temperatures, the observed
mobilities show a steep drop fromµ1toµ2.
In contrast, the predictions of the hopping model7
µ=αEa kT e
−Ea/kT (23)
(where α is a temperature-independent material- and
configuration-specific parameter, Ea is the activation energy, k is Boltzmann’s constant, andT the temperature), disagree with
experiment both quantitatively (they are 3 orders of magnitude smaller), and, most importantly, qualitatively, as they exhibit the opposite trend with increasing temperature. While the quantita-tive disagreement could be mitigated by optimizing the choice of the exponential pre-factor α for the specific experimental samples considered, the prediction of an increase in the mobility with increasing temperature is a crucial feature that only depends on the value of the activation energyEa(here=25meV). Smaller values for the activation energy would yield a better qualitative agreement with experiment (i.e., a negative slope for the curve), however they would be unrealistic, according to the estimated7
magnitude of the different contributions to Ea (25 meV may
already represent an underestimate for this quantity); whereas higher values for Ea increase the positive value for dµ/dT in this temperature range, hence the qualitative disagreement with experiment.
In contrast, the∝T−1/2 curve, although quantitatively about
one order of magnitude smaller than the measured mobilities, is in better qualitative agreement with their observed T depen-dence, albeit in a restricted temperature range, if compared to our model. However, crucially, it cannot account for the observed drop in mobility above room temperature, which is instead cap-tured in our approach by the second mobility eigenvalueµ2.
4
Conclusions
We presented a new theoretical framework for the calculation of the temperature-dependent electron mobility in nanocrystal films, where fluctuations in the quantum dot sizes represent the limiting mechanism for conduction. Our approach is based on the Monte Carlo description of the scattering process in which, however, the stochastic carrier flight times are replaced by their average. This procedure avoids the computationally prohibitively expensive im-plementation of a full Monte Carlo algorithm while maintaining a similar accuracy. The use of Markov’s chain formalism further improves the efficiency of the calculations, enabling speed-ups of over 4 orders of magnitude, compared to Monte Carlo.
The fluctuations in the flight times calculated in different isoen-ergetic intervals (due to the different number of states present in such intervals and unavoidable when using a finite discretization of theqspace), which propagate to the mobilities causing similar
variations, are substantially reduced by resorting to the definition of a smoothing function akin to the miniband density of states, further improving the accuracy of our results. Using this method, we investigated the effect on the electron mobility of dot size, dot-to-dot separation, density of defects, dot crystal structure and superlattice arrangement (square and hexagonal) for 2D arrays of CdSe nanocrystals.
Finally we validated the method by comparing its results with the experimental mobilities recently measured by two different groups. Our model shows that the observed mobility decrease with increasing temperature can be explained up to room temper-ature without resorting to phonon scattering, but in terms of the hole-like character of the electron mobility at high energies. For higher temperatures, the phonons’ contribution becomes domi-nant and causes the mobility to drop from its higher eigenvalueµ1 to the lower eigenvalueµ2. The comparison of the temperature dependence observed in the experimental field-effect mobilities and that predicted for hopping and band-like transport suggests the latter to be the mechanism at play in high mobility films.
Conflicts of interest
In accordance with our policy on Conflicts of interest There are no conflicts to declare.
Acknowledgements
M.C. gratefully acknowledges financial support from the School of Electronic & Electrical Engineering, University of Leeds. F.M.G.C. and S.R.B. were supported by Project ENE2016_80944_R, funded by the Spanish Ministerio de Economía, Industria y Competitivi-dad.
Notes and references
1 Weidman, M. C.; Beck, M. E.; Hoffman, R. S.; Prins, F.; Tis-dale, W. A. Monodisperse, Air-Stable PbS Nanocrystals via Precursor Stoichiometry Control. ACS Nano2014, 8,
6363-6371.
2 Maulu, A.; Rodríguez Cantó, P. J.; Navarro Arenas, J.; Abar-gues, R.; Sanchez-Royo, J. F.; García Calzada, R.; Martínez-Pastor, J. P. Strongly-Coupled PbS QD Solids by Doctor Blad-ing for IR PhotodetectionRSC Adv.2016,6, 80201-80212.
3 Baumgardner, W. J.; Whitham, K.; Hanrath, T. Confined-but-Connected Quantum Solids via Controlled Ligand
Displace-mentNano Lett.2013,13, 3225-3231.
4 Murray, C. B., Kagan, C. R. and Bawendi, M. G. Synthe-sis and Characterization of Monodisperse Nanocrystals and Close-Packed Nanocrystal Assemblies Annu. Rev. Mater. Sci.
2000,30, 545-610.
5 Choi, J.-H.; Fafarman, A. T.; Oh, S. J.; Ko, D.-K.; Kim, D. K.; Diroll, B. T.; Muramoto, S.; Gillen, J. G.; Murray, C. B.; Ka-gan, C. R. Bandlike Transport in Strongly Coupled and Doped Quantum Dot Solids: A Route to High-Performance Thin-Film Electronics.Nano Lett.2012,12, 2631-2638.
photoconductivity in all-inorganic nanocrystal arrays.Nature
Nanotechn.20116, 348-352.
7 Guyot-Sionnest, P. Electrical Transport in Colloidal Quantum Dot FilmsJ. Phys. Chem. Lett.2012,3, 1169-1175.
8 Chu, I.-H.; Radulaski, M.; Vukmirovic, N.; Cheng, H.-P.; Wang, L.-W. Charge Transport in a Quantum Dot Supercrystal
J. Phys. Chem. C2011,115, 21409-21415.
9 Wang, L.-W.; Zunger, A. Pseudopotential calculations of nanoscale CdSe quantum dots.Phys. Rev. B1996,53, 9579.
10 Gómez-Campos, F. M.; Rodríguez-Bolívar, S.; Califano, M. Mobility Toolkit for Quantum Dot Films ACS Photon.2016,
3, 2059-2067.
11 Shabaev, A; Efros, Al. L; Efros, A. L. Dark and Photo-Conductivity in Ordered Array of Nanocrystals. Nano Lett.
2013,13, 5454-5461.
12 Yang, J.-Y; Qin, G.; Hu, M. Nontrivial Contribution of Fröh-lich Electron-Phonon Interaction to Lattice Thermal Conduc-tivity of Wurtzite GaN.Appl. Phys. Lett.2016,109,
242103-1–242103-4.
13 Salvador, M. R.; Graham, M. W.; Scholes, G. D. Exciton-Phonon Coupling and Disorder in the Excited States of CdSe Colloidal Quantum DotsJ. Chem. Phys.2006,125,
184709-14 Nomura, S.; Kobayashi, T. Exciton-LO-Phonon Couplings in Spherical Semiconductor MicrocrystallitesPhys. Rev. B1992,
45, 1305-1316.
15 Rodriguez-Suarez, R.; Menendez-Proupin, E.; Trallero-Giner, C.; Cardona, M. Multiphonon Resonant Raman Scattering in NanocrystalsPhys. Rev. B2000,62, 11006-11016.
16 R. E. Chandler, A. J. Houtepen, J. Nelson, and D. Vanmaekel-bergh Electron Transport in Quantum Dot Solids: Monte Carlo Simulations of the Effects of Shell Filling, Coulomb Re-pulsions, and Site Disorder.Phys. Rev. B2007,75, 085325.
17 Gagorik, A. G.; Mohin, J. W.; Kowalewski, T.; Hutchison, G. R. Monte Carlo Simulations of Charge Transport in 2d Organic PhotovoltaicsJ. Phys. Chem. Lett.2013,4, 36-42.
18 Ando, Y.; Cappy, A. Ensemble Monte Carlo Simulation for Electron Transport in Quantum Wire StructuresJ. Appl. Phys.
1993,74, 3983-3992.
19 This choice produces an even number of states in each in-terval, which correctly include pairs of symmetricalqstates
(i.e.,~qand−~q, which have the same energy, the exception
be-ing the lowest energy interval containbe-ing theΓpoint~q=0),
while, at the same time, ensuring reasonable/manageable computational times.
20 Basharin, G. P.; Langville, A. N.; Naumov, V. A. The Life and Work of A. A. Markov,Linear Algebra and Its Application2004,
386, 3-26.
21 Jacoboni, C.; Reggiani, L. The Monte Carlo method for the so-lution of charge transport in semiconductors with applications to covalent materials,Rev. Mod. Phys.1983,55645-705.
22 Unfortunately using the500×500discretization for the whole
calculation is computationally too expensive.
23 Although the smallest centre-to-centre separation is equal to exactly2R, it nevertheless corresponds to a wall-to-wall
sep-aration of 1 bond length, as R is an "effective" radius,
de-termined from the total number of atoms in the dot (N) as
R=a0(3N/32π)1/3 (where a0 is the material’s lattice con-stant).
24 Yang, J.; Wise, F. W. Effects of Disorder on Electronic Prop-erties of Nanocrystal AssembliesJ. Phys. Chem. C2015,119,
3338-3347.
25 The exponential decrease of coupling with separation has also been confirmed experimentally27,28.
26 In this case only, the curves relative to the greatest separation considered satisfy (11) withn∼1/4instead.
27 Liu, Y.; Gibbs, M.; Puthussery, J.; Gaik, S.; Ihly, R.; Hillhouse, H. W.; Law, M. Dependence of Carrier Mobility on Nanocrystal Size and Ligand Length in PbSe Nanocrystal SolidsNano Lett.
2010,10, 1960-1969.
28 Gao, Y.; Aerts, M.; Sandeep, C. S. S.; Talgorn, E.; Savenije, T. J.; Kinge, S.; Siebbeles, L. D. a; Houtepen, A. J. Photoconduc-tivity of PbSe Quantum-Dot Solids: Dependence on Ligand Anchor Group and LengthACS Nano2012,6, 9606-9614.
29 Rodríguez-Bolívar, S.; Gómez-Campos, F. M.; Luque-Rodríguez, A.; López-Villanueva, J. A.; Jiménez-Tejada, J. A.; Carceller, J. E. Miniband structure and photon absorption in regimented quantum dot systemsJ. Appl. Phys. 2011, 109,
074303-1 - 074303-7.
30 García, T.; Gómez-Campos, F. M.; Rodríguez-Bolívar, S. Influ-ence on miniband structure of size variations in regimented InAs/GaAs quantum dots arrays. J. Appl. Phys. 2013, 114,
Table 1 Fitted parameters from(11)withn=2. The subscripts refer to each of the mobility eigenvaluesµ1andµ2 R[nm] Cr. Struct. Surface d[nm] α1[
√
V s/cmK] α2[
√
V s/cmK] β1[
√
V s/cm] β2[
√
V s/cm]
1.84 WZ Se-rich 3.7 5.38×10⁻⁴ 8.72×10⁻⁴ 1.61 2.68
1.84 WZ Se-rich 3.8 2.23×10⁻³ 3.54
×10−3 3.62 6.44
1.84 WZ Se-rich 3.9 1.70×10⁻² 3.00×10⁻² 6.97 11.17
1.26 WZ Se-rich 2.4 4.36×10⁻⁵ 4.58×10⁻⁵ 0.91 0.80
1.26 WZ Se-rich 2.5 2.39×10⁻⁴ 2.31×10⁻⁴ 1.49 1.59
1.26 WZ Se-rich 2.6 1.04×10⁻³ 1.04×10⁻³ 4.43 4.46
1.22 ZB Se-rich 2.4 8.89×10⁻⁴ 9.13
×10−4 2.77 2.83
1.22 ZB Se-rich 2.5 2.58×10⁻³ 2.61×10⁻³ 5.27 5.27
1.22 ZB Se-rich 2.6 1.27×10⁻² 1.32×10⁻² 14.67 14.17
1.22 ZB Cd-rich 2.4 1.17×10⁻³ 1.21×10⁻³ 3.41 3.48
1.22 ZB Cd-rich 2.5 3.03×10⁻³ 2.92
×10−3 6.12 6.14
1.22 ZB Cd-rich 2.6 1.10×10⁻² 1.18×10⁻² 15.38 14.56
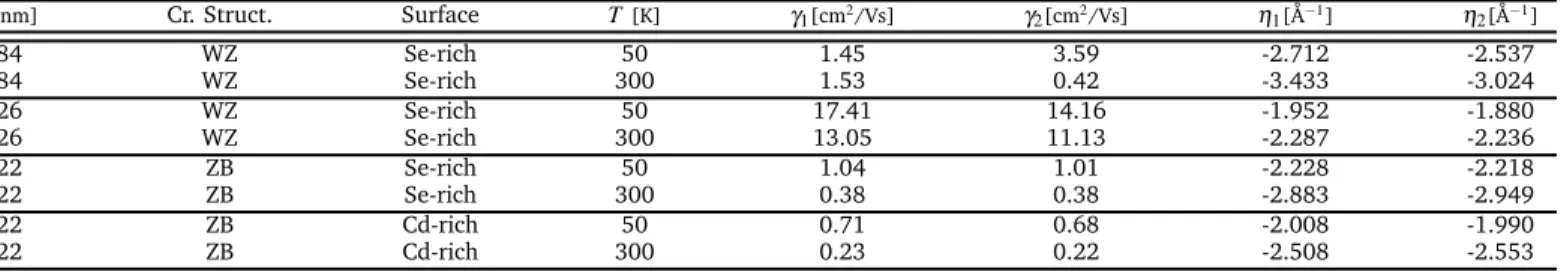
Table 2 Fitted parameters from(21). The subscripts refer to each of the mobility eigenvaluesµ1andµ2.
R[nm] Cr. Struct. Surface T[K] γ1[cm2/Vs] γ2[cm2/Vs] η1[Å−1] η2[Å−1]
1.84 WZ Se-rich 50 1.45 3.59 -2.712 -2.537
1.84 WZ Se-rich 300 1.53 0.42 -3.433 -3.024
1.26 WZ Se-rich 50 17.41 14.16 -1.952 -1.880
1.26 WZ Se-rich 300 13.05 11.13 -2.287 -2.236
1.22 ZB Se-rich 50 1.04 1.01 -2.228 -2.218
1.22 ZB Se-rich 300 0.38 0.38 -2.883 -2.949
1.22 ZB Cd-rich 50 0.71 0.68 -2.008 -1.990