rstb.royalsocietypublishing.org
Review
Cite this article:
Dugdale HL, Richardson DS.
2018 Heritability of telomere variation: it is all
about the environment!
Phil. Trans. R. Soc. B
373
: 20160450.
http://dx.doi.org/10.1098/rstb.2016.0450
Accepted: 21 October 2017
One contribution of 19 to a theme issue
‘Understanding diversity in telomere
dynamics’.
Subject Areas:
ecology, evolution, health and disease
and epidemiology
Keywords:
heritability, telomeres, environmental effects,
genetic effects, animal models, variation
Author for correspondence:
David S. Richardson
e-mail: [email protected]
Heritability of telomere variation: it is all
about the environment!
Hannah L. Dugdale
1and David S. Richardson
21Faculty of Biological Sciences, School of Biology, University of Leeds, Leeds LS2 9JT, UK
2School of Biological Sciences, University of East Anglia, Norwich Research Park, Norwich, Norfolk NR4 7TJ, UK
HLD, 0000-0001-8769-0099; DSR, 0000-0001-7226-9074
Individual differences in telomere length have been linked to survival and senescence. Understanding the heritability of telomere length can provide important insight into individual differences and facilitate our understand-ing of the evolution of telomeres. However, to gain accurate and meaningful estimates of telomere heritability it is vital that the impact of the environment, and how this may vary, is understood and accounted for. The aim of this review is to raise awareness of this important, but much under-appreciated point. We outline the factors known to impact tel-omere length and discuss the fact that teltel-omere length is a trait that changes with age. We highlight statistical methods that can separate genetic from environmental effects and control for confounding variables. We then review how well previous studies in vertebrate populations including humans have taken these factors into account. We argue that studies to date either use methodological techniques that confound environmental and genetic effects, or use appropriate methods but lack sufficient power to fully separate these components. We discuss potential solutions. We con-clude that we need larger studies, which also span longer time periods, to account for changing environmental effects, if we are to determine meaningful estimates of the genetic component of telomere length.
This article is part of the theme issue ‘Understanding diversity in telomere dynamics’.
1. Introduction
Phenotypic variation is the result of both genetic and environmental effects. To understand the causes and consequences of variation in any given trait—as we must to fully appreciate its ecological, evolutionary and health implications— we need to determine the contribution of these two components. This is difficult as environmental and genetic effects are complex and intertwined; they include many interacting aspects, e.g. additive, dominant or epistatic genetic effects, and environmental effects that may be variable or constant [1,2]. Quantitative genetics offers an analytical framework to investigate the causes and evolutionary consequences of phenotypic variation, particularly the genetic component. However, it is important to understand that in quantitative genetic analyses we are often measuring relative effects. For example, when determining the heritability of a trait, we are estimating the contribution of genetic effects to the total phenotypic variance observed in that trait within a population (figure 1a). Any change in the influence of the environment upon that trait will alter our estimate of heritability, even when there is no change in the underlying genetic variation. It is, therefore, important to fully understand and take into account environmental effects in any quantitative genetic study [1]. Telomere length (or dynamics) is a phenotypic trait influenced by genetic and environmental effects [3,4]. The basic function of telomeres is to act as a chromosomal cap and maintain the integrity of linear chromosomal DNA [5]. Initial telomere length is inherited [5], but telomeres typically shorten with
&
2018 The Authors. Published by the Royal Society under the terms of the Creative Commons Attributionage in somatic cells due to the DNA end replication problem during cell division [6] and other factors, most notably damage caused by oxidative stress [7,8]. Oxidative stress is elevated by many environmental factors [7,9] and, as a result, is thought to be why telomere attrition is accelerated by the different stresses experienced during an individual’s life [10,11]. Telomere restoration can also occur due to mech-anisms such as telomerase activity [12] but telomerase is thought to be downregulated in the somatic cells of many adult organisms [13]. Importantly, critically short telomeres induce cell senescence or death [14,15] and the accumulation of such cells over time has been linked to organismal senes-cence [14,16]. Telomere length, or rate of attrition, has now been linked to lifespan among species [17,18], and to survival probability and lifespan within many species [19–22], though the causality of this association remains unclear [23,24]. Con-sequently, understanding which factors determine variation in telomeres is of considerable importance.
From a quantitative genetics perspective, the goal is to determine the contribution of genetic effects to among-individual variation in telomeres. Only by having accurate estimates of the genetic component of telomere variation can we determine its evolutionary potential [25]. However, individual telomere length at any given point is dependent on three processes: the initial length of the zygote’s telomeres, the amount of attrition experienced and the amount of restoration. These processes may all be influenced by both genetic and environmental factors [4,26] and their relative contribution will differ among individuals and change throughout an organism’s life. If we are to measure genetic effects accurately we need to ensure that environmental influences are carefully controlled for, either physically or statistically. Laboratory studies can reduce or isolate environ-mental variation. Such studies provide an excellent way to investigate how specific environmental factors influence telo-mere length, and provide important insights (e.g. [10,11]). However, if environmental variation is minimized then, by definition, the majority of phenotypic variation will be due to genetic effects and the heritability of the trait will approach 1 (figure 1a). Knowing the heritable component under such
conditions is not, in itself, that useful. We need to be able to determine the relative contribution of genetic effects to variation in telomere length, under the conditions in which organisms live naturally, if we are to understand its consequences in terms of their health, ecology and evolution. Determining when the environment is accelerating telomere attrition is also important in its own right [27,28]. For example, measuring effects linked to habitat quality, early-life environments or captive conditions [10,20,29,30] will provide insight into medical, veterinary, conservation and ecological issues. Such studies can be especially revealing if they allow us to measure chronic effects not detectable through immediate patterns of mortality or body condition, but which have long-term consequences, e.g. pathogen infection [31], stress [11] and environmentally dependent inbreeding [32]. Furthermore, the amount of telomere shortening caused by different environmental effects could provide researchers with a generic currency with which to measure the relative impact of different environmental stressors [30] and thus gain insight into the trade-offs that occur throughout an individual’s life [24].
The importance of estimating environmental effects in any quantitative genetics study of telomeres is, therefore, clear. In the rest of the paper, we will first outline two key complications: (i) how environmental effects (and thus esti-mates of heritability) change over space and time, and (ii) the importance of recognizing that telomeres are not a fixed trait, but can change extensively with age. We then outline specific sources of variation that may impact telomeres, before discussing how these can be included in analyses, what has been analysed to date in vertebrate studies, what problems exist in those studies and finally, how the field can best move forward.
2. Genetic and environmental factors contribute
to variance in telomere length
Complex phenotypic traits, such as telomere length, are rarely underpinned by a few genes of large effect; rather, they are
environmental environmental
environmental
environmental
environmental genetic
genetic
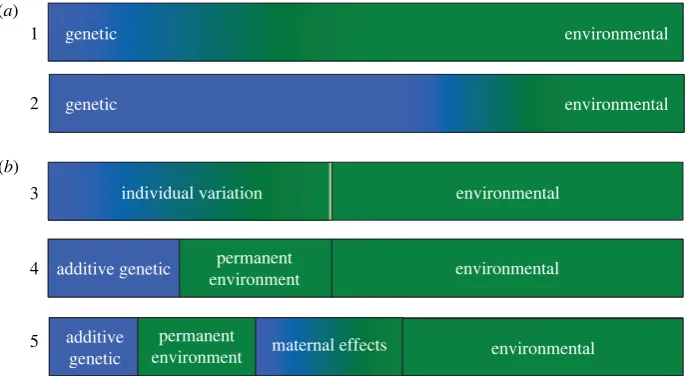
1 (a)
(b) 2
3
4
5
individual variation
additive genetic
additive genetic
permanent environment
permanent
[image:2.595.126.470.42.230.2]environment maternal effects
Figure 1.
Hypothetical proportion of telomere length variation among individuals explained by genetic (blue) and environmental (green) effects: (
a
) in a population
where individuals experience: (1) highly variable environments versus (2) relatively constant environments; and (
b
) estimated using mixed models of increasing
complexity, based on repeated measures of telomere length per individual: model (3) a mixed model to separate individual variation from environmental (residual)
variation, model (4) an ‘animal’ model where individual variation is separated into additive genetic and permanent environmental effects, and model (5) where
maternal identity is included to estimate maternal effects.
rs
tb.r
oy
alsocietypublishing.org
Phil.
Trans.
R.
Soc.
B
373
:20160450
primarily a result of the action of many genes of small effect [33]. At each locus, effects may be due to additive or domi-nance effects. Different genes will also impact the resulting phenotype in different ways, i.e. with additive or epistatic actions. These genetic effects could alter telomere length in various ways, such as: initial telomere length in the fertilized egg, individual resistance to telomere attrition or the extent of telomerase expression. Quantitative genetics does not require knowledge of the genes underlying telomere length, or the way in which the genes act. Rather, it assumes that pheno-typic traits result from many genes which each have an infinitesimally small, additive effect on the phenotype [34,35]. From an evolutionary perspective, additive genetic variance is of particular interest as it is used to calculate the heritability of the trait, which in combination with the strength of selection on the trait will determine its evolutionary potential [34].
From an environmental perspective, telomeres may be impacted by effects from a wide variety of sources (e.g. natal, population, parental) that may differ in type (e.g. vari-able, constant). Environmental effects can include both common environmental effects, i.e. that affect a group of indi-viduals experiencing the same environment, and permanent environmental effects, i.e. that have a consistent effect over an individual’s lifetime [36]. Population-wide cohort effects [20,32,37] could thus represent common environment effects on individuals from a particular cohort, or permanent environment effects if the effect on a particular cohort lasts over lifetimes. Environmental effects can also include par-ental effects. Parpar-ental effects on telomere length [38] could arise for several reasons, such as: epigenetic effects (e.g. DNA methylation), differential contributions to an egg, par-ental care effects or as a direct result of local physical conditions provided by the parents. Confusingly, while parental effects act through the environment provided to off-spring, they can have a genetic component. For example, provisioning variation between parents can impact offspring telomeres [39] either as a result of environmental effects, e.g. higher food abundance in good territories, or genetically determined differences in parental provisioning behaviour [40].
3. Environmental effects change over space and
time
Under natural conditions the environment, and thus its impact on telomeres, may change considerably, both spatially and temporally within a population. The best evidence of this is provided by long-term ecological studies. For example, in Soay sheep, Ovis aries [20] and Seychelles warblers,
Acrocephalus sechellensis[30] varying environmental conditions
during early life generate considerable and long-lasting cohort effects on telomere length (figure 2). The effect of such spatio-temporal variation on quantitative genetic studies of telomere dynamics needs to be considered care-fully. If the impact of the environment changes, then the relative amount of telomere variation due to genetic versus environmental effects will differ. This is not error but a real effect we need to understand. To add to this complexity, genotypeenvironment (GE) interactions may occur [41]. For example, certain genetic effects may only be appar-ent under stressful conditions. Indeed, a recappar-ent study found evidence that lower individual heterozygosity due to
inbreeding resulted in faster telomere attrition, but only under poor environmental conditions [32]. Given the above, any estimates of genetic effects on telomere length in natural populations will depend on when and where the study takes place. With this in mind, and taking into account that studies are normally very restricted on a spatial and temporal scale, it may not be surprising if different studies, even on the same species (as seen in humans; table 1), vary greatly in their estimates of genetic effects [56].
4. Telomeres are not a fixed trait, but change
with age
Telomeres of somatic cells shorten with age in most organ-isms, with the amount of shortening depending, to a considerable extent, on the stress experienced as the individ-ual interacts with its environment [7,27]. Consequently, even if the environment remains constant the relative influence of the environment on an individual’s telomere length will increase with age. Furthermore, rates of telomere attrition may differ across an individual’s lifetime, e.g. attrition is nor-mally much greater during development [30,37]. Telomere attrition may also vary considerably across time because of specific life-history events (e.g. reproduction [74]) or environ-mental experiences (e.g. infection [31]). Studies that have measured longitudinal changes in telomere length generally find a log-linear relationship with age, but with considerable fluctuations within individuals (figure 3), including evidence that an individual’s telomere length may increase over certain periods [20,30].
Interactions with the (changing) environment will also mean that the pattern of change will be volatile, difficult to predict and may vary markedly between individuals. Such age-related variation in telomere length must be carefully controlled for—in both the focal individual and the parents—if we want to gain accurate measures of the herit-ability of telomere length or dynamics. However, few studies have measured telomeres at the same point in life in both offspring and parents [31]. Given that environmental
0 0.8 0.9 1.0 1.1
RTL
1.2 1.3
5 10 15
[image:3.595.330.532.41.243.2]age (years)
Figure 2.
Relative telomere length (RTL) among cohorts in relation to age in
Seychelles warblers,
Acrocephalus sechellensis
. Lines represent fitted values
from a linear regression of RTL and log-transformed age. Colours represent
birth years (1993 – 2014). Adapted from [30].
rs
tb.r
oy
alsocietypublishing.org
Phil.
Trans.
R.
Soc.
B
373
:20160450
Table
1.
Summary
of
studies
es
tima
ting
narr
ow-sense
heritability
(
h
2)
of
telomer
e
length
(TL)
in
vertebr
ates.
qPCR,
quantita
tiv
e
polymer
ase
chain
rea
ction;
TRF
,
telomer
e
res
triction
fragments;
n.s.,
not
significant
;
MZ,
monozygotic
twins;
DZ,
dizygotic
twins.
ref. species method Pa rent and offspring age at sampling contr olled for? Par ental age at conception contr olled for? Envir onment contr olled for? sta tis tics N a h 2 (95% CI) d [42] human Homo sapiens South ern blot yes: twins sampled at 4, 17 and 44 years no yes: shar ed envir onment MZ twins DZ twins 59 56 0.78 (0.69 – 0.87) 0.78 (0.69 – 0.87) [43] human Homo sapiens South ern blot yes: age as a co varia te no no linear mixed model (twin da ta) 47 0.84 [44] human Homo sapiens South ern blot yes: age-adjus ted telomer e length no telomer e length adjus ted for smoking fa ther – son fa ther – daughter mother – son mother – daughter sis ter – sis ter sis ter – br other br other – br other34 47 51 71 22 25 23 n.s. 1.20 0.82 1.18 1.22 1.42 1.66
[45] human Homo sapiens South ern blot no no no MZ twins (73 – 79 yr) DZ twins (73 – 79 yr) MZ twins (80 – 94 yr) DZ twins (80 – 94 yr) MZ twins (73 – 94 yr) DZ twins (73 – 94 yr)
89 114 39 45 128 159 0.31 0.54 0.34 n.s. 0.32 0.50
yes: age as a co varia te no yes: non-shar ed envir onment biometric model (twin da ta) 287 0.36 (0.22 – 0.48) [46] human Homo sapiens South ern blot yes: age as a co varia te no no not sta ted (sibling da ta) 383 adults /258 sib pairs 0.82 (0.59 – 1.05) [47] human Homo sapiens qPCR yes: age-adjus ted telomer e length yes: adjus ted for par ental ag e at birth no fa ther – offspring fa ther – son fa ther – daughter mother – offspring mother – son mother – daughter
42 20 22 41 18 23 1.13 1.08 1.21 n.s. n.s. n.s.
Table
1.
(
Continued.
)
ref.
species
method
Par
ent
and
offspring
age
at
sampling
contr
olled
for?
Par
ental
age
at
conception contr
olled
for?
Envir
onment
contr
olled
for?
sta
tis
tics
N
a
h
2 (95%
CI)
d
[48]
human Homo
sapiens
Southern
blot
yes:
age
as
a
co
varia
te
no
yes:
shar
ed
familial
envir
onment
structur
al
equa
tion
model
(twin
da
ta)
1025
0.36
(0.18
–
0.48)
[49]
human Homo
sapiens
qPCR
yes:
age-adjus
ted
telomer
e
length
no
no
fa
ther
–
son
fa
ther
–
daughter
mother
–
son
mother
–
da
ughter
62 102 63 105 1.12 0.86 n.s. n.s.
yes:
age
as
co
varia
te
no
yes:
envir
onmental
risk
fa
ctors
(e.g.
age
and
se
x)
‘animal’
model
907
0.44
(0.32
–
0.56)
[50]
human Homo
sapiens
Southern
blot
yes:
age-adjus
ted
telomer
e
length
no
yes:
shar
ed
and
individual
envir
onment
linear
mixed
mo
del
(twin
da
ta)
306
n.s.
[51]
human Homo
sapiens
Southern
blot
no
no
no
linear
mixed
mo
del
(twin
da
ta)
175
0.56
(0.42
–
0.67)
[52]
human Homo
sapiens
qPCR
no
no
no
par
ent
–
offspring
(centenarian
par
ents)
86
0.86
[53]
human Homo
sapiens
qPCR
yes:
age-adjus
ted
telomer
e
length
no
no
fa
ther
–
son
fa
ther
–
daughter
mother
–
son
mother
–
da
ughter
gr
andpar
ent
–
gr
andchild
51 47 57 72 85 0.93 0.97 n.s. 0.59 1.09
[54]
human Homo
sapiens
qPCR
yes:
age-adjus
ted
telomer
e
length
yes:
adjus
ted
for
par
ental
age
no
par
ent
–
offspring:
leuk
ocytes
CD34
þ
cells
mononuclear
cells
buccal
cells
not
sta
ted
0.90 0.79 1.09 0.74
[55]
human Homo
sapiens
qPCR
yes:
age
as
co
varia
te
no
yes:
cohort
as
co
varia
te
par
ent
–
offspring
41
1.32
(
Continued.
)
rs
tb.r
oy
alsocietypublishing.org
Phil.
Trans.
R.
Soc.
B
373
:20160450
[image:5.595.94.514.45.801.2]Table 1. ( Continued. ) ref. species method Par ent and offspring age at sampling contr olled for? Par ental age at conception contr olled for? Envir onment contr olled for? sta tis tics N a h 2 (95% CI) d [56] human Homo sapiens qPCR yes: age-adjus ted telomer e length no no siblings MZ twins DZ twins fa ther – son fa ther – daughter mother – son mother – da ughter
1553 2534 2172 791 882 850 1005 0.98 0.69 1.00 0.68 0.66 0.84 0.84
yes: age as co varia te no no meta-analy sis (based on es tima tes from 6 ‘animal’ models) 19 713 0.70 (0.64 – 0.76) [57] human Homo sapiens qPCR yes: age as co varia te no yes: educa tion, site, smoking, alcohol consumption and marital sta tus as co varia tes animal model: all da ta males females 4289 1927 2362
[image:6.595.111.499.31.796.2]Table 1. ( Continued. ) ref. species method Par ent and offspring age at sampling contr olled for? Par ental age at conception contr olled for? Envir onment contr olled for? sta tis tics N a h 2 (95% CI) d [63] human Homo sapiens qPCR yes: age as co varia te no yes: educa tion, site, smoking, alcohol consumption and marital sta tus as co varia tes animal model: all da ta fa thers & offspring mothers & offspring fa thers & male offspring fa thers & female offspring mothers & male offspring mothers & female offspring
3040 3404 3568 1855 2147 2016 2311
0.54 (0.47 – 0.61) 0.67 (0.58 – 0.76) 0.61 (0.52 – 0.69) 0.65 (0.52 – 0.79) 0.62 (0.50 – 0.74) 0.57 (0.44 – 0.69) 0.53 (0.42 – 0.63) [64] human Homo sapiens not st ated yes: age-adjus ted telomer e length no no MZ twins 210 0.88 [65] human Homo sapiens qPCR yes: age as co varia te no yes: educa tion as co varia te ‘animal’ model with SNP-based rela tedness 3290 0.28 (0.03 – 0.53) [66] human Homo sapiens qPCR yes: age-adjus ted telomer e length no no pairwise familial corr ela tions 1780 0.63 [67] human Homo sapiens Southern blot no: babies , 2 w eek old, and mothers with babies with Do wn syndr ome or contr ol babies w er e aged ma tched no no mother – offspring with Do wn syndr ome (MI) mother – offspring with Do wn syndr ome (MII) mother – offspring (contr ol gr oup)
106 64 186
2 0.12 ( 2 0.15 to 2 0.09) 2 0.13 ( 2 0.16 to 2 0.11) 2 0.16 ( 2 0.20 to 2 0.11) [68] kakapo, Strigops habr optilus Southern blot no: but no TL – age corr ela tion no no mother – offspring mother – da ughter mother – son fa ther – offspring fa ther – daughter fa ther – son
29 19 10 26 18 8 0.84 n.s. 1.53 n.s. n.s. n.s.
[image:7.595.91.526.54.794.2]Table 1. ( Continued. ) ref. species method Par ent and offspring age at sampling contr olled for? Par ental age at conception contr olled for? Envir onment contr olled for? sta tis tics N a h 2 (95% CI) d [70] collar ed flyca tcher, Ficedula albicollis qPCR yes: nes tlings sampled at da y 12 no yes: cr oss-fos ter br ood triplet ‘animal’ model with cr oss-fos ter ed siblings 359 0.09 ( 2 0.04 – 0.15) [71] King penguin,
Aptenodytes patagonicus
qPCR no: chicks measur ed at da y 10, but par ents during br ooding no no mid-par ent – offspring mother – offspring 53 53 0.2 ( 2 0.02 – 0.42) 0.2 (0.01 – 0.39) [31] gr ea t reed w arbler, Acr ocephalus arundina ceus qPCR yes: TL measur ed at da ys 8 – 10 no no mother – mid-offspring mother – mid-daughter mother – mid-son fa ther – mid-offspring fa ther – mid-daughter fa ther – mid-son
17 17 17 19 19 19 1.08 1.12 (0.34 – 1.90) 1.38 (0.40 – 2.36)
n.s. n.s. n.s.
yes: ma ternal age (pa ternal age had no significant effect) yes: ma ternal identity b ‘animal’ model 193 0.48 (0.24 – 0.72) [72] zebr a finch, Taeniopygia gutta ta TRF yes: log(age) as co varia te no yes: family , m aternal or pa ternal identity
full-sibling maternal
half-sibling
pa
ternal
half-sibling
42 8 18
1.18 (0.46 – 1.90) 1.35 ( 2 1.04 – 3.74) 0.93 ( 2 0.27 – 2.13) no c ‘animal’ model with cr oss-fos ter ed siblings 125 0.999 (0.87 – 1.00) [73] white-thr oa ted dipper, Cinclus cinclus qPCR yes: nes tling ag e at sampling as co varia te no no mother – mid-offspring fa ther – mid-offspring mother – mid-offspring fa ther – mid-offspring
59 59 59 59
[image:8.595.81.508.42.800.2]effects are especially pronounced during early development, including prior to birth/hatching [75,76], having measures from the zygote just after conception would minimize environmental effects, but this is clearly not very feasible.
Ironically, even measuring the telomeres of newly con-ceived zygotes would not eliminate all age-related effects. Although the initial length of an individual’s telomeres may largely be determined by genetic factors within the individual, parental effects may also play a role and cause trans-generational effects, e.g. if the age of a parent influences offspring telomere length. The effects of paternal age at con-ception (PAC) on offspring telomere length have been widely reported in humans, with older fathers having offspring with longer telomeres [56]. The evidence suggests that this is due to sperm from older males having longer telomeres, either because of age-related selection of germline stem cells or the elongation of telomeres because of telomerase activity [77]. Thus, zygotes produced by such sperm from older males have longer telomeres. In other vertebrates, the evi-dence of PAC effects are mixed, with negative effects detected [69] or not [31], along with positive maternal age effects [31]. However, many studies are cross-sectional, so selective disappearance may result in, or strengthen, positive correlations. Additionally, the environment experienced by the parent may impact on parental age patterns or influence initial offspring telomere length irrespective of parental age [38]. If such non-genetic trans-generational effects do influ-ence initial zygote length they will also confound our measures of telomere heritability unless controlled for.
5. Quantitative genetic techniques
Individual variation in telomere length can be decomposed into the relative variance due to genetic and environmental factors using quantitative genetic techniques [34,35]. The extent to which phenotypes are genetically determined (i.e. heritable) is analysed by examining the phenotypic similarity between relatives. Currently, the most commonly applied technique to estimate the heritability of telomere length is univariate regression analysis [72], but key assumptions of
this technique are often overlooked. For example, parent–off-spring regressions do not always account for repeated measures of parents that have multiple offspring. Most importantly, relatives often live in more similar environments than non-relatives and share common environmental effects, which can result in relatives having similar telomere lengths for reasons other than genetic effects [1]. Unless this environ-mental similarity is partitioned from the genetic effects, this will severely confound heritability estimates and lead to over-estimations. Cross-fostering is a useful tool that facilitates the separation of genetic from environmental effects. In particu-lar, cross-fostering enables better resolution of additive genetic effects, as it allows the separation (via modelling) of the foster (early-life environmental) and natal (genetic and pre-fostering environmental effects) in addition to additive genetic effect.
More sophisticated mixed model techniques allow separ-ation of phenotypic variance into individual and residual variance components (which allows calculation of repeatabil-ity [78]), when multiple telomere measures from the same individuals are available (figure 1b, Model 3). These mixed models can then be extended into ‘animal’ models that use family trees with different types of relatives (grandparent – grandoffspring, aunts –nieces, etc.) to separate the individual variance into genetic and permanent environment (environ-mental effects that are consistent over an individual’s repeated measures) components [36] (figure 1b, Model 4). These variance components can then be used to calculate narrow-sense heritability (h2; the proportion of phenotypic
variance due to additive genetic effects). In the simplest form, h2¼V
A/VP, where VA is variance due to additive
genetic effects and VP is phenotypic variance (VP¼VAþ
VPEþVR, where VPE is permanent environment variance
and VR is the residual variance that is usually a result of
other environmental effects [34,35] (figure 1b, Model 4). If permanent environment effects are not incorporated this will result in inflated heritability estimates [1]. Shared environmental effects, such as maternal, paternal, nest, cohort and spatial effects can also be confounded with other variance components (figure 1b, Model 5), such asVA
if they are not specified separately [1,36].
Quantitative genetic ‘animal’ models can also be extended to calculate GE or Genotype by Age (GAge) effects, when additive genetic effects vary across environments or with age. A random regression ‘animal’ model [79] allows the slope of a genotype to vary across an axis of environment or age. For example, this would, when applied to repeated telomere length data over the lifetimes of individuals, allow the testing of whether telomere shortening-rates differ according to genotypes. GE or GAge models require very large sample sizes, but have been run successfully on traits in natural populations [25].
Quantitative genetic techniques primarily assume addi-tive effects of many genes, however, dominance effects such as inbreeding can impact telomere length, as observed in the Seychelles warbler [32]. If dominant effects are not mod-elled, they can be confounded in other variance components, e.g. increasing both VA and VR [80]. However, very large
sample sizes, 20 more than that required for estimating
VA, are required to estimate dominance variances accurately
[80,81]. Estimation of dominance variance has been under-taken by animal/plant breeders, but is also theoretically achievable in natural populations [82].
birth 0.4 0.5 0.6 0.7 0.8
relative LTL
0.9 1.0 1.1 1.2
[image:9.595.59.258.38.236.2]4 16 28 40 52 64 76 88 100 112 age
Figure 3.
Leukocyte telomere length (LTL) dynamics for 11 female Soay
sheep,
Ovis aries
, measured twice as lambs and at least six further times
thereafter during their lives. Each colour and symbol combination represents
a different individual. Adapted from [20].
rs
tb.r
oy
alsocietypublishing.org
Phil.
Trans.
R.
Soc.
B
373
:20160450
6. Past studies
Here we review published studies on the heritability of telomere variation in laboratory and natural vertebrate popu-lations, including humans (table 1). Unravelling the role of genetic and environmental effects on similarity in telomere variation in natural populations is difficult, but potentially most important from an evolutionary and ecological perspec-tive. No clear overall patterns are yet emerging. Some studies have reported significantly higher paternal than maternal heritability of telomere length [49,53,69], the opposite effect [56], X-linked [44], no effect [63,72,73], or have found herit-ability from mother-offspring but not father-offspring regressions [31,68,71], or the opposite effect [47], but have not tested for a significant difference in slopes. The only clear pattern is that there is extensive variation (from 0 to 1!) in the estimates of telomere length heritability (table 1). Indeed, even within a single species (i.e. humans, the species in which most studies have been undertaken) heritability estimates vary massively. However very few, if any, of the studies undertaken so far are without considerable limitations or problems.
The variation in estimates of telomere length heritability may, to some extent, be attributed to methodological issues. First, many studies apply basic regression analyses [72], with all of the problems that this entails, such as confounding genetic and environmental effects. Using twin studies, as often undertaken in humans (table 1) does not fully resolve this problem (see section 7). Secondly, despite the fact that tel-omeres change with age (see section 4) studies normally sample parents and offspring at different ages (i.e. as adults and juveniles, respectively), especially in long-lived organisms. Many human studies have attempted to statistically control for parent/offspring age, by including age as a covariate or cor-recting telomere length for age (but this does not allow for the expected nonlinear relationship), and very few also control for parental age at conception (but see [31,47,54,60,61]). In other species, age has also rarely been fully controlled for (table 1). Clearly, it would be better to sample parents and off-spring at the same age (see section 4). One excellent study on great reed warblers that did sample both parents and offspring at the same age (8–10 days) found moderate heritability [31]. All the other non-human studies had shortcomings as they did not control for offspring and parental age at sampling, used an age-adjusted telomere length and/or only included offspring age, and sometimes parental age, as a covariate in the model (table 1). Thirdly, despite the fact that environ-mental effects can vary spatially and temporally (see section three), few studies have accounted for this in their analyses (table 1). The one study undertaken under controlled labora-tory conditions (thus reducing environmental variation) also reduced shared environmental effects through cross-fostering and reported a heritability value of 1 [72]. The very high herit-ability estimate in this case is perhaps not surprising, because once environmental variation is minimized the rest of the vari-ation must be due to genetic effects. However, heritability estimates taken under such conditions are of minimal use to biologists wanting to understand the evolutionary and ecologi-cal significance of telomere variation. Spatio-temporal variation in environmental effects may be particularly impor-tant when estimating heritability in species either with long generation times, living in rapidly changing environments, or that exist across a range of different environments. In
humans, it is interesting to consider how much of the variation in heritability estimates may be due to differences in the environments in which the subjects of each study lived. In the case of parent/offspring studies in humans, how much the environment changed between generations may also be very important. One would not expect much correlation between the telomere length of offspring and parents if the two generations developed under very different environ-mental conditions, even if sampled at the same age. Another important issue in estimating telomere heritability is that ‘animal’ models are required to separate genetic and environ-mental effects, and these models require large sample sizes. For example, the seven human studies that applied ‘animal’ models had sample sizes greater than 900 (table 1), whereas two of the four studies in non-human populations that have used ‘animal’ models had models that did not converge when environmental effects were included (table 1); with less than 230 phenotyped individuals and the one study that attempted more sophisticated sex-linkage models was severely underpowered [73]. The exact sample size required to separate environmental from genetic effects depends on data structure, but samples of an order of magnitude higher than the norm in previous non-human studies are probably required for mean-ingful results. Fourthly, GE effects may occur and these have not yet been tested for in any quantitative genetic ana-lyses of telomere length in vertebrate studies. Fifthly, the technique used to assay telomere length may, or may not, include interstitial telomeres (table 1), and it is not known how this affects heritability estimates [72].
The limitations identified in these studies of telomere length will also apply to studies on the heritability of telomere shortening. Currently, the heritability of telomere attrition has only been investigated with twin data [62,84], which has methodological problems [85] (see section 7). Studies that take a GE approach are desperately needed to improve our understanding of the evolution of telomere dynamics.
7. Potential solutions and their problems
First, do not use simple parent–offspring or sibling regressions when relatives share environmental components as this will inflate heritability estimates [1]. Even in studies comparing monozygotic and dizygotic twins this can be a problem; the similarity difference between these types of twins is assumed to be attributed to greater genetic similarity of monozygotic twins, however, the environmental similarity of monozygotic and dizygotic twins is rarely the same [85]. Rather, studies care-fully measuring both relatedness and environmental similarity across individuals, and then using analytical methods such as ‘animal’ models [36] to separate genetic from environmental variance components, should be used.
Second, control for the age at which all individuals are sampled (accounting for any measurement effects due to length of storage, extraction or batch differences). Sampling both offspring and adults at the same age will standardize the environmental exposure each party has endured prior to sampling, though clearly the environmental impact could differ for each individual. Sampling all parties as young as possible appears attractive as it should minimize environ-mental influence. However, there may be situations where it is of interest to measure heritability at different time points. For example, heritability estimates calculated from
rs
tb.r
oy
alsocietypublishing.org
Phil.
Trans.
R.
Soc.
B
373
:20160450
samples taken from offspring and parents when they are both a given adult age will include more information about the genetic basis of resistance to telomere attrition and/or telo-mere restoration mechanisms, not just initial telotelo-mere length. Measuring how additive genetic variance changes with age is also required to improve understanding of the evolution of senescence [86]. When to sample, therefore, depends very much on what you want to understand.
Third, both physical and analytical means can be used to separate environmental and genetic effects. Cross-fostering can create situations where relatives are raised in different environments. However, individuals will still experience simi-lar environments from conception until cross-fostering, for example, any maternal effects in terms of prenatal investment [1]. Fortunately, in many species a female’s offspring may be fertilized by multiple males, often within a single litter/ clutch [87]. Even within socially monogamous species extra-pair paternity often occurs [88]. These cases result in offspring from multiple paternal origins, but with the same mother, living under the same conditions and in offspring from the same father but with different mothers, being raised in differ-ent environmdiffer-ents. These differences provide statistical power to separate genetic and environmental variance components. Indeed, systems where polyandry is frequent and can be com-bined with cross-fostering at an early stage would provide the most power to resolve effects. Though clearly in some species, e.g. humans, deliberate cross-fostering is not an option!
Although ‘animal’ models provide analytical solutions to separate variance components, as already stated they do require large sample sizes [89]. The exact sample size required to have sufficient power to detect a given heritability value depends on many factors, including: the number of related individuals in the pedigree, the number of pedigreed individ-uals that have been phenotyped, the pedigree structure (e.g. pedigree depth, completeness and family sizes) and the confi-dence with which relationships have been assigned in the pedigree (e.g. have extra-pair paternities been accounted for? [90]). It is, therefore, not possible to provide universal guide-lines on the sample size required to detect heritability. Accurate heritability estimates may, in certain cases, be esti-mable from a hundred individuals [2], however, in most cases, samples of an order of magnitude higher than this— and than used in previous non-human studies—are probably required. Importantly, studies must provide sample sizes of the number of phenotyped individuals in the pedigree, the number of phenotyped individuals with repeat measures and the pruned pedigree size (i.e. where uninformative indi-viduals are removed) to allow basic comparisons between studies. Additionally, given that datasets are so variable, the statistical power with which each dataset can detect heritabil-ity of a given value [91] should always be reported. Sensitivheritabil-ity analyses can also be run to investigate the impact of particular errors on parameter estimates [89].
Fourthly, to detect GE or GAge effects, function-valued trait approaches [92] can be used, or random regression ‘animal’ models (where the slope of the genotype is allowed to vary over environments [41]). Models need to be built in a hierarchical process, first testing for individual
environment effects and then comparing with a GE/G
Age model. However, detecting GE/GAge requires
data from individuals experiencing variable or different environments over their lifetimes and very large sample sizes. Currently, no published study has tested for GE effects of telomere length, although GE and GAge effects have been estimated for other traits in natural vertebrate populations (e.g. [25]).
Finally, a general problem with quantitative genetic studies is a lack of consistency in the way in which parameter esti-mates are presented [25]. Variance components need to be presented in standard hierarchical models [41] to illustrate the way in which variance components are confounded, depending on model specification (figure 1b). This then facili-tates cross-species comparisons. Importantly, all variance estimates, and the confidence intervals around these, should be reported from all of the models run, so that shifts in var-iance components can be easily compared between models. Furthermore, the inclusion of covariates can alter heritability estimates from ‘animal’ models, so covariates must be clearly specified [93]. Additionally, measurement error, such as obser-ver bias or batch effect, may need to be controlled for. For example, when measuring telomere lengths using quantitative PCR (qPCR) or telomere restriction fragment (TRF) methods plate or gel effects, respectively, can potentially affect variance components and need to be properly modelled. Once the appropriate models are run, providing a standardized estimate of the additive genetic variance, through a measure of evolva-bility (IA),VA/m2, whereVAis scaled by the population mean
telomere length m, facilitates comparison across populations with different mean telomere lengths, given variation scales with the mean [83].
8. Conclusion
Having accurate estimates of the heritability of telomere variation in natural populations is fundamental to our under-standing of the evolutionary and ecological importance of telomeres. Environmental effects on telomere length can be complex and extensive and contribute significantly to the lack of clarity and consensus from studies that have attempted to estimate the heritability of telomeres so far. Only by fully understanding the nature and timing of environmental effects, and then controlling for them, can we get accurate and meaningful measures of the heritability of telomere length. While there are many difficulties associ-ated with doing this in natural populations there are potential methodological and analytical solutions. To be successful, future studies need to be carefully designed in terms of sampling individuals and ensuring sufficient power to use these solutions. Finally, future studies must present their sample sizes and results in a standard way to facilitate meta-analyses so we can gain a more universal understanding of the causes and consequences of telomere variation.
Data accessibility.This article has no data.
Competing interests.We declare we have no competing interests. Funding.This work was funded by a Natural Environment Research Council grant to D.S.R. (NE/K005502/1) and to H.D. and D.S.R. (NE/P011284/1). Dan Nussey and two anonymous reviewers provided helpful comments on the manuscript.
rs
tb.r
oy
alsocietypublishing.org
Phil.
Trans.
R.
Soc.
B
373
:20160450
References
1. Kruuk LEB, Hadfield JD. 2007 How to separate
genetic and environmental causes of similarity
between relatives.J. Evol. Biol.20, 1890 – 1903.
(doi:10.1111/j.1420-9101.2007.01377.x)
2. Wilson AJ, Re´ale D, Clements MN, Morrissey MM,
Postma E, Walling CA, Kruuk LEB, Nussey DH. 2010
An ecologist’s guide to the animal model.J. Anim.
Ecol.79, 13 – 26. (doi:10.1111/j.1365-2656.2009.
01639.x)
3. Monaghan P. 2010 Telomeres and life histories: the
long and the short of it.Ann. NY Acad. Sci.1206,
130 – 142. (doi:10.1111/j.1749-6632.2010.05705.x)
4. Olsson M, Wapstra E, Friesen CR. 2017 Evolutionary
ecology of telomeres: a review.Ann. NY Acad. Sci.
350, 569. (doi:10.1111/nyas.13443)
5. Blackburn EH. 1991 Structure and function of
telomeres.Nature350, 569 – 573. (doi:10.1038/
350569a0)
6. Levy MZ, Allsopp RC, Futcher AB, Greider CW, Harley
CB. 1992 Telomere end-replication problem and cell
aging.J. Mol. Biol.225, 951 – 960. (doi:10.1016/
0022-2836(92)90096-3)
7. Zglinicki T. 2002 Oxidative stress shortens telomeres.
Trends Biochem. Sci.27, 339 – 344. (doi:10.1016/
S0968-0004(02)02110-2)
8. Olovnikov AM. 1996 Telomeres, telomerase, and
aging: origin of the theory.Exp. Geront.31,
443 – 448. (doi:10.1016/0531-5565(96)00005-8)
9. Costantini D, Marasco V, Møller AP. 2011 A
meta-analysis of glucocorticoids as modulators of
oxidative stress in vertebrates.J. Comp. Physiol. B
181, 477 – 556. (doi:10.1007/s00360-011-0566-2)
10. Nettle D, Monaghan P, Gillespie R, Brilot B, Bedford T, Bateson M. 2015 An experimental demonstration that early-life competitive disadvantage accelerates
telomere loss.Proc. R. Soc. B282, 20141610.
(doi:10.1098/rspb.2014.1610)
11. Kotrschal A, Ilmonen P, Penn DJ. 2007 Stress
impacts telomere dynamics.Biol. Lett.3, 128 – 130.
(doi:10.1098/rsbl.2006.0594)
12. Greider CW, Blackburn EH. 1989 A telomeric
sequence in the RNA ofTetrahymenatelomerase
required for telomere repeat synthesis.Nature337,
331 – 337. (doi:10.1038/337331a0)
13. Gomes NMVet al.2011 Comparative biology of
mammalian telomeres: hypotheses on ancestral states and the roles of telomeres in longevity
determination.Aging Cell10, 761 – 768. (doi:10.
1111/j.1474-9726.2011.00718.x)
14. Campisi J. 2005 Senescent cells, tumor suppression, and organismal aging: good citizens, bad
neighbors.Cell120, 513 – 522. (doi:10.1016/j.cell.
2005.02.003)
15. Harley CB, Vaziri H, Counter CM, Allsopp RC. 1992
The telomere hypothesis of cellular aging.Exp.
Geront.27, 375 – 382.
(doi:10.1016/0531-5565(92)90068-B)
16. Wong JM, Collins K. 2003 Telomere maintenance
and disease.The Lancet362, 983 – 988. (doi:10.
1016/S0140-6736(03)14369-3)
17. Barrett ELB, Richardson DS. 2011 Sex differences in
telomeres and lifespan.Aging Cell10, 913 – 921.
(doi:10.1111/j.1474-9726.2011.00741.x) 18. Dantzer B, Fletcher QE. 2015 Telomeres shorten
more slowly in slow-aging wild animals than in
fast-aging ones.Exp. Geront.71, 38 – 47. (doi:10.
1016/j.exger.2015.08.012)
19. Barrett EL. B., Burke TA, Hammers M, Komdeur J, Richardson DS. 2013 Telomere length and dynamics
predict mortality in a wild longitudinal study.Mol.
Ecol.22, 249 – 259. (doi:10.1111/mec.12110)
20. Fairlie J, Holland R, Pilkington JG, Pemberton JM, Harrington L, Nussey DH. 2016 Lifelong leukocyte telomere dynamics and survival in a free-living
mammal.Aging Cell15, 140 – 148. (doi:10.1111/
acel.12417)
21. Haussmann MF, Winkler DW, Vleck CM. 2005 Longer telomeres associated with higher survival in birds.
Biol. Lett.1, 212 – 214. (doi:10.1098/rsbl.2005.0301)
22. Wilbourn RV, Moatt JP, Froy H, Walling CA, Nussey DH, Boonekamp JJ. 2018 The relationship between telomere length and mortality risk in non-model
vertebrate systems: a meta-analysis.Phil. Trans. R. Soc.
B373, 20160447. (doi:10.1098/rstb.2016.0447)
23. Simons MJP. 2015 Questioning causal involvement
of telomeres in aging.Ageing Res. Rev.24,
191 – 196. (doi:10.1016/j.arr.2015.08.002) 24. Young AJ. 2018 The role of telomeres in the
mechanisms and evolution of life-history trade-offs
and ageing.Phil. Trans. R. Soc. B373, 20160452.
(doi:10.1098/rstb.2016.0452)
25. Charmantier A, Brommer JE, Nussey DH. 2014 The quantitative genetics of senescence in wild animals.
InQuantitative genetics in the wild(eds A
Charmantier, D Garant, LEB Kruuk), pp. 68 – 83. Oxford, UK: Oxford University Press.
26. Blackburn EH, Epel ES, Lin J. 2015 Human telomere biology: a contributory and interactive factor in
aging, disease risks, and protection.Science350,
1193 – 1198. (doi:10.1126/science.aab3389) 27. Monaghan P. 2014 Organismal stress, telomeres and
life histories.J. Exp. Biol.217, 57 – 66. (doi:10.
1242/jeb.090043)
28. Monaghan P, Ozanne SE. 2018 Somatic growth and telomere dynamics in vertebrates: relationships,
mechanisms and consequences.Phil. Trans. R. Soc.
B373, 20160446. (doi:10.1098/rstb.2016.0446)
29. Bateson M. 2015 Cumulative stress in research animals: telomere attrition as a biomarker in a
welfare context?Bioessays38, 201 – 212. (doi:10.
1002/bies.201500127)
30. Spurgin LG, Bebbington K, Fairfield EA, Hammers M, Komdeur J, Burke T, Dugdale HL, Richardson DS. 2017 Spatio-temporal variation in lifelong telomere
dynamics in a long-term ecological study.J. Anim.
Ecol.00, 1 – 12. (doi:10.1111/1365-2656.12741)
31. Asghar M, Bensch S, Tarka M, Hansson B, Hasselquist D. 2015 Maternal and genetic factors
determine early life telomere length.Proc. R. Soc. B
282, 20142263. (doi:10.1098/rspb.2014.2263)
32. Bebbington K, Spurgin LG, Fairfield EA, Dugdale HL, Komdeur J, Burke T, Richardson DS. 2016 Telomere length reveals cumulative individual and transgenerational inbreeding effects in a passerine
bird.Mol. Ecol.25, 2949–2960. (doi:10.1111/
mec.13670)
33. Hill WG. 2010 Understanding and using quantitative
genetic variation.Phil. Trans. R. Soc. B365, 73 – 85.
(doi:10.1098/rstb.2009.0203)
34. Lynch M, Walsh B. 1998Genetics and analysis of
quantitative traits. Sunderland, MA: Sinauer Associates.
35. Falconer DS, Mackay TF. C. 1996Introduction to
quantitative genetics, 4th edn. Harlow, UK: Longman. 36. Kruuk LEB. 2004 Estimating genetic parameters in
natural populations using the ‘animal model’.Phil.
Trans. R. Soc. Lond. B359, 873 – 890. (doi:10.1098/
rstb.2003.1437)
37. Watson H, Bolton M, Monaghan P. 2015 Variation in early-life telomere dynamics in a long-lived bird: links
to environmental conditions and survival.J. Exp. Biol.
218, 668 – 674. (doi:10.1242/jeb.104265)
38. McLennan D, Armstrong JD, Stewart DC, Mckelvey S, Boner W, Monaghan P, Metcalfe NB. 2016 Interactions between parental traits, environmental harshness and growth rate in determining telomere
length in wild juvenile salmon.Mol. Ecol.25,
5425 – 5438. (doi:10.1111/mec.13857)
39. Boonekamp JJ, Mulder GA, Salomons HM, Dijkstra C, Verhulst S. 2014 Nestling telomere shortening, but not telomere length, reflects developmental stress
and predicts survival in wild birds.Proc. R. Soc. B
281, 20133287. (doi:10.1098/rspb.2013.3287)
40. Adams MJ, Robinson MR, Mannarelli ME, Hatchwell BJ. 2015 Social genetic and social environment effects on parental and helper care in a
cooperatively breeding bird.Proc. R. Soc. B282,
20150689. (doi:10.1098/rspb.2015.0689) 41. Nussey DH, Wilson AJ, Brommer JE. 2007 The
evolutionary ecology of individual phenotypic
plasticity in wild populations.J. Evol. Biol.20,
831 – 844. (doi:10.1111/j.1420-9101.2007.01300.x) 42. Slagboom PE, Droog S, Boomsma DI. 1994 Genetic
determination of telomere size in humans: a twin
study of three age groups.Am. J. Hum. Genet.55,
876 – 882.
43. Jeanclos E, Schork NJ, Kyvik KO, Kimura M, Skurnick JH, Aviv A. 2000 Telomere length inversely correlates with pulse pressure and is highly familial.
Hypertension36, 195 – 200. (doi:10.1161/01.HYP.36.
2.195)
44. Nawrot TS, Staessen JA, Gardner JP, Aviv A. 2004 Telomere length and possible link to X
chromosome.The Lancet363, 507 – 510. (doi:10.
1016/S0140-6736(04)15535-9)
45. Bischoff C, Graakjaer J, Petersen HC, Hjelmborg BJ, Vaupel JW, Bohr V, Koelvraa S, Christensen K. 2005 The heritability of telomere length among the
elderly and oldest-old.Twin Res. Hum. Genet.8,
433 – 439. (doi:10.1375/twin.8.5.433)
rs
tb.r
oy
alsocietypublishing.org
Phil.
Trans.
R.
Soc.
B
373
:20160450
46. Vasa-Nicotera Met al.2005 Mapping of a major locus that determines telomere length in humans.
Am. J. Hum. Genet.76, 147 – 151. (doi:10.1086/
426734)
47. Nordfjall K, Larefalk A, Lindgren P, Holmberg D, Roos G. 2005 Telomere length and heredity:
indications of paternal inheritance.Proc. Natl Acad.
Sci. USA102, 16 374 – 16 378. (doi:10.1073/pnas.
0501724102)
48. Andrew Tet al.2006 Mapping genetic loci that
determine leukocyte telomere length in a large sample of unselected female sibling pairs.
Am. J. Hum. Genet.78, 480 – 486. (doi:10.1086/
500052)
49. Njajou OTet al.2007 Telomere length is paternally
inherited and is associated with parental lifespan.
Proc. Natl Acad. Sci. USA104, 12 135 – 12 139.
(doi:10.1073/pnas.0702703104)
50. Huda N, Tanaka H, Herbert B-S, Reed T, Gilley D. 2007 Shared environmental factors associated with telomere length maintenance in elderly male twins.
Aging Cell6, 709 – 713. (doi:10.1111/j.1474-9726.
2007.00330.x)
51. Bakaysa SL, Mucci LA, Slagboom PE, Boomsma DI, McClearn GE, Johansson B, Pedersen NL. 2007 Telomere length predicts survival independent of
genetic influences.Aging Cell6, 769 – 774. (doi:10.
1111/j.1474-9726.2007.00340.x)
52. Atzmon Get al.2010 Genetic variation in human
telomerase is associated with telomere length
in Ashkenazi centenarians.Proc. Natl Acad. Sci.
USA107, 1710 – 1717. (doi:10.1073/pnas.
0906191106)
53. Nordfjall K, Svenson U, Norrback K-F, Adolfsson R, Roos G. 2010 Large-scale parent – child comparison confirms a strong paternal influence on telomere
length.Eur. J. Hum. Genet.18, 385 – 389. (doi:10.
1038/ejhg.2009.178)
54. Wong LSM, Huzen J, de Boer RA, van Gilst WH, van Veldhuisen DJ, van der Harst P. 2011 Telomere length of circulating leukocyte subpopulations and buccal cells in patients with ischemic heart failure
and their offspring.PLoS ONE6, e23118. (doi:10.
1371/journal.pone.0023118)
55. Al-Attas OS, Al-Daghri NM, Alokail MS, Alkharfy KM, Alfadda AA, McTernan P, Gibson GC, Sabico SB, Chrousos GP. 2012 Circulating leukocyte telomere length is highly heritable among families of Arab
descent.BMC Med. Genet.13, 76. (doi:10.1186/
1471-2350-13-38)
56. Broer Let al.2013 Meta-analysis of telomere length
in 19,713 subjects reveals high heritability, stronger maternal inheritance and a paternal age effect.
Eur. J. Hum. Genet.21, 1163 – 1168. (doi:10.1038/
ejhg.2012.303)
57. Lee JHet al.2014 Genome wide association and
linkage analyses identified three loci—4q25, 17q23.2, and 10q11.21—associated with variation in leukocyte telomere length: the Long Life Family
Study.Front. Genet.4, 310. (doi:10.3389/fgene.
2013.00310)
58. Zhu Yet al.2013 QTL mapping of leukocyte
telomere length in American Indians: the strong
heart family study.Aging5, 704 – 716. (doi:10.
18632/aging.100600)
59. Blackburn Net al.2014 A retrospective examination
of mean relative telomere length in the Tasmanian
familial hematological malignancies study.Oncol.
Rep.33, 25 – 32. (doi:10.3892/or.2014.3568)
60. Bijnens E, Zeegers MP, Gielen M, Kicinski M, Hageman GJ, Pachen D, Derom C, Vlietinck R, Nawrot TS. 2015 Lower placental telomere length may be attributed to maternal residential traffic
exposure; a twin study.Environ. Int.79, 1 – 7.
(doi:10.1016/j.envint.2015.02.008)
61. Costa DS, Rosa DVF, Barros AGA, Romano-Silva MA, Malloy-Diniz LF, Mattos P, de Miranda DM. 2015 Telomere length is highly inherited and associated with hyperactivity-impulsivity in children with attention deficit/hyperactivity
disorder.Front Mol. Neurosci.8, 28. (doi:10.3389/
fnmol.2015.00028)
62. Hjelmborg JB, Dalga˚rd C, Mo¨ller S, Steenstrup T,
Kimura M, Christensen K, Kyvik KO, Aviv A. 2015 The heritability of leucocyte telomere length dynamics.
J. Med. Genet.52, 297 – 302. (doi:10.1136/
jmedgenet-2014-102736)
63. Honig LSet al.2015 Heritability of telomere length
in a study of long-lived families.Neurobiol. Aging
36, 2785 – 2790. (doi:10.1016/j.neurobiolaging.
2015.06.017)
64. Sirota Met al.2015 Effect of genome and
environment on metabolic and inflammatory
profiles.PLoS ONE10, e0120898. (doi:10.1371/
journal.pone.0120898)
65. Faul JD, Mitchell CM, Smith JA, Zhao W. 2016 Estimating telomere length heritability in an unrelated sample of adults: is heritability of telomere length modified by life course
socioeconomic status?Biodemogr. Soc. Biol.62,
73 – 86. (doi:10.1080/19485565.2015.1120645) 66. Kobyliansky E, Torchinsky D, Kalichman L, Karasik D.
2016 Leukocyte telomere length pattern in a Chuvash population that experienced mass famine in 1922 – 1923: a retrospective cohort study.
Am. J. Clin. Nutr.104, 1410 – 1415. (doi:10.3945/
ajcn.116.138040)
67. Bhaumik P, Bhattacharya M, Ghosh P, Ghosh S, Dey SK. 2017 Telomere length analysis in Down
syndrome birth.Mech. Ageing Dev.164, 20 – 26.
(doi:10.1016/j.mad.2017.03.006)
68. Horn T, Robertson BC, Will M, Eason DK, Elliott GP, Gemmell NJ. 2011 Inheritance of telomere length in
a bird.PLoS ONE6, e0017199. (doi:10.1371/journal.
pone.0017199)
69. Olsson M, Pauliny A, Wapstra E, Uller T, Schwartz T, Blomqvist D. 2011 Sex differences in sand lizard telomere inheritance: paternal epigenetic effects increases telomere heritability and offspring
survival.PLoS ONE6, e17473. (doi:10.1371/journal.
pone.0017473)
70. Voillemot M, Hine K, Zahn S, Criscuolo F, Gustafsson L, Doligez B, Bize P. 2012 Effects of brood size manipulation and common origin on phenotype and telomere length in nestling collared flycatchers.
BMC Ecol.12, 17. (doi:10.1186/1472-6785-12-17)
71. Reichert S, Rojas ER, Zahn S, Robin J-P, Criscuolo F, Massemin S. 2014 Maternal telomere length
inheritance in the king penguin.Heredity114,
10 – 16. (doi:10.1038/hdy.2014.60)
72. Atema E, Mulder E, Dugdale HL, Briga M. 2015 Heritability of telomere length in the zebra finch.
J. Ornithol.156, 1113 – 1123.
(doi:10.1007/s10336-015-1212-7)
73. Becker PJ. J., Reichert S, Zahn S, Hegelbach J, Massemin S, Keller LF, Postma E, Criscuolo F. 2015 Mother-offspring and nest-mate resemblance but no heritability in early-life telomere length in
white-throated dippers.Proc. R. Soc. B282,
20142924. (doi:10.1098/rspb.2014.2924) 74. Bauch C, Riechert J, Verhulst S, Becker PH. 2016
Telomere length reflects reproductive effort indicated
by corticosterone levels in a long-lived seabird.Mol.
Ecol.25, 5785 – 5794. (doi:10.1111/mec.13874)
75. Haussmann MF, Longenecker AS, Marchetto NM, Juliano SA, Bowden RM. 2012 Embryonic exposure to corticosterone modifies the juvenile stress response,
oxidative stress and telomere length.Proc. R. Soc. B
279, 1447 – 1456. (doi:10.1098/rspb.2011.1913)
76. Noguera JC, Metcalfe NB, Reichert S, Monaghan P. 2016 Embryonic and postnatal telomere length
decrease with ovulation order within clutches.Sci.
Rep.6, 232. (doi:10.1038/srep25915)
77. Aviv A, Susser E. 2013 Leukocyte telomere length and the father’s age enigma: implications for
population health and for life course.Int. J.
Epidemiol.42, 457 – 462. (doi:10.1093/ije/dys236)
78. Nakagawa S, Schielzeth H. 2010 Repeatability for Gaussian and non-Gaussian data: a practical guide
for biologists.Biol. Rev.85, 935 – 956. (doi:10.1111/
j.1469-185X.2010.00141.x)
79. Henderson CR. 1982 Analysis of covariance in the mixed model: higher-level, nonhomogeneous, and
random regressions.Biometrics38, 623 – 640.
(doi:10.2307/2530044)
80. Ovaskainen O, Cano JM, Merila¨, J. 2008 A Bayesian framework for comparative quantitative genetics.
Proc. R. Soc. B275, 669 – 678. (doi:10.1098/rspb.
2007.0949)
81. Misztal I. 1997 Estimation of variance components
with large-scale dominance models.J. Dairy Sci.
80, 965 – 974. (doi:10.3168/jds.S0022-0302(97)
76021-1)
82. Wolak ME, Keller LF. 2014 Dominance genetic variance and inbreeding in natural populations. In
Quantitative genetics in the wild(eds A Charmantier,
D Garant, LEB Kruuk), pp. 104 – 127. Oxford, UK: Oxford University Press.
83. Houle D. 1992 Comparing evolvability and
variability of quantitative traits.Genetics130,
195 – 204.
84. Wojcicki JM, Shiboski S, Heyman MB, Elwan D, Lin J, Blackburn E, Epel E. 2016 Telomere length change plateaus at 4 years of age in Latino children: associations with baseline length and maternal
change.Mol. Genet. Genomics291, 1379 – 1389.
(doi:10.1007/s00438-016-1191-2)
85. Pam A, Kemker SS, Ross CA, Golden R. 2014 The ‘equal environments assumption’ in MZ-DZ twin
rs
tb.r
oy
alsocietypublishing.org
Phil.
Trans.
R.
Soc.
B
373
:20160450
comparisons: an untenable premise of psychiatric
genetics?AMG Acta Genet.45, 349 – 360. (doi:10.
1017/S0001566000000945)
86. Wilson AJ, Charmantier A, Hadfield JD. 2008 Evolutionary genetics of ageing in the wild:
empirical patterns and future perspectives.Funct.
Ecol.22, 431 – 442. (doi:10.1111/j.1365-2435.2008.
01412.x)
87. Burke T, Bruford MW. 1987 DNA fingerprinting in birds.
Nature327, 149 –152. (doi:10.1038/327149a0)
88. Griffith SC, Owens IPF, Thuman KA. 2002 Extra pair paternity in birds: a review of interspecific
variation and adaptive function.Mol. Ecol.11, 2195 –
2212. (doi:10.1046/j.1365-294X.2002.01613.x) 89. Morrissey MB, Wilson AJ, Pemberton JM, Ferguson
MM. 2007 A framework for power and sensitivity analyses for quantitative genetic studies of natural populations, and case studies in Soay sheep (Ovis
aries).J. Evol. Biol.20, 2309 – 2321. (doi:10.1111/j.
1420-9101.2007.01412.x)
90. Charmantier A, Re´ale D. 2005 How do misassigned paternities affect the estimation of heritability in
the wild?Mol. Ecol.14, 2839 – 2850. (doi:10.1111/j.
1365-294X.2005.02619.x)
91. Morrissey MB, Wilson AJ. 2010 PEDANTICS: an R package for pedigree-based genetic simulation and pedigree manipulation, characterization and
viewing.Mol. Ecol. Resour.10, 711 – 719. (doi:10.
1111/j.1755-0998.2009.02817.x)
92. Stinchcombe JR, Kirkpatrick M. 2012 Genetics and evolution of function-valued traits: understanding
environmentally responsive phenotypes.Trends Ecol.
Evol.27, 637 – 647. (doi:10.1016/j.tree.2012.07.002)
93. Wilson AJ. 2008 Whyh2does not always equalVA/
VP?J. Evol. Biol.21, 647 – 650.
(doi:10.1111/j.1420-9101.2008.01500.x)