This is a repository copy of
A Gaussian mixture model for automated corrosion detection
in remanufacturing
.
White Rose Research Online URL for this paper:
http://eprints.whiterose.ac.uk/138023/
Version: Accepted Version
Proceedings Paper:
Gibbons, T.J. orcid.org/0000-0002-5041-7053, Pierce, G., Worden, K.
orcid.org/0000-0002-1035-238X et al. (1 more author) (2018) A Gaussian mixture model
for automated corrosion detection in remanufacturing. In: Advances in Manufacturing
Technology XXXII. 16th International Conference on Manufacturing Research ICMR 2018,
11-13 Sep 2018, University of Skövde, Sweden. Advances in Transdisciplinary
Engineering, 8 . IOS Press . ISBN 978-1-61499-901-0
https://doi.org/10.3233/978-1-61499-902-7-63
[email protected] https://eprints.whiterose.ac.uk/
Reuse
Items deposited in White Rose Research Online are protected by copyright, with all rights reserved unless indicated otherwise. They may be downloaded and/or printed for private study, or other acts as permitted by national copyright laws. The publisher or other rights holders may allow further reproduction and re-use of the full text version. This is indicated by the licence information on the White Rose Research Online record for the item.
Takedown
If you consider content in White Rose Research Online to be in breach of UK law, please notify us by
1Corresponding Author [email protected]
A Gaussian Mixture Model for Automated
Corrosion Detection in Remanufacturing
Tom GIBBONSa,1, Gareth PIERCEb, Keith WORDENa and Ifigeneia ANTONIADOUa
a Dynamics Research Group (DRG), The University of Sheffield, The Department of Mechanical Engineering, UK.
b Centre for Ultrasound Engineering (CUE), University of Strathclyde, Glasgow, UK.
Abstract. Remanufacturing of high-value engineering structures is set to become
an important aspect of the future manufacturing industry. However, this depends on the ability to accurately, and rapidly inspect used components for damage, such as corrosion. Visual inspection in both manufacturing and remanufacturing is often performed manually, which is a time-consuming, subjective process. This paper looks at the application of machine learning to the automation of visual inspection for remanufacturing. A Gaussian mixture model is trained on a novel set of image features, specifically designed for the task of corrosion detection in used parts. The probabilistic model is used to segment images of automotive engine components into corroded and non-corroded areas. It is possible that the uncertainty in this segmentation may be used to automate further inspection.
Keywords. Corrosion Detection, Automation, Image Processing, Remanufacturing.
1.Introduction
In recent years there has been a significant push towards a low carbon, circular economy, in which remanufacturing helps to reduce waste by repairing and reusing components. Corrosion can prevent remanufactured parts from meeting product standards, and must be detected and removed during (dis)assembly. Since robotic (dis)assembly is now commonplace, the automated detection of corrosion using computer vision methods will play a vital role in the remanufacturing pipeline.
This paper presents a Gaussian mixture model (GMM) for automated corrosion detection. The GMM is used to segment corroded areas in images of automotive engines during the disassembly process. One of the difficulties, specific to corrosion detection in remanufacturing, is the inherent contamination of components with dirt. Therefore, in order to reduce the sensitivity to dirt, a novel set of image features, which include the L*a*b* colour space and Gabor texture features, are used to train the GMM. Moreover, the GMM is capable of assigning each pixel in an image with a probability of corrosion. This is used to produce an uncertainty map, which may, in future work, be used to automatically guide further inspection of areas with high uncertainty.
Previous research in this area has focused on the use of wavelet energy and entropy [1], the HIS colour space and the co-occurrence matrix [2], and HSV colour space [3] to classify corrosion. However, none of these works have looked at image segmentation.
2.Feature Extraction
tune the hyperparameters of the GMM, and the test set is used to test the accuracy of the final model. The images in both the cross-validation and test sets were annotated by hand, labelling each pixel as either corrosion or non-corrosion (background).
Each of the three colour channels constitutes a single feature (or variable), with each pixel in the images an observation of those variables. Whilst detecting corrosion in the RGB feature space can produce satisfactory results, the accuracy can be improved by extracting features specific to the remanufacturing corrosion detection task.
2.1.Colour Features
The L*a*b* colour space contains all perceivable colours on three axes, namely Luminosity (L*), red-green (a*), and yellow-blue (b*). The advantage of this colour space in corrosion detection, is the separate luminosity and colour features. Consider Figure 1, which shows an example image from the test set in various feature spaces. It is clear from Figure 1(a) that the engine images contain areas of very dark pixels contrasted with areas of light, metallic and highly reflective pixels, which distort the true colour of the engine. Once luminosity (Figure 1(b)) is removed, the individual colour features contain information about the true colour of the engine. It can be seen from Figure 1(c) that environmental lighting has little or no effect on the colour channels (a* and b*), and that areas of corrosion become more prominent. Therefore, each of the engine images was transformed into the L*a*b* feature space, and the luminosity channel ignored, thus reducing the dataset to a two dimensional feature space.
[image:3.595.128.473.409.509.2](a) Original Image (b) Luminosity (c) Colour a*
Figure 1. An exemplar engine image comparing the RGB space with the luminosity and colour channels of
the L*a*b* space.
[image:3.595.247.343.611.706.2]Figure 2 shows the same image displayed on the a*-b* plane, with each point corresponding to a single pixel. Whilst the image contains some tight clusters, there is still considerable overlap between corroded and non-corroded pixels, which can be attributed to both the noisy colour variation in corroded areas, and the dirt contamination. Therefore, in order to train a corrosion detector that can distinguish between corroded and non-corroded pixels in used components, the feature space must be extended.
Figure 2. Scatter diagram comparing corroded and non-corroded pixels in the a*b* colour space.
2.2.Texture Features
It has been proposed [4] and since verified [5], that the human visual system interprets texture by decomposing the retinal image into a set of filtered images, each of which contain intensity values in a narrow frequency and orientation bandwidth. The real part of the Gabor filter, can be seen as a numerical approximation to these biological filters [6]. The 2D Gabor filter consists of a sinusoidal wave of frequency and orientation , modulated by a Gaussian envelope with standard deviation and, in the spatial domain, is given by:
exp cos cos sin
By varying the parameters and , the filters can extract texture information at different frequencies, orientations, and over different regions of the image. A Gabor filter bank was constructed, with 4 frequencies
[pixels/cycle], and four orientations [degrees], as demonstrated in [6], giving a total of 16 filters. In each case, the standard deviation was set to
, where X and Y are the width and height of the image. Each filter was applied to the image dataset in turn to give a further 16 features.
2.3.Principal Component Analysis
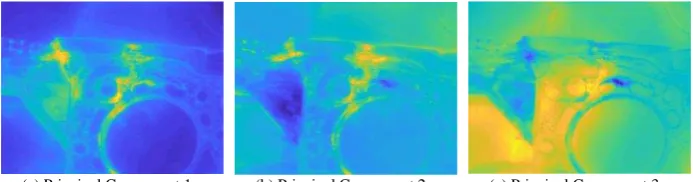
In order to reduce the dimensionality of the GMM, and in turn reduce the training time, a principal component analysis (PCA) was performed. PCA uses an orthogonal transform to map the image data to a lower dimensional feature space, whilst retaining the highest possible variance. The first three principal components are shown in Figure 3, where it can be seen that the corroded areas become particularly prominent in the second and third principal components. The number of principal components to include in the GMM was optimised via cross validation, which is discussed further in section 3.3.
[image:4.595.127.474.498.589.2](a) Principal Component 1 (b) Principal Component 2 (c) Principal Component 3
Figure 3. First three principal components
3.Gaussian Mixture Model
3.1.K-means
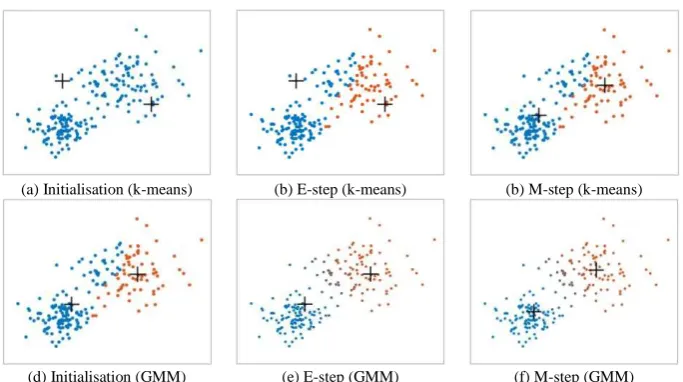
The K-means algorithm is the simplest clustering method and works by learning a set of cluster centres , where is defined as the mean of all points in the cluster. The cluster centres are learned using a form of the expectation-maximisation (EM) algorithm, as demonstrated in Figure 4(a)-(c). After randomly initialising the cluster centres (+), each pixel is assigned to the cluster with the closest centre (E-step), before the centres are re-calculated (M-Step). The algorithm works by minimising an objective function, and repeats until the improvement in the objective function falls below some pre-defined threshold. K-means clustering is a form of hard clustering in that each pixel is assigned to exactly one non-overlapping cluster, and no consideration is given to pixels that share features with two or more clusters.
(a) Initialisation (k-means) (b) E-step (k-means) (b) M-step (k-means)
[image:5.595.127.469.296.487.2](d) Initialisation (GMM) (e) E-step (GMM) (f) M-step (GMM)
Figure 4. The expectation-maximisation (EM) algorithm for K-means and Gaussian mixture model (GMM)
3.2.Gaussian Mixture Model
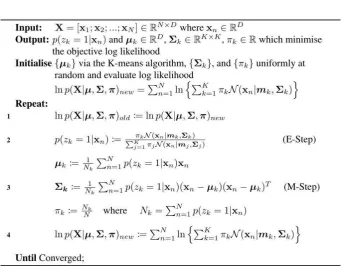
Figure 5. The expectation-maximisation (EM) algorithm for Gaussian Mixture Models
3.3.Cross-validation
The number of clusters, , and the number of principal components, , used in training can have a significant effect on the accuracy of the results. Therefore, these hyperparameters are tuned using the labelled cross-validation set. For all combinations of and , a GMM was trained and the accuracy determined by calculating the F1-score on the cross-validation set. The F1-score is the harmonic mean of the of precision (P) and recall (R) and is given by:
where and
and is equal to the number of pixels correctly assigned to the corrosion cluster, is the number of pixels falsely assigned to the corrosion cluster, is the number of pixels falsely assigned to a non-corrosion cluster, and the corrosion cluster is defined as the cluster that contains the highest number of pixels hand labelled as corrosion.
3.4.Results
posterior probability that each pixel belongs to the corrosion cluster is calculated, and these probabilities are plotted in Figure 6(c). These probabilities can be considered as a measure of uncertainty of corrosion and used to guide further automated inspection. It is proposed that such an uncertainty map may be used to optimise further camera locations and lens parameters.
[image:7.595.125.471.225.322.2](a) Cluster Diagram (b) Pixels in Corrosion Cluster (c) Uncertainty Map
Figure 6. Results of the Gaussian mixture model for corrosion detection
4.Conclusion
This paper has presented a method for the automated detection of corrosion in remanufacturing. A new set of features, namely colour, texture, and grid features, have been proposed for the specific task of detecting corrosion in components contaminated with dirt. A Gaussian mixture model was trained to segment corrosion on the new feature set, and all hyperparameters tuned via cross-validation. It has also been proposed that the posterior probabilities of the Gaussian mixture model may be used to automate further inspection.
Acknowledgements
This research was funded through the EPSRC grant (EP/N018427/1) Autonomous Inspection in Manufacturing and Remanufacturing (AIMaReM) and supported by Autocraft Drivetrain Solutions Ltd.
References
[1] S. Ghanta, T. Karp and S. Lee, “Wavelet domain detection of rust in steel bridge images,” in IEEE International Conference on Acoustics, Speech and Signal Processing (ICASSP), 2011.
[2] K. Y. Choi and S. Kim, “Morphological analysis and classification of types of surface corrosion
damage by digital image processing,” Corrosion Science, pp. 1-15, 2005.
[3] M. Acosta, J. Díaz and N. Castro, “An innovative image-processing model for rust detection using
Perlin Noise to simulate oxide textures,” Corrosion Science, pp. 141-151, 2014.
[4] F. Campbell and J. Robson, “Application of Fourier Analysis to the Visibility of Gratings,” The Journal of Physiology, pp. 551-566, 1968.
[5] R. De Valois, D. Albrecht and L. and Thorell, “Spatial Frequency Selectivity of Cells in Macaque
Visual Cortex,” Vision Research, pp. 545-559, 1982.
[6] A. K. Jain and F. Farrokhnia, “Unsupervised texture segmentation using Gabor filters,” Pattern recognition, pp. 1167-1186, 1991.