This is a repository copy of
Fibonacci sequence for modelling stop bands in random
microstructure
.
White Rose Research Online URL for this paper:
http://eprints.whiterose.ac.uk/127933/
Version: Accepted Version
Article:
Gitman, I.M. orcid.org/0000-0002-7369-6905 and Song, Y. (2018) Fibonacci sequence for
modelling stop bands in random microstructure. ZAMM Zeitschrift fur Angewandte
Mathematik und Mechanik, 98 (2). pp. 270-276. ISSN 0044-2267
https://doi.org/10.1002/zamm.201700010
[email protected] https://eprints.whiterose.ac.uk/
Reuse
Items deposited in White Rose Research Online are protected by copyright, with all rights reserved unless indicated otherwise. They may be downloaded and/or printed for private study, or other acts as permitted by national copyright laws. The publisher or other rights holders may allow further reproduction and re-use of the full text version. This is indicated by the licence information on the White Rose Research Online record for the item.
Takedown
If you consider content in White Rose Research Online to be in breach of UK law, please notify us by
Fibonacci sequence for modelling stop bands in random microstructure
Inna M. Gitman∗and Yilang Song
Department of Mechanical Engineering, University of Sheffield, Sheffield, UK
Received XXXX, revised XXXX, accepted XXXX Published online XXXX
Key words Fibonacci sequence, composite material, randomness, wave propagation, stop band.
MSC (2010) 00-xx
In this paper the mathematical concept of the Fibonacci sequence has been introduced as an accurate and reliable tool to model randomness in a heterogeneous material. It is also argued, that this randomness plays an important role and can control the response of a heterogeneous material, subjected to dynamic loading, here an elastic wave propagating through the material. A particular dynamic phenomenon, the presence of band gaps, has been analysed. It has been shown that randomness, modelled using the Fibonacci sequence, introduced into the material’s structure, increases the range of stop band frequencies.
Copyright line will be provided by the publisher
1
Introduction
It is well known that by changing and controlling the microstructure of heterogeneous materials it is possible to control and influence the overall response of macroscopic media in static as well as dynamic loading conditions. This ability of controlling the overall response is particularly important in applications such as waveguide filters, devices that can allow waves at some frequencies to propagate, i.e. pass through the material, while at other frequencies waves are rejected, i.e.
stopped from propagating. These ranges of frequencies are referred to aspass bandandstop bandcorrespondingly.
The band gap phenomenon [1] has mainly been studied in two-phase periodically structured materials [5],[7], [10]. However, realistic materials are rarely perfectly periodic, thus it is of importance to understand how waveguide technology can be also implemented in more realistic applications. Some attempts have been made in [6] and [9] to analyse the behaviour of materials with different types of disorders. Analyses of the influence of mechanical and geometrical disorder led to the conclusion [9] that geometrical disorder is significantly more dominant, in comparison to mechanical disorder, affecting the band gap: increasing geometrical randomness leads to the second pass band dropping to zero, i.e. even small perturbations in the geometry make it possible to turn a pass band into a stop band.
There are different ways of introducing geometrical disorder into the material microstructure: in [9] it was added in the
form of small perturbations following a normal distribution and described by mean and standard deviation1
.
The above methodology, however, is based on the assumption of a continuous probability distribution (normal in this case), which, in general, should be argued for each particular application. Continuous probability distribution may or may not represent the actual material accurately, as continuous distribution implies continuous changes in properties of components in the analysed material, which is not always the case in reality. Thus, this methodology could lead to a reduction in usability for some practical industrial applications, for example, additively manufactured composites. The latter materials may be better described using discrete probability distribution. Appreciating the differences between the two discussed above methodologies and, perhaps, limitations of the Fibonacci based approach, the latter would be referred
to as quasi- or pseudo-random2
.
Although not widely used, the idea of employing Fibonacci numbers in physics and mechanics is not novel in itself: among others should be, for example, mentioned the numerical statistical work of [4] in the field of quasicrystals. Theo-retical research, reported in [8] is, perhaps, closer to the current study: the authors analysed, with the help of the Fibonacci sequence, band gaps in 1D periodic multilayered structures, which are influenced by the effect of linear graded index ma-terial. In [2] the Fibonacci sequence has also been used to analyse elastic wave propagation in one dimensional solid-fluid quasi-periodic phononic crystals. A more recent study of optical properties in a one dimensional quasi-periodic graphene
∗ Corresponding author E-mail:[email protected], Phone: +44 114 222 7728, Fax: +44 114 222 7890
1 The term ”small perturbation” refers to the case of small coefficient of variation.
2 I.M. Gitman and Y. Song: Fibonacci sequence for modelling random microstructure
a) b)
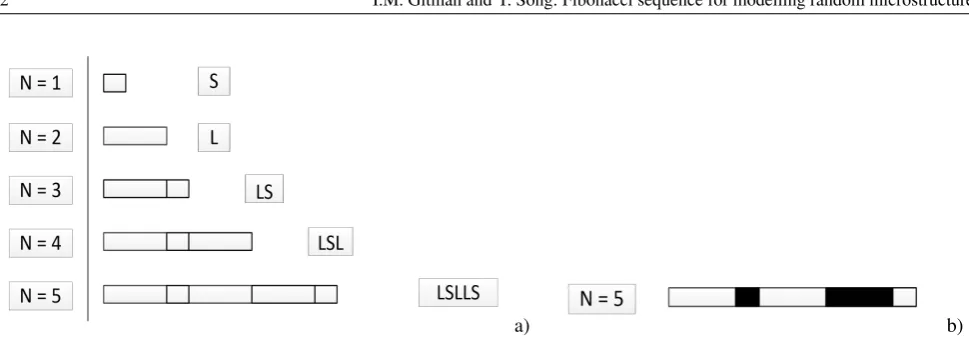
Fig. 1 Illustration of a Fibonacci bar construction a) – layers forN = 1toN = 5; b) – material properties assigned.
photonic crystal using the Fibonacci sequence is presented in [12]. Researchers have looked into two dimensional phononic crystals as well: [11], for example, analysed the band structures of in-plane elastic waves propagating in such materials, experiencing one-dimensional random disorder and aperiodicity, while keeping the second dimension periodic.
In this paper we revisit and argue the validity and convenience of using the Fibonacci sequence in a practical mechanical context: the analysis of random heterogeneous material behaviour, subjected to propagating elastic waves. We will study the occurrence of stop bands (or wave filters) and identify the relevant parameters that influence these stop bands. We promote the use of the Fibonacci-based methodology, that not only allows to model stop bands, but also to control stop bands, and thus overall material response.
2
Fibonacci layout of material with quasi-random properties
We recall that the Fibonacci sequence can be defined asFN
= FN−1
+FN−2
, withN ≥2, and seed valuesF1
= 1
andF2
= 1. Following a similar logic, a Fibonacci bar (FN
bar) can be constructed. The Fibonacci bar is defined as a
laminate material withN lamellae made of two geometrically different material components. The length of each lamella
(component), for illustrative purpose, is referred to as either long (L) or short (S). These two parts become the seed parts
of the Fibonacci bar:
– forN = 1the Fibonacci bar (F1
bar) is constructed from one short layer:F
1 bar =S;
– forN = 2the Fibonacci bar is constructed by one long layer:F2
bar =L;
– forN = 3the Fibonacci bar is constructed by two parts, the first part beingF2
bar (L) and the second partF
1 bar (S)
which is placed at the end of the first part:F3
bar =LS;
– forN >= 3,FN
baris generated byF
N−2
bar placed at the end ofF
N−1
bar , resulting in the right Fibonacci bar depicted in
Figure 1–a.
Note here, that the starting point has been chosen arbitrary and similar logic can be used if starting from the long layer.
The length of each layer is determined by the Fibonacci sequence, hence, whenN = 5, the bar is characterised as
LSLLS(see Figure 1–a). For large enoughN the distribution of long – short layers,FN
bar, can be considered random, or,
referring to the note in Section 1,quasi-random. At the same time, the constructed Fibonacci bar is a laminate material with
two different material phases, for illustrative purposes presented as black and white blocks, thus forN = 5, the material
property of each layer is white-black-white-black-white (see Figure 1–b).
The procedure introduced above, resulting in controlled quasi-random laminate material, can be straightforwardly inter-preted in terms of additive manufacturing processes.
3
Stop band prediction based on one dimensional Fibonacci bar
In order to illustrate the use of the Fibonacci sequence in practice, first a one dimensional numerical test has been carried
out. For this purpose, a220 mm bar with fixed ends has been subjected to a longitudinal elastic wave with frequency
ranging fromf = 0.1×10⁵
Hz to6.4×105
Hz with intervals of0.1×105
Hz. A bar has been constructed from the actual
[image:3.595.54.539.78.250.2]0 2 4 6 Frequency [Hz] ×105 0
0.5 1
Transmission coefficient
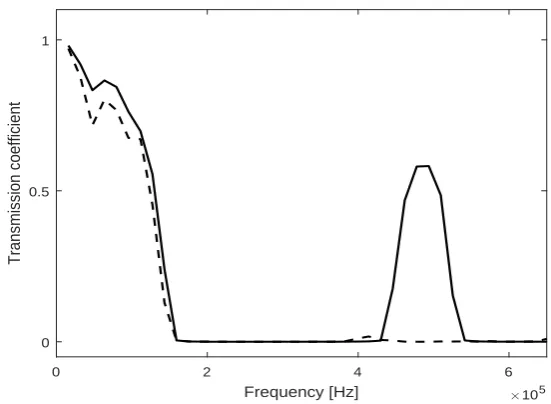
Fig. 2 Quasi-random (dashed line) compared with periodic case (solid line).
of propagating waves) and the recording point (output of the waves propagating through the heterogeneous part). The material properties in these homogeneous parts correspond to the harmonic mean of the Young’s modulus and arithmetic mean of the density of heterogeneous material’s properties. In order to ensure that no reflections can be generated (see [9]
for details), the50mm perfect match layers (PML) are added on both sides of the test material with input and output parts,
as alternatives to absorbing boundary conditions.
For a representative statistical analyses, 10 realisations of 100 mm long 2-phase heterogeneous material have been
generated (see [3] for arguments toward the number of realisations). First a periodic material withL = 5mm andS =
5mm was considered. As the length of each layer (lamellae) was5mm, and the total length of the heterogeneous material
bar was100mm, 20 layers in the Fibonacci bar needed to be generated. Thus, in order to accommodate 10 independent
statistical realisations,FN
bar with at least 200 layers needed to be constructed
3
. ChoosingN = 13produces a sufficient
number of layers in the Fibonacci bar:F13
baramounts to 233 layers. Mechanical properties, Young’s moduli and densities,
of the material phasesM1andM2are chosen as follows:EM
1 = 2×10
11
Pa,ρM
1 = 8×10
3
kg/m3,EM
2 = 8×10
10 Pa
andρM
2 = 4.4×10
3
kg/m3.
The results are analysed from the position of a transmission coefficients – the ratio of amplitudes of waves traveling
through heterogeneous materialAhet(f)over amplitudes of waves traveling through homogeneous materialAhom(f):
T(f) = Ahet(f)
Ahom(f)
(1)
AmplitudesAhet(f)andAhom(f)are obtained after Fourier transform of the monitored displacement, following a
continu-ous sin wave traveling through homogenecontinu-ous and heterogenecontinu-ous materials correspondingly; herefis the varying frequency
of the sine wave signal.
Signals have been averaged over 10 realisations of Fibonacci bar material. The transmission coefficient of quasi-random Fibonacci based bar are then compared with the transmission coefficient results of a wave propagating through a
non-periodic material with the length of long and short layers taken asL = 6mm and S = 4mm correspondingly. This
comparison is shown in Figure 2. As it can be seen, the quasi-random Fibonacci bar material can significantly reduce the value of the transmission coefficient in the second pass band compared to periodic laminate material. It should also be noted that the outcomes of different realisations have low variability (see Figure 3, where, for illustration, outcomes of 5 realisations are presented; all realisations produce qualitatively similar results, meaning that any of the realisations could serve as a potential template for an additive manufacturing process.
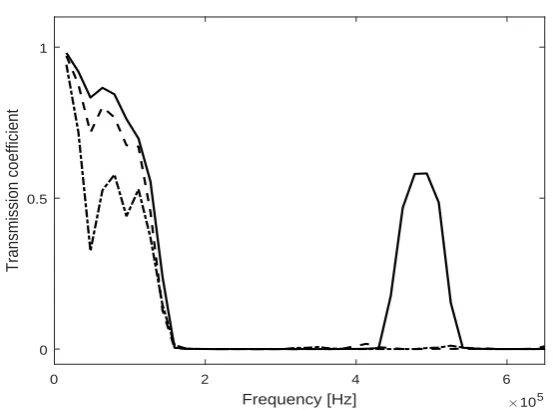
It is also of interest to discuss the behaviour of the transmission coefficient and its dependence on the ratio of long to
short lengths of layers. This dependence can be observed in Figure 4, where two cases of different ratiosL= 6mm and
3 We took here an approach of having10independent realisations, arranged in series in the Fibonacci bar. An alternative approach could also be taken, as to identify realisations from a shorter the Fibonacci bar by randomly picking a100mm samples from it. In this case further research is needed
[image:4.595.151.427.113.315.2]4 I.M. Gitman and Y. Song: Fibonacci sequence for modelling random microstructure
0 2 4 6
Frequency [Hz] ×105 0
0.5 1
Transmission coefficient
Fig. 3 Realisations of Fibonacci bar simulations
0 2 4 6
Frequency [Hz] ×105 0
0.5 1
Transmission coefficient
Fig. 4 Low (dashed line) and high (dashed-dotted line) contrasts Fibonacci bar, periodic case (solid line).
S= 4mm (dashed line) andL= 7.5mm andS= 2.5mm (dashed-dotted line) were compared with the periodic material
(solid line). Note here that first stop band frequencies for all periodic, large and small contrast samples are similar, and that both low and high contrast in layers length resulted in the removal of the second pass band. On the other hand it should be noted that higher contrast in Fibonacci seed values leads to much lower values of transmission coefficient in the first pass band.
4
Stop band prediction based on two dimensional Fibonacci square
Next, Fibonacci geometries are explored in 2D. Similarly to Section 3, the test geometry has again been divided into three
parts: perfectly matched layers, signal input / output layers and the actual heterogeneous test material. A20mm×20mm
heterogeneous test material has been constructed from 400 squares (1mm×1mm), with two different material components,
[image:5.595.151.428.112.316.2] [image:5.595.152.429.358.563.2]Fig. 5 Simulation model of wave propagation in 2D.
0
2
4
6
8
10 0
10 20
30 40
50 0
0.5 1 1.5
Recording points Frequency (Hz)
Transmission coefficient
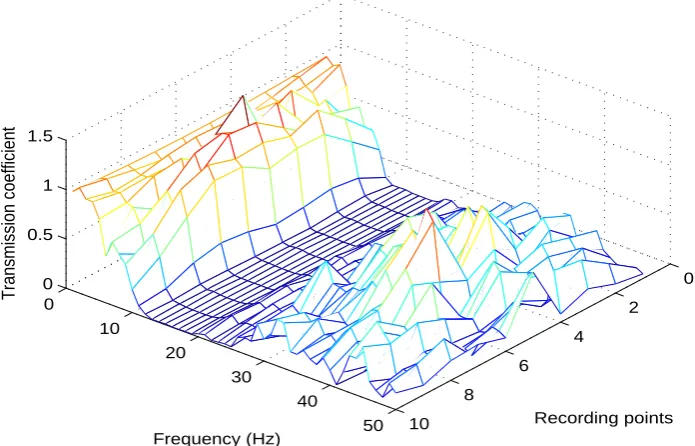
Fig. 6 Wave propagating through periodic material.
horizontal center of the input/output parts. In this line source, 10 points have been chosen to represent the displacement distribution (see Figure 5).
The following material properties for the two componentsM1andM2were used in the numerical simulations:EM
1 =
1.6×10⁶
Pa,ρM
1 = 1×10
9
kg/m3,EM
2 = 0.4×10
6
Pa andρM
2 = 0.1×10
9
kg/m3. Numerical tests were performed
for frequencies ranging from 1Hz to 50Hz. First periodic material with L = 1mm and S = 1mm was studied, the
transmission coefficients results of which are shown in Figure 6.
As a next step, the Fibonacci sequence has been used in order to mimic randomness in the 2D test material. Following the technique introduced in Section 2 to generate the Fibonacci bar, here the Fibonacci square was constructed. Three different orientations (directions) of randomness have been considered: material with (i) horizontally random but vertically periodic structure, (ii) vertically random but horizontally periodic structure, and (iii) horizontally and vertically random structure.
Furthermore, as it has been mentioned in Section 3, attention has also been focused on contrast between material phases
lengths, resulting in two types of Fibonacci sequences: a low contrast Fibonacci sequence withL= 1.2mm andS= 0.8mm
which represents the same degree of randomness as small perturbation case, discussed in [9], and a high contrast Fibonacci
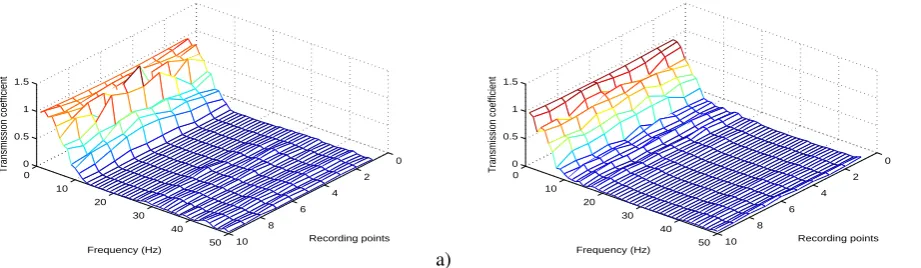
[image:6.595.157.438.120.245.2] [image:6.595.119.467.315.538.2]6 I.M. Gitman and Y. Song: Fibonacci sequence for modelling random microstructure 0 2 4 6 8 10 0 10 20 30 40 50 0 0.5 1 1.5 Recording points Frequency (Hz) Transmission coefficient a) 0 2 4 6 8 10 0 10 20 30 40 50 0 0.5 1 1.5 Recording points Frequency (Hz) Transmission coefficient b)
Fig. 7 Randomness added to horizontal direction a) – low contrast and b) – high contrast Fibonacci sequence.
0 2 4 6 8 10 0 10 20 30 40 50 0 0.5 1 1.5 Recording points Frequency (Hz) Transmission coefficient a) 0 2 4 6 8 10 0 10 20 30 40 50 0 0.5 1 1.5 Recording points Frequency (Hz) Transmission coefficient b)
Fig. 8 Randomness added to vertical direction a) – low contrast and b) – high contrast Fibonacci sequence.
0 2 4 6 8 10 0 10 20 30 40 50 0 0.5 1 1.5 Recording points Frequency (Hz) Transmission coefficient a) 0 2 4 6 8 10 0 10 20 30 40 50 0 0.5 1 1.5 Recording points Frequency (Hz) Transmission coefficient b)
Fig. 9 Randomness added to horizontal and vertical direction a) – low contrast and b) – high contrast Fibonacci sequence.
the two types of randomness is the length of material components populating the two Fibonacci sequences. The results of the numerical tests are presented in Figures 7, 8 and 9.
As can be seen, in line with the conclusions made in Section 3, introducing Fibonacci-type quasi-randomness to the material considerably increases the frequency range of the first stop band. Moreover, sending a longitudinal harmonic wave to propagate through quasi-random heterogeneous material leads to the following observations:
: in case of low contrast Fibonacci sequence, introducing randomness in any of the orientations increases the stop band
[image:7.595.62.515.107.246.2] [image:7.595.64.531.291.425.2] [image:7.595.65.526.471.605.2]pearance of the second pass band with the smoothest results, and thus the lowest transition coefficient, being produced in the case of material random in both directions. Transmission coefficients in the first pass band have lower values (a similar trend was observed in the 1D case as well). Generally high contrasts in material components results in larger stop band frequency range.
Thus it can be seen, that qualitatively similar results in terms of stop band could be obtained through randomness in either vertical or horizontal directions for both low and high contrast materials; on the other hand randomness introduced in both vertical and horizontal directions have more pronounced effects, as expected. Comparing Figures 7–b and 9–a, either a high contrast Fibonacci sequence with randomness added in one direction, or a low contrast Fibonacci sequence with randomness in both directions give very similar effects, thus providing two alternative but equivalent approaches to control stop bands and, thus, overall material response to the elastic wave propagation.
5
Conclusions
The main aim of this article was the exploration of the usability of the Fibonacci sequence in practical engineering ap-plications. A two phase pseudo-random material, created using the Fibonacci sequence, was tested in an elastic wave propagation context. The response of the composite material was analysed from the position of randomness in the mate-rial’s geometry and its influence on wave stop bands. It has been concluded that, first of all, introducing randomness to the material geometry considerably increases the stop band frequency range; this conclusion has confirmed the research published in [9]. Fibonacci based methodology is successful in recreating the aforementioned effect. Both low and high contrasts in the Fibonacci sequence obey the above conclusions, in particular when introduced in both directions. Different approaches to control stop bands, and thus overall material response, have been offered in the paper. Furthermore, using the Fibonacci sequence for particular engineering applications (mentioned above) will, considering the simplicity of the algorithm, increase the usability of the numerical implementation, as this methodology allows to generate a random se-quence from a very compact set of recursive rules. It is straightforward to program the Fibonacci sese-quences, which in turn means that the findings of this paper can easily be extended to experimentation of realistic microstructures, for example using additive manufacturing.
Acknowledgements We gratefully acknowledge the Leverhulme Trust for financial support under grant number F/00 120/CC.
References
[1] L. Brillouin, Wave propagation in periodic structures (McGraw-Hill, 1946).
[2] A. L. Chen, Y. S. Wang, and C. Zhang, Wave propagation in one-dimensional solidfluid quasi-periodic and aperiodic phononic crystals, Physica B: Condensed Matter407 (3), 324–329 (2012).
[3] I. Gitman, H. Askes, and L. Sluys, Representative volume: existence and size determination, Engineering Fracture Mechanics74, 2518–2534 (2007).
[4] H. Koch and C. Radin, Modelling quasicrystals at positive temperature, Journal of Statistical Physics138, 465–475 (2010). [5] M. Kushwaha, P. Halevi, L. Dobrzynski, and R. Djafari, Acoustic band structure of periodic elastic composites, Phys. Rev. Lett.
71, 2022–2025 (1993).
[6] P. Sheng, Introduction to wave scattering, localization and mesoscopic phenomena (Academic Press, 1995).
[7] M. Sigalas and E. Economou, Elastic waves in plates with periodically placed inclusions, J. Appl. Phys.75, 2845–2850 (1994). [8] B. Singh, P. Kumar, and P. Pandey, Tunable photonic band-gaps in one-dimensional photonic crystals containing linear graded
index material, Applied Physics B: Lasers and Optics117, 947–956 (2014).
[9] Y. Song, I. Gitman, W. Parnell, and H. Askes, The influence of random microstructure on wave propagation through heterogeneous media, International Journal of Fracture204 (1), 115–120 (2017).
[10] J. Vasseur, R. Djafari, L. Dobrzynski, M. Kushwaha, and P. Halevi, Complete acoustic band gaps in periodic fibre reinforced composite materials: the carbon/epoxy composite and some metallic systems, Journal of Physics: Condensed Matter6 (42), 8759–8770 (1994).
[11] Z. Z. Yan, C. Zhang, and Y. S. Wang, Elastic wave localization in two-dimensional phononic crystals with one-dimensional random disorder and aperiodicity, Physica B: Condensed Matter406, 1154–1161 (2011 (5)).