in metabolomics to identify markers of abiotic and biotic stress in Medicago truncatula
.
White Rose Research Online URL for this paper:
http://eprints.whiterose.ac.uk/135853/
Version: Published Version
Article:
Dickinson, Elizabeth orcid.org/0000-0001-8961-3230, Wilson, Julie Carol
orcid.org/0000-0002-5171-8480, Rusilowicz, Martin James et al. (4 more authors) (2018)
Integrating transcriptomic techniques and k-means clustering in metabolomics to identify
markers of abiotic and biotic stress in Medicago truncatula. Metabolomics. ISSN
1573-3890
https://doi.org/10.1007/s11306-018-1424-y
[email protected] https://eprints.whiterose.ac.uk/
Reuse
This article is distributed under the terms of the Creative Commons Attribution (CC BY) licence. This licence allows you to distribute, remix, tweak, and build upon the work, even commercially, as long as you credit the authors for the original work. More information and the full terms of the licence here:
https://creativecommons.org/licenses/
Takedown
If you consider content in White Rose Research Online to be in breach of UK law, please notify us by
https://doi.org/10.1007/s11306-018-1424-y
Integrating transcriptomic techniques and
k
-means clustering
in metabolomics to identify markers of abiotic and biotic stress
in
Medicago truncatula
Elizabeth Dickinson1 · Martin J. Rusilowicz2 · Michael Dickinson3 · Adrian J. Charlton3 · Ulrike Bechtold4 ·
Philip M. Mullineaux4 · Julie Wilson5
Received: 24 March 2018 / Accepted: 3 September 2018 © The Author(s) 2018
Abstract
Introduction Nitrogen-ixing legumes are invaluable crops, but are sensitive to physical and biological stresses. Whilst drought and infection from the soil-borne pathogen Fusarium oxysporum have been studied individually, their combined efects have not been widely investigated.
Objectives We aimed to determine the efect of combined stress using methods usually associated with transcriptomics to detect metabolic diferences between treatment groups that could not be identiied by more traditional means, such as prin-cipal component analysis and partial least squares discriminant analysis.
Methods Liquid chromatography-high resolution mass spectrometry data from the root and leaves of model legume Med-icago truncatula were analysed using Gaussian Process 2-Sample Test, k-means cluster analysis and temporal clustering by ainity propagation.
Results Metabolic diferences were detected: we identiied known stress markers, including changes in concentration for sucrose and citric acid, and showed that combined stress can exacerbate the efect of drought. Changes in roots were found to be smaller than those in leaves, but diferences due to Fusarium infection were identiied. The transfer of sucrose from leaves to roots can be seen in the time series using transcriptomic techniques with the metabolomics time series. Other metabolite concentrations that change as a result of treatment include phosphoric acid, malic acid and tetrahydroxychalcone.
Conclusions Probing metabolomic data with transcriptomic tools provides new insights and could help to identify resilient plant varieties, thereby increasing future crop yield and improving food security.
Keywords Metabolomics · Medicago truncatula · Drought · Biotic stress · Clustering
1 Introduction
Legumes are an important component of sustainable food production and leguminous plants are used throughout Europe as both a food commodity and high protein source in animal feedstock. Population increase and climate change mean that problems with crop yields rapidly need address-ing. Legumes are sensitive to abiotic (chemical and physi-cal) stresses (Charlton et al. 2008), most signiicantly water deicit and soil salinity, with drought currently a major factor limiting crop productivity worldwide. Fusarium oxysporum, a soil-borne fungus, causes widespread disease in agricul-tural crops (“fusarium wilt”), infecting most legumes as well as other fruit and vegetables (Rispail and Rubiales 2015). This biotic stress causes vascular vessel clogging by a com-bination of pathogen activities and host defence responses
Electronic supplementary material The online version of this article (https ://doi.org/10.1007/s1130 6-018-1424-y) contains supplementary material, which is available to authorized users.
* Elizabeth Dickinson
1 Department of Chemistry, University of York, York YO1 5DD, UK
2
Department of Computer Science, University of York, York YO1 5DD, UK
3
Fera Science Ltd., Sand Hutton, York YO41 1LZ, UK 4 School of Biological Sciences, University of Essex,
Colchester CO4 3SQ, UK 5
(Beckman 1987; Di Pietro et al. 2003), leading to charac-teristic wilt symptoms and rapid plant death as a result of severe water stress. Disease development is favoured by warm temperatures and drought stress has been shown to enhance the proliferation and spread of Fusarium pathogens in cereals (Liu and Liu 2016).
Medicago truncatula is a small clover-like leguminous plant, that has been extremely well-studied (Young et al.
2011) and is also highly susceptible to Fusarium infection and drought stress (Ramírez-Suero 2010). Understanding of the changes in biochemistry due to combined Fusarium -drought interaction in Medicago could provide relevant path-way information for leguminous crops. It is well established that metabolites connect the genotype and phenotype with environmental conditions, which has recently led to the use of metabolites as selection markers in crop breeding pro-grams (Fernie and Schauer 2009). During drought stress the, typical metabolite changes include the accumulation of car-bohydrates and amino acids but also changes in phenylpro-panoids leading to diferential lavonoid proiles (Rasmus-sen et al. 2012, Bechtold et al. 2016). Similarly, metabolic proiling during fungal infection has shown a mobilization of carbohydrates, changes in amino acid pools, and the activa-tion of isolavonoid, α-linolenate, and phenylpropanoid bio-synthetic pathways (Aliferis et al. 2014). However, to date little has been done to study the combined efects of biotic and abiotic stresses (Mittler and Blumwald 2010; Swindell et al. 2007), with the work reported being largely descrip-tive, stating how changes in humidity, salinity or temperature afect resistance to pathogens (AbuQamar et al. 2009; Bech-told et al. 2005; Yoshioka et al. 2001; Santino et al. 2013).
The use of principal component analysis (PCA) for data exploration and partial least squares (PLS) with regression or discriminant analysis for prediction and classiication are standard techniques in metabolomics (Madsen et al.
2010; Hendriks et al. 2011). However, these methods are based on variance in the data and can be dominated by large variables unrelated to the problem in question (Blekher-man et al. 2011). Hence subtle diferences between sam-ples or treatment groups may not be detected due to little variation between diferentiating metabolites. Although less common than PCA and PLS, clustering techniques such as k-means and its advancements have been used suc-cessfully in metabolomic studies (Hageman et al. 2006; Li et al. 2009; Ren et al. 2015). Conversely, clustering of time-series data in transcriptomics is widely used to establish diferential expression of genes and the speciic time-points at which this occurs under particular perturbations to the system (Breeze et al. 2011; Heard 2011). Considering abi-otic and biabi-otic stress as perturbations on the metabolome, the application of clustering techniques and transcriptomic tools can provide similar insights from metabolomic time-course data. The integration of techniques from diferent
-omics technologies provides an opportunity for integration of data from diferent technologies and a means of exploring the efects of stress from genome through to metabolome. Although new methods are emerging (Wanichthanarak et al.
2015), -omics integration is not a trivial process and the development of efective procedures is continually sought.
The Gaussian Process Two-Sample (GP2S) Test of dif-ferential expression is used in transcriptomics to test for diferential gene expression between two treatment groups, by itting an expression trend over time for each group and identifying deviations between trends (Stegle et al. 2010). This technique accounts for measurements from multiple replicates, is robust to outliers and can be used to identify diferential behaviour in subintervals of the time series. The method uses a Gaussian Process to produce a “smooth” function describing the times series, created over all sam-ples from all groups (irrespective of treatment), assuming samples are drawn from a “shared” distribution. Similarly, an alternative model describes the time series for two indi-vidual treatment groups as samples from “independent” dis-tributions. The “shared” and “independent” models are then compared using the logarithm of the Bayes factor (“score”). The higher the log Bayes factor, the more evidence there is for the gene being diferentially expressed. The scores above a threshold are used to identify genes with diferential expression, therefore GP2S can act as a “ilter” to remove those that are not expressed. The approach can be applied to metabolite concentrations over time, for example by ilter-ing out changes due to growth and retainilter-ing information for only those metabolites with time series difering between treatment groups.
Developed as a preliminary step in gene regulatory net-work building, temporal clustering by affinity propaga-tion (TCAP) takes account of time delays, inversions and transient correlations under speciic perturbations, (Kiddle et al. 2010). An information-rich distance measure and a clustering algorithm which evaluates each data point from a data set as part of possible cluster centre, or “exemplar” are combined in an iterative procedure, where messages are exchanged between data points until a high-quality set of exemplars and corresponding clusters emerges (Frey and Dueck 2007). This technique can be utilised with metabolite concentrations to establish temporal changes due to simul-taneous abiotic and biotic stress, for example, to show how stress can cause an increase in a metabolite’s concentration in the plant with a corresponding decrease in concentra-tion of another metabolite, by clustering both time series together.
2 Materials and methods
2.1 Sample preparation and data acquisition
All the plants were presymtomatic of drought or disease stress although infection and drought conditions were con-irmed by plate testing for Fusarium oxysporum and by mon-itoring pot weight and physiological response. Full details of plant growth conditions, sample collection and preparation, data acquisition and pre-processing can be found in Rusi-lowicz et al. 2016, but will be briely described for clarity. For each of the four treatment groups (control (C), drought (D), Fusarium-infected (F) and combined stress (FD)), three plants (biological replicates) were harvested from each experimental group at daily intervals for 13 days. Each plant was removed carefully from its substrate to minimise damage to roots, shaken and the roots gently washed. Roots were dried before both leaves (L) and roots (R) were cut directly into beakers of liquid nitrogen. Only mature leaves were cut whilst dead or young leaves were discarded. After freezing, both leaves and roots were freeze dried for approxi-mately 48 h. Lyophilised samples were then stored at room temperature.
Triplicate root and leaf samples were taken for each treat-ment/time point. Samples were extracted by taking 5 mg of ground freeze dried material into 1 ml of methanol:water (1:1) and shaken for 30 min. Extracts were then centrifuged, with the supernatant diluted fourfold using methanol:water (1:1) before analysis by liquid chromatography–high resolu-tion mass spectrometry (LC–HRMS). Data was acquired in a random sample order with a quality control (QC) sample every six samples. QCs were sourced from a homogenised mixture of control samples collected from a previous similar pilot drought study of Medicago following a similar design (Ruscilowicz et al. 2016), as the amount of material avail-able from experimental samples in this combined stress
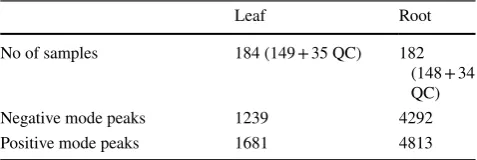
study was low. Both positive (+) and negative (−) mode LC–HRMS data were acquired for leaf (L) and root (R) sam-ples, producing four datasets (L+, L−, R+, R−). Data align-ment and peak picking was performed using Progenesis QI (Nonlinear Dynamics, Waters Corporation, Newcastle Upon Tyne, UK). Table 2 shows the number of peaks obtained together with the number of samples in each case.
2.2 Initial exploratory data analysis and pre‑processing
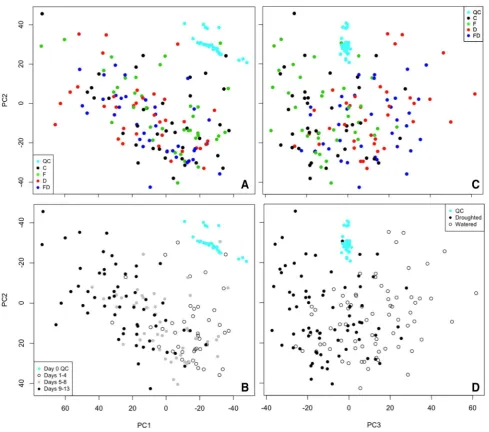
Analyses were conducted in R version 3.4.4 (R Core Team 2016, R Foundation for Statistical Computing, Vienna, Aus-tria) using code written in-house. In initial data explora-tion PCA (dimensions of data shown in Table 2) showed batch diferences to be the greatest source of variance for each dataset (Supplementary Figs. 1 and 2). To remove this technical variation, batch correction techniques were applied (Rusilowicz et al. 2016). The efectiveness of batch correc-tion was assessed using the Bhattacharrya distance (Supple-mentary Table 1) (Wehrens et al. 2016). Figure 1 shows PCA scores plots obtained after batch correction and scaling. UV-scaled data were used throughout the analyses, but unUV-scaled data were used to check for noise peaks in the inal output
Table 1 Summary of the advantages and disadvantages of transcriptomic techniques GP2S and TCAP GP2S
(Stegle at al. 2010)
TCAP
(Kiddle et al. 2010)
Advantages Efectively acts as a ilter to remove genes/metabolites which do not change in expression /concentration over time Computationally fast
Developed to be robust to outliers
Uses data from all biological replicates (not mean) to pro-duce models
Synchronized observation times are not required
Can be extended to elucidate the time at which diferential expression/metabolite concentration diferences begin to occur
Information–rich similarity measure and clustering algorithm inds gene expression / metabolite concentrations which follow the same time series or incorporates temporal changes: a) Delays—a similar time series proile but with a lag b) Transient correlations—similar time series for some time
points, not all
c) Inversions—same time series proile but inverted d) Combination of the above
Robust, with little user input Output simple to interpret
Disadvantages Only compares two treatment groups at a time Mean time series of replicates required
Whilst faster than other transcriptomics clustering algorithms, it is computationally intensive
Table 2 The number of samples (observations) in the data sets ana-lysed with the number of peaks (variables) found in each
All observations and variables were used in each principal component analysis for each data set respectively
Leaf Root
[image:4.595.53.546.69.231.2] [image:4.595.306.545.612.692.2]lists. PLS-DA was also performed on the batch corrected data using tenfold cross-validation (Supplementary Fig. 3).
Filtering of the time series was achieved in two ways. GP2S (Stegle et al. 2010) was conducted via the Discovery Environment at http://www.cyver se.org (Gof et al. 2011; Merchant et al. 2016) using all three biological replicates. Recommended starting values were used for the hyperpa-rameters of the Gaussian Processes (0.5 length scale, 1 pro-cess variance and 0.4 noise variance) and log Bayes factor score (3.0). Time series proiles for each peak were obtained from the median intensity of the three replicates at each time point (days 1–13) and the method provided a list of metabo-lites that difered in concentration over time for each pair of
treatment groups (C + D, C + F, C + FD, D + F, D + FD, and F + FD) in the L-dataset.
In a second approach, focussed on the identiication of diferences related to Fusarium infection, the median time proiles were calculated before iltering to remove those that changed very little over time. This method was applied to the pairs of treatment groups C + F and D + FD and was achieved by applying a threshold on the proiles’ variance across the time-series and discarding profiles with low variance. As with much of cluster analysis, this step was somewhat subjective with the threshold chosen to reduce the number of time-series proiles by approximately half. Control correction was applied for the D + FD analysis to
Fig. 1 PCA scores plots for all root samples in LC–MS negative mode (R−). a No distinction observed between treatment groups along PC1 and PC2. b The greatest variance is due to plant growth.
[image:5.595.54.544.53.485.2]eliminate metabolic changes due to plant growth. This was achieved by subtracting the corresponding median control from each time point in the other treatment groups.
2.3 Cluster analysis
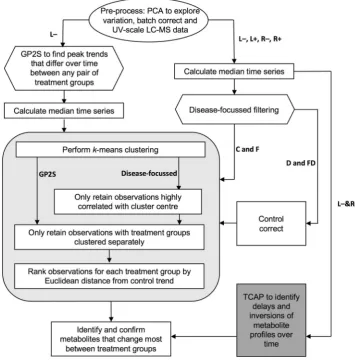
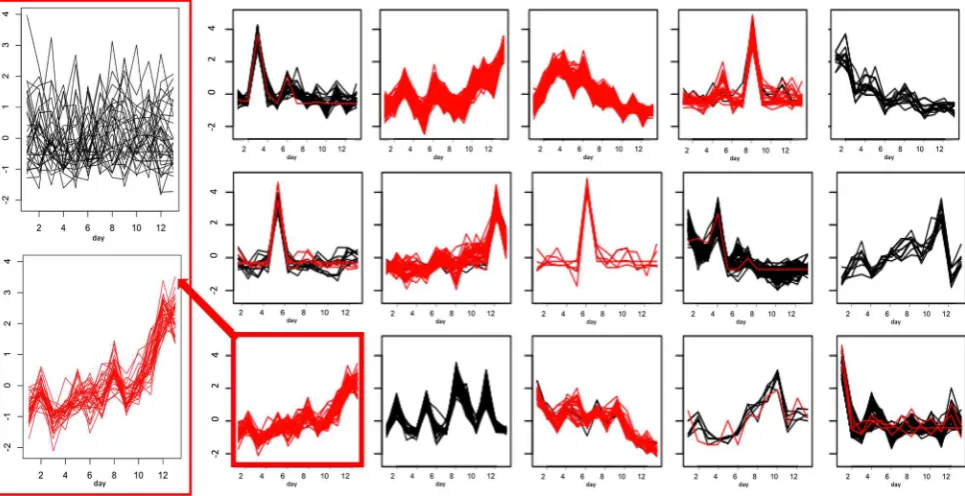
k-means clustering of the time-series proiles, using the Hartigan–Wong algorithm was performed in R following the schematic shown in Fig. 2. The Elbow method (Charrad et al. 2014) was used to determine the number of clusters, giving k = 5 for the GP2S iltered data (Fig. 3) and k = 15 for the disease-focussed approach. In both cases, further iltering of the clustered time-series was performed by irst removing those that had a correlation coeicient < 0.9 with the cluster centre. An example of the resulting focussed clusters is shown in Fig. 4. These more highly-correlated observations were then reduced further by removing any for which the two proiles corresponding to the same peak (one from each group) clustered together. The remaining time-series, representing peaks that difer between the two groups being analysed, were then ranked to determine the proiles that changed most over time as a result of drought,
Fusarium infection or combined stress. For each peak rep-resented, the Euclidean distance between the time series for each treatment group (D, F, and FD) and the control group (C) was calculated from the original batch-corrected data and used to rank the peaks. For the highest ranked peaks, F-tests were performed to compare the variance within the controls with the variance in each treatment group (Table 3). For these tests the data were batch corrected, but not scaled, and the median control value for the appropriate day was subtracted from each observation, including the controls to remove any growth efects.
2.4 Temporal clustering by ainity propagation (TCAP)
To reduce computation time, the median time-series proiles for the L- and R-datasets were iltered as described above to remove those with low variance. The resulting proiles from the two datasets were submitted together for analysis by TCAP version 2 (Kiddle et al. 2010) conducted in Matlab R2105a (The Mathworks, Inc, Natick, MA, USA) with the self-similarity input set at − 8.
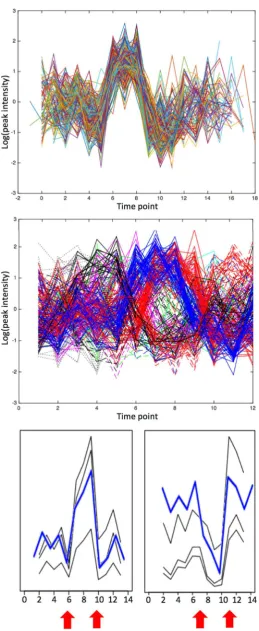
[image:6.595.184.540.357.718.2]Fig. 3 GP2S analysis of groups D (droughted, shown in green) and F (Fusarium infected, shown in red). a Example of GP2S output show-ing a deviation in trends for the peak with m/z 191.0204 at 3.61 min. The overall Gaussian it for both groups is shown in blue. (1)–(5): Clusters obtained by k-means cluster analysis of time series passing
the threshold in GP2S. The time series shown in a is found in cluster (3) for group F (red) and cluster (5) for group D (green). In fact, all time series in cluster (5) are from group D (green) and almost all time series in cluster (3) are from group F (red). Cluster (1) also shows quite a strong association with treatment group D (mostly green)
Fig. 4 Results of k-means cluster analysis of time series for groups C (control, black) and Fusarium infected (F, red) for negative mode root (R-). The x-axis corresponds to time and the y-axis to peak intensity.
[image:7.595.57.540.52.343.2] [image:7.595.57.540.434.682.2]3 Results
After batch correction, PCA showed that most variance was due to plant growth (Fig. 1). Whilst variation between watered and droughted plants can be seen along PC3 with overlap between early day observations, no separation is observed between D and FD, or between C and F (i.e.
Fusarium efects). This is also the case for PCA conducted with only C and F groups or D and FD groups included to remove the dominance of drought (Supplementary Fig. 4). Furthermore, PLS-DA did not highlight any disease-related diferences (Supplementary Fig. 3).
Using the GP2S approach, the log Bayes scores revealed diferences between the pairs of treatment groups, C + D, C + FD, F + D and F + FD, i.e. drought efects, but no dif-ferences between the proiles for D + FD and C + F, i.e.
Fusarium efects, were detected above the threshold set. Interestingly, more diferences above the threshold were detected when the analyses involved the combined stress group, with 332 and 398 peaks highlighted for C + FD and F + FD respectively, in comparison to 226 and 250 peaks for the analyses involving drought, C + D and F + D respectively. Figure 3 shows the k-means clustering of the time series for metabolites passing the threshold in the F + D analysis with three of the ive clusters showing a very strong relationship with one particular treatment group, showing that certain trends are associated with a particular group. This separate clustering of treatment groups also occurred for the C + D, C + FD and F + FD GP2S analyses.
As the GP2S approach did not reveal diferences between the groups D and FD or C and F, a diferent approach to iltering was adopted with these groups in order to identify disease-related diferences. Figure 4 shows the results of k-means clustering of the C and F data, using the alternative
method. The time series are highly correlated with cluster centres and show clustering according to group as seen for proiles identiied by GP2S. As the observations for which the time-series for both groups occurred in the same clus-ter have been removed, the time-series for any peak repre-sented here must show a diferent trend in the two groups. The close-up of Cluster 11 in Fig. 4, for example, contains observations from the F group only with the corresponding “partner” observations for the C group either appearing in a separate cluster or having been iltered out due to little change over time.
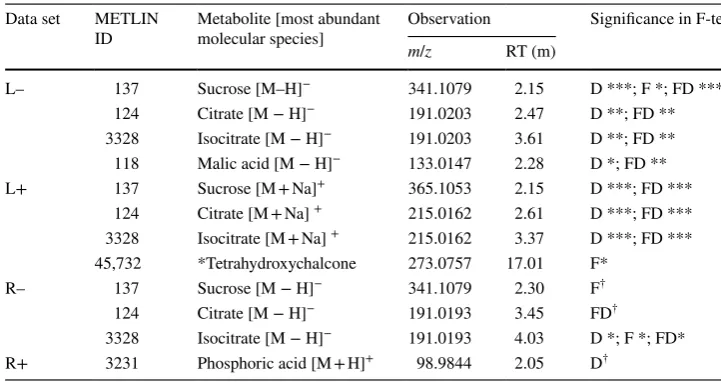
When all four treatment groups were considered, drought-related responses dominated both leaf and root analyses for both LC-MS modes with time series for watered plants (C/F) clustering separately from droughted observations. The Euclidean distance was calculated using unscaled data to identify the time series that difered most from the con-trols. Table 3 shows the highest ranked metabolites with conirmed identiications (level 1 as described in Salek et al. 2013) with the signiicance levels obtained for F tests between each treatment group and the control group. For many of the highly-ranked metabolites the changes only appear to be signiicant in the droughted groups (D and FD), however, sucrose and citrate also difer signiicantly with
Fusarium infection (F), with this group presenting the only signiicant changes in some cases. Furthermore, changes in tetrahydroxychalcone were only signiicant for the diseased group (F).
Further metabolites, either conirmed or airmed (level 2 identiication) with time series showing diferent trends to the controls are given in Supplementary Tables 2–5. Standards conirmed sucrose and citrate/isocitrate to be the metabolites responding most to drought stress, in line with previous observations on Arabidopsis thaliana and
Table 3 Conirmed metabolites (identiied to level 1) with time series that clustered according to treatment group
Signiicance levels for the F tests comparing the variance of treatment groups with that of the controls are indicated by: ***< 0.001; **< 0.01; *< 0.05; †< 0.1 (*tetrahydroxychalcone was only identiied to level 2) Data set METLIN
ID
Metabolite [most abundant molecular species]
Observation Signiicance in F-test
m/z RT (m)
L– 137 Sucrose [M–H]− 341.1079 2.15 D ***; F *; FD *** 124 Citrate [M − H]− 191.0203 2.47 D **; FD ** 3328 Isocitrate [M − H]− 191.0203 3.61 D **; FD ** 118 Malic acid [M − H]− 133.0147 2.28 D *; FD ** L+ 137 Sucrose [M + Na]+ 365.1053 2.15 D ***; FD ***
124 Citrate [M + Na] + 215.0162 2.61 D ***; FD *** 3328 Isocitrate [M + Na] + 215.0162 3.37 D ***; FD *** 45,732 *Tetrahydroxychalcone 273.0757 17.01 F*
R– 137 Sucrose [M − H]− 341.1079 2.30 F† 124 Citrate [M − H]− 191.0193 3.45 FD†
[image:8.595.176.537.56.247.2]Thelungiella salsuginea (Pinheiro et al. 2018; Bechtold et al. 2016). However, the disease focussed approach, using only C and F data or only D and FD data, showed the trends for sucrose and citrate peaks, as well as malic acid, to be diferent for diseased (F or FD) and non-diseased (C or D) groups. Figure 5 shows the time series for sucrose peaks with both positive and negative LC-MS modes highlighting diferences between treatment groups for both leaf and root. Whilst drought-related diferences dominate in leaf, with observations from watered groups, C and F, showing the same slight downward trend, there is a consistent diference between droughted (D) and combined stress (FD) observa-tions, with an increase in late stress for D not seen for FD. In roots, watered groups show a rise in late stress, with a inal decrease seen for C but not F and the times-series pro-iles difer greatly between drought and combined stress. The highest sucrose concentration in D occurs between days 6–9, but not until days 11–13 in FD. In D, this increase in root corresponds to a decrease in leaf, whereas in FD a dip before the major increase in sucrose concentration in
root corresponds to the highest levels in leaf. Citrate levels decrease with drought (D and FD) and present large luctua-tions that occur on alternating days between leaf and root in the combined stress group (Supplementary Fig. 5).
To investigate the use of temporal clustering by ainity propagation (TCAP) with metabolomics data, the negative mode datasets for leaf and root were combined after pre-liminary iltering. We found that citrate peaks for diferent treatment groups did not cluster together and that leaf and root time series occurred in separate clusters. This was also true of sucrose for three of the four treatment groups (C, F and D), but allowing delays and inversions to be considered in the cluster analysis led to sucrose peaks for both root and leaf appearing in the same cluster in the combined stress group (FD). The peak intensity proile over time obtained for sucrose in root FD is an inversion with a delay of one day from the leaf FD proile i.e. the sucrose concentration in leaf is maximal between days 7–9 and falls at day 10, while in root, it is at a minimal for days 8–10 and increases at day 11 (Fig. 6). The incorporation of time delays and
[image:9.595.55.540.327.683.2]inversions is clearly applicable in metabolomics as well as in transcriptomics.
4 Discussion and conclusions
Drought stress in leguminous plants primarily afects pho-tosynthesis and cell growth (Araújo et al. 2015) with carbon metabolism afecting the concentration of sugars, used as secondary intracellular signalling messengers (Chaves et al.
2009). These soluble sugars such as sucrose interact with plant hormones under plant stress and previously have been found to increase in concentration as a result of drought with an accumulation in the leaf as photosynthesis continues despite a deicit of water (Chaves 1991). This explains the trends observed in our leaf data sets for droughted plants (D and DF) in the leaf data sets. However, a decrease in solu-ble sugars has been observed previously for severe drought stress (Pinheiro et al. 2001), which could explain the late decrease in sucrose concentration in leaf. Whilst F-tests show that both droughted groups have similar signiicance for the diference in variance from the controls, the decrease in sucrose concentration occurs earlier in the FD group (day 10) than in the D group (days 12–13), suggesting that bined stress exacerbates the efect of drought, and the com-bined efect of Fusarium infection and drought lead to a more urgent stress response. As Fusarium oxysporum causes vascular blockage and dehydration of the plant (Di Pietro et al. 2003), it would be expected that metabolic changes due to infection resemble those for drought.
Our results support earlier indings (Sanchez et al. 2008), which suggest that model legumes sufering from abiotic stress show an increase in osmoprotectors such as sugars, with a concurrent decrease in many organic acids such as citric acid and malic acid. It has been suggested that this depletion of organic acids is due to the reallocation of ixed carbon to the much-needed synthesis of sucrose from photo-synthesis. Changes in concentration found for dehydroascor-bate, the oxidised form of antioxidant ascorbic acid, in both leaf and root particularly in treatment groups D and FD, agrees with other investigations in the literature (Potters et al. 2004). Dehydroascorbate is involved in glutathione metabolism, another well-known antioxidant, therefore the related increase in the oxidised form glutathione disulphide in treatment groups D and FD again provides evidence of oxidative stress. An increase in lavonoid secondary metabo-lites provides evidence of plant response to pathogen infec-tion (Falcone Ferreyra et al. 2012). Similarly, the accumula-tion of amino acids due to stress-induced protein breakdown, the down regulation of energy consuming processes and shift from growth to survival are all observed for the treat-ment groups, particularly in those afected by drought (Witt et al. 2012; Muscolo et al. 2015).
It is clear from Table 3 that changes are more extreme in leaf than in root and that signiicant diferences in leaf are dominated by drought response, although tetrahydroxy-chalcone (butein) shows signiicant changes only with dis-ease (F). This chalcone is a precursor to lavonoid synthe-sis in leguminous plants (Mierziak et al. 2014). Flavonoids are known to have antimicrobial efects, including potent antifungal activity against Fusarium oxysporum (Galeotti et al. 2008). Only one sucrose species shows a signiicant diference between the variance in the controls and that in the diseased group (F), but changes in malic acid concen-tration due to combined stress are an order of magnitude more signiicant than for drought. The pathogen infects the root (Di Pietro et al. 2001) and, although changes are considerably smaller in root than in leaf, it is noticeable that there are more signiicant changes due to Fusarium
infection and combined stress in root. An increase in phos-phoric acid concentration seen for control and Fusarium -infected plants shows that the beneicial root-associated mycorrhizal fungi are functioning normally in modulat-ing the plant metabolome, improvmodulat-ing water uptake and nutrition by elevating phosphate supply (Schweiger et al.
2014). In drought conditions, this modulation is adversely afected and phosphates cannot be taken up by the plant, explaining the relatively unchanged levels of phosphoric acid over time for D/FD groups.
The export of sugars from wilting leaf to growing roots is necessary to ensure plant growth (Chaves 1991), and the fall in sucrose concentration exhibited in the leaf FD at day 10 could explain the corresponding rise in sucrose in root FD, identiied by TCAP analysis. Although compu-tationally intensive, this tool developed for transcriptom-ics has proved useful in metabolomtranscriptom-ics. We suggest using this technique as a inal step after iltering to reduce the number of time series, as demonstrated here.
The use of GP2S allowed identiication of metabolic changes due to drought, but not Fusarium infection, whereas the disease focussed approach allowed more subtle diferences to be found (i.e. between D and FD or between C and F). Our investigations showed that the sug-gested threshold used in GPS2 was too high for such dif-ferences. However, lowering the threshold did not improve the results and the use of GPS2 as an alternative irst ilter missed metabolites that were identiied using the ilter based on variance. Furthermore, clustering could suggest metabolites are involved in the same biochemical pathway or process for example, citrate and malic acid, whereas GP2S only identiies information on plant response other than deviating time series trends that deviate between treatment groups. We therefore conclude that the focussed
groups cluster together before inally ranking according to diference from the control is the most appropriate.
The probing of metabolomic data using transcriptomic techniques and new clustering procedures has proven to be efective in identifying changes in metabolite concentrations and biological processes of plants subjected to simultane-ous abiotic and biotic stress. The focussed k-means cluster-ing has been efective in identifycluster-ing diferences that were not revealed using the standard chemometric techniques of PCA and PLS-DA. The method was also more efective than the GPS2 method used in transcriptomics and, in addition to expected stress responses conirming the results of other investigations in the literature, has identiied more subtle changes, providing insight into the mechanism of combined abiotic and biotic stress (combined stress) on leguminous plants that could aid the identiication of more resilient varieties to improve crop yield. The TCAP analysis, also borrowed from transcriptomics did prove useful however, showing that delays and inversions can provide additional information and should be considered in the analysis of metabolomics time course data.
Acknowledgement This work was supported by the Department of Environment, Food and Rural Afairs (Defra), UK and the Euro-pean Union’s Seventh Framework Programme for research, techno-logical development and demonstration [Grant Agreement No. FP7-KBBE-2011-5 -289562 ABSTRESS]. ED was supported by a Daphne Jackson Trust Fellowship funded by the RSC and BBSRC. MJR was supported by the EPSRC [Grant No. EP/F001096/1].
Author contributions AC and PM conceived and designed research. MD conducted experiments. ED and JW analysed data. ED, UB and JW wrote the manuscript. All authors read and approved the manuscript.
Open Access This article is distributed under the terms of the Crea-tive Commons Attribution 4.0 International License (http://creat iveco mmons .org/licen ses/by/4.0/), which permits unrestricted use, distribu-tion, and reproduction in any medium, provided you give appropriate credit to the original author(s) and the source, provide a link to the Creative Commons license, and indicate if changes were made.
References
AbuQamar, S., Luo, H., Laluk, K., Mickelbart, M. V., & Mengiste, T. (2009). Crosstalk between biotic and abiotic stress responses in tomato is mediated by the AIM1 transcription factor. The Plant Journal, 58, 347–360.
Aliferis, K. A., Faubert, D., & Jabaji, S. (2014). A metabolic proiling strategy for the dissection of plant defense against fungal patho-gens. PLoS ONE, 9(11), e111930.
Araújo, S. S., Beebe, S., Crespi, M., Delbreil, B., González, E. M., Gruber, V., et al. (2015). Abiotic stress responses in legumes: Strategies used to cope with environmental challenges. Critical Reviews in Plant Sciences, 34(1–3), 237–280.
Bechtold, U., Karpinski, S., & Mullineaux, P. M. (2005). The inluence of the light environment and photosynthesis on oxidative signaling
responses in plant-biotrophic pathogen interactions. Plant Cell and Environment, 28, 1046–1055.
Bechtold, U., Penfold, C. A., Jenkins, D. J., Legaie, R., Moore, J. D., Lawson, T., et al. (2016). Time-series transcriptomics reveals that AGAMOUS-LIKE22 afects primary metabolism and develop-mental processes in drought-stressed Arabidopsis. The Plant Cell, 28(2), 345–366.
Beckman, C. H. (1987). The nature of wilt diseases of plants. Saint-Paul: American Phytopathological Society.
Blekherman, G., Laubenbacher, R., Cortes, D. F., Mendes, P., Torti, F. M., Akman, S., et al. (2011). Bioinformatics tools for cancer metabolomics. Metabolomics, 7(3), 329–343.
Breeze, E., Harrison, E., McHattie, S., Hughes, L., Hickman, R., Hill, C., et al. (2011). High-resolution temporal proiling of transcripts during Arabidopsis leaf senescence reveals a distinct chronology of processes and regulation. The Plant Cell, 23(3), 873. Charlton, A., Donarski, J., Harrison, M., Jones, S., Godward, J.,
Oehls-chlager, S., et al. (2008). Responses of the pea (Pisum sativum L.) leaf metabolome to drought stress assessed by nuclear magnetic resonance spectroscopy. Metabolomics, 4(4), 312–327.
Charrad, M., Ghazzali, N., Boiteau, V., & Niknafs, A. (2014). NbClust: An R package for determining the relevant number of clusters in a data set. Journal of Statistical Software, 61(6), 1–36.
Chaves, M. M. (1991). Efects of water deicits on carbon assimilation.
Journal of Experimental Botany, 42(1), 1–16.
Chaves, M. M., Flexas, J., & Pinheiro, C. (2009). Photosynthesis under drought and salt stress: Regulation mechanisms from whole plant to cell. Annals of Botany, 103(4), 551–560.
Di Pietro, A., García-Maceira, F. I., Meglecz, E. Y., & Roncero, M. I. (2001). A MAP kinase of the vascular wilt fungus Fusarium oxysporum is essential for root penetration and pathogenesis.
Molecular Microbiology, 39, 1140–1152.
Di Pietro, A., Madrid, M. P., Caracuel, Z., Delgado-Jarana, J., & Ron-cero, M. I. G. (2003). Fusarium oxysporum: Exploring the molec-ular arsenal of a vascmolec-ular wilt fungus. Molecular Plant Pathology, 4, 315–325.
Falcone Ferreyra, M. L., Rius, S. P., & Casati, P. (2012). Flavonoids: Biosynthesis, biological functions, and biotechnological applica-tions. Frontiers in Plant Science, 3, 222.
Fernie, A. R., & Schauer, N. (2009). Metabolomics-assisted breeding: A viable option for crop improvement? Trends in Genetics, 25, 39–48.
Frey, B., & Dueck, D. (2007) Clustering by passing messages between data points. Science, 315, 972–976.
Galeotti, F., Barile, E., Curir, P., Dolci, M., & Lanzotti, V. (2008). Flavonoids from carnation (Dianthus caryophyllus) and their anti-fungal activity. Phytochemistry Letters, 1(1), 44–48.
Gof, S. A., Vaughn, M., McKay, S., Lyons, E., Stapleton, A. E., Gessler, D., et al. (2011). The iPlant collaborative: Cyberinfra-structure for plant biology. Frontiers in Plant Science, 2, 34. Hageman, J. A., van den Berg, R. A., Westerhuis, J. A., Hoefsloot,
H. C. J., & Smilde, A. K. (2006). Bagged K-means clustering of metabolome data. Critical Reviews in Analytical Chemistry, 36(3–4), 211–220.
Heard, N. A. (2011). Iterative reclassiication in agglomerative cluster-ing. Journal of Computational and Graphical Statistics, 20(4), 920–936.
Hendriks, M. M. W. B., van Eeuwijk, F. A., Jellema, R. H., Westerhuis, J. A., Reijmers, T. H., Hoefsloot, H. C. J., et al. (2011). Data-processing strategies for metabolomics studies. TrAC Trends in Analytical Chemistry, 30(10), 1685–1698.
Li, X., Lu, X., Tian, J., Gao, P., Kong, H., & Xu, G. (2009). Application of Fuzzy c-Means Clustering in Data Analysis of Metabolomics.
Analytical Chemistry, 81(11), 4468–4475.
Liu, X., & Liu, C. (2016). Efects of drought-stress on Fusarium crown rot development in Barley. PLoS ONE, 11(12), e0167304. Madsen, R., Lundstedt, T., & Trygg, J. (2010). Chemometrics in
metabolomics—A review in human disease diagnosis. Analytica Chimica Acta, 659(1), 23–33.
Merchant, N., Lyons, E., Gof, S., Vaughn, M., Ware, D., Micklos, D., et al. (2016). The iPlant collaborative: Cyberinfrastructure for enabling data to discovery for the life sciences. PLoS Biology, 14(1), e1002342.
Mierziak, J., Kostyn, K., & Kulma, A. (2014). Flavonoids as important molecules of plant interactions with the environment. Molecules, 19(10), 16240–16265.
Mittler, R., & Blumwald, E. (2010). Genetic engineering for modern agriculture: Challenges and perspectives. Annual Review of Plant Biology, 61, 443–462.
Muscolo, A., Junker, A., Klukas, C., Weigelt-Fischer, K., Riewe, D., & Altmann, T. (2015). Phenotypic and metabolic responses to drought and salinity of four contrasting lentil accessions. Journal of Experimental Botany, 66(18), 5467–5480.
Pinheiro, C., Chaves, M. M., & Ricardo, C. P. (2001). Alterations in carbon and nitrogen metabolism induced by water deicit in the stems and leaves of Lupinus albus L. Journal of Experimental Botany, 52(358), 1063–1070.
Pinheiro, C., Dickinson, E., Marriott, A., Ribeiro, I. C., Pintó-Mar-ijuan, M., António, C., et al. (2018) Distinctive phytohormonal and metabolic proiles of Arabidopsis thaliana and Thellungiella salsuginea under similar soil drying. Manuscript Submitted. Potters, G., Horemans, N., Bellone, S., Caubergs, R. J., Trost, P.,
Guisez, Y., et al. (2004). Dehydroascorbate inluences the plant cell cycle through a glutathione-independent reduction mecha-nism. Plant Physiology, 134(4), 1479–1487.
Ramírez-Suero, M. (2010). A study on the susceptibility of the model legume plant Medicago truncatula to the soil-borne pathogen
Fusarium oxysporum. European Journal of Plant Pathology, 126(4), 517–530.
Rasmussen, S., Parsons, A. J., & Jones, C. S. (2012). Metabolomics of forage plants: A review. Annals of Botany, 110, 1281–1290. Ren, S., Hinzman, A. A., Kang, E. L., Szczesniak, R. D., & Lu, L. J.
(2015). Computational and statistical analysis of metabolomics data. Metabolomics, 11(6), 1492–1513.
Rispail, N., & Rubiales, D. (2015). Rapid and eicient estimation of pea resistance to the soil-borne pathogen Fusarium oxysporum by infrared imaging. Sensors, 15(2), 3988–4000.
Rusilowicz, M., Dickinson, M., Charlton, A., O’Keefe, S., & Wilson, J. (2016). A batch correction method for liquid chromatography– mass spectrometry data that does not depend on quality control samples. Metabolomics, 12(3), 56.
Salek, R. M., Steinbeck, C., Viant, M. R., Goodacre, R., & Dunn, W. B. (2013). The role of reporting standards for metabolite annotation and identiication in metabolomic studies. GigaScience, 2, 13. Sanchez, D. H., Lippold, F., Redestig, H., Hannah, M. A., Erban, A.,
Krämer, U., et al. (2008). Integrative functional genomics of salt acclimatization in the model legume Lotus japonicus. The Plant Journal, 53(6), 973–987.
Santino, A., Taurino, M., De Domenico, S., Bonsegna, S., Poltronieri, P., Pastor, V., Flors, V., et al. (2013). Jasmonate signaling in plant development and defense response to multiple (a) biotic stresses.
Plant Cell Reports, 32(7), 1085–1098.
Schweiger, R., Baier, M. C., Persicke, M., & Müller, C. (2014). High speciicity in plant leaf metabolic responses to arbuscular mycor-rhiza. Nature Communications, 5, 3886.
Stegle, O., Denby, K. J., Cooke, E. J., Wild, D. L., Ghahramani, Z., & Borgwardt, K. M. (2010). A robust Bayesian two-sample test for detecting intervals of diferential gene expression in microarray time series. Journal of Computational Biology, 17(3), 355–367. Swindell, W. R., Huebner, M., & Weber, A. P. (2007). Transcriptional
proiling of Arabidopsis heat shock proteins and transcription fac-tors reveals extensive overlap between heat and non-heat stress response pathways. BMC Genomics, 8(1), 125.
Wanichthanarak, K., Fahrmann, J. F., & Grapov, D. (2015). Genomic, proteomic, and metabolomic data integration strategies. Bio-marker Insights, 10(Suppl 4), 1–6.
Wehrens, R., Hageman, J. A., van Eeuwijk, F., Kooke, R., Flood, P. J., Wijnker, E., et al. (2016). Improved batch correction in untargeted MS-based metabolomics. Metabolomics, 12, 88.
Witt, S., Galicia, L., Lisec, J., Cairns, J., Tiessen, A., Araus, J. L., et al. (2012). Metabolic and phenotypic responses of greenhouse-grown maize hybrids to experimentally controlled drought stress.
Molecular Plant, 5(2), 401–417.
Yoshioka, K., Kachroo, P., Tsui, F., Sharma, S. B., Shah, J., & Klessig, D. E. (2001). Environmentally sensitive, SA-dependent defense responses in the cpr22 mutant of Arabidopsis. Plant Journal, 26(4), 447–459