www.electrochemsci.org
Ultra Trace Copper Determination by Catalytic-Adsorptive
Stripping Voltammetry Using an Alizarin Red S modified
Graphite Electrode
Cassandra Renata B. Cordeiro1, Aldaléa L. Brandes Marques1,*, Edmar P. Marques1 , William S. Cardoso1 and Jiujun Zhang
1Department of Technology Chemistry, Federal University of Maranhão, Av. dos Portugueses, S/N,
Campus do Bacanga, São Luis – MA, Brazil
*E-mail: [email protected]
Received: 3 September 2006 / Accepted: 25 September 2006 / Published: 1 November 2006
A sensitive stripping voltammetric procedure for ultra trace copper determination is reported in this paper. A Catalytic-Adsorptive Stripping Voltammetric (CASV) mechanism is proposed to interpret the amplified sensitivity. The procedure is based on the interfacial preconcentration of copper(II) on an alizarin red S (ARS) modified graphite electrode through a surface coordination effect. The formed ultra trace surface copper complex, i.e. Cu(II)-ARS, can be reduced to Cu(I)-ARS at the preconcentration potential range of -0.35 V to -0.5 V (vs. SCE). Cu(I)-ARS displays a catalytic activity towards proton reduction to form H2, which is then stored in the space between the Cu-ARS layer and
the electrode surface. This catalysis process could produce a considerable amount of H2, which is then
catalytically oxidized back to protons during the stripping process thus producing a large stripping peak current. This peak current is proportional to the quantity of pre-concentrated copper on the electrode surface. The application of the procedure in ultra-purified water samples demonstrates that it is possible to determine Cu(II) at a level as low as 1.7×10⁻¹³ mol/L in real samples with a recovery of 103%, a standard deviation (triplicate measurements) of 4.7%, and a confidence level of 95%.
Keywords: Copper, Alizarin Red S, Catalytic-Adsorptive Stripping Voltammetry, Trace electroanalysis
1. INTRODUCTION
Catalytic-Adsorptive Stripping Voltammetry (CASV) [1-4]. This analysis can detect metals at the picomolar level, which can be extremely useful for the determination of ultra trace metals for environmental, industrial and clinic sample analysis [5,6].
The first step for CASV analysis is the in-situ preconcentration of target metal ions on the ligand-modified electrode surface in the sample solution using an adsorption or a surface coordination process. When the target metal ion coordinates with the modified electrode surface, it can form some surface catalyst sites, even when the adsorption quantity is very small. When the direction of the electrode potential is changed to positive during the stripping step, the surface catalyst sites can catalyze the oxidation of deliberately added, highly concentrated substrates. The catalytic current increases with the surface concentration of the pre-concentrated target metal, which is in turn proportional to the target metal ion concentration in the sample solution.
The representative system is one that analyzes ultra trace levels of platinum-group metals [1, 2]. In these analyses, Wang et al. employed an electrode surface modified by formazone. When the electrode was exposed to a sample solution containing ultra trace levels of platinum or rhodium ions, the surface complex between platinum or rhodium and the formazone-modified surface was formed as Pt(CH2 = NNH2)2+2), which then catalyzed the hydrogen process to give significant indicative current.
Copper is an essential trace element for biological processes, even at an ultra trace level [7, 8]. Due to its mobilization and redox activity, copper is believed to play a central role in the formation of reactive oxygen species, such as O2-. and OH. radicals. These radicals bind very rapidly to DNA, and
can cause damage by breaking the DNA strands or modifying the bases and/or deoxyribose, therefore leading to carcinogenesis. Effective procedures for determining trace copper in water samples are highly desired [9]. Van den Berg et al. [10, 11] used catechol as the complexing agent in seawater samples to form an adsorbed Cu(II) complex for the adsorptive striping analysis of trace copper. Wier et al. [12] developed a multiple-use, polymer-modified electrode based on dimethylsufinated bathophenanthroline for voltammetric measurements of trace copper. O’Riordan et al. [13] used a poly(pyrrole-N-carbodithioate) electrode for stripping to analyze copper ions. Prabhu et al. [14] described a carbon paste electrode modified by 2,9-dimethyl-1,10-phenanthroline for the preconcentration and determination of copper. These developments have increased the sensitivity level to 10-10 (mol/L) for copper ions. However, for copper content below 10-10 mol/L, further
methodological development and procedure optimization are needed.
In our previous work [15], surface Alizarin Red S, irreversibly adsorbed on a graphite electrode, was employed to coordinate copper in the solution to form a surface complex for the purpose of trace copper analysis. In this initial work the sensitivity was only sufficient enough to determine a copper level of 10-8 mol/L. To continue this work, we revisited this system putting greater
2. EXPERIMENTAL PART
2.1 Equipment and Materials
A Model BAS CV-50W voltammetric analyzer coupled with a GATEWAY2000 GP6266 computer was used for electrochemical measurements.
Two pyrex electrochemical cells were employed in the process. One with a single compartment, defined as the preconcentration cell, was used for preconcentration and surface complex formation, and the other, which had three compartments, defined as the sweeping cell, was used for voltammetric measurements. Both cells had gas inlets and outlets that allowed inert gas to flow through the solution. For the sweeping cell, three electrodes were used, namely the working electrode (i.e., a pyrolytic graphite disk sealed on a copper stick with a disk surface exposed to the solution; the active area of the electrode was 0.15 cm-2), the counter electrode (i.e., a platinum wire), and the
reference electrode (i.e., a saturated calomel electrode, abbreviated as SCE).
2.2 Reagents and Solutions
All chemicals including copper sulphate pentahydrate, sodium hydroxide, sodium perchlorate, acetic acid, acetate sodium and Alizarin Red S(ARS) were purchased from MERCK. The solutions were prepared using water that had been ultra-purified through an Ultra pure Water System (>18 M cm, NANOPURE, Model D4741). Acetate buffers (i.e., acetic acid and acetate sodium 0.02 mol/L, pH 3.5; and 0.06 mol/L pH 5.5 adjusted by NaOH 1.0 mol/L solution) were used to control the pH. A 0.1 mol/L NaClO4 was used as the supporting electrolyte.
Cu(II) ions containing solutions with the concentrations of 1.0×10⁻⁵ mol/L, 1.0×10⁻⁷ mol/L and 2×10⁻⁹ mol/L respectively were prepared by diluting a 1.0×10⁻³ mol/L of CuSO
4 stock solution.
The standard addition of Cu(II) in the measurement cell was made from a solution with a Cu(II) concentration of 2×10⁻⁹mol/L. The ARS solution, with a concentration of 1×10⁻⁴mol/L, was prepared for the electrode modification.
2.3 Methods
Electrode modification
The graphite electrode surface was first polished using rough and fine sandpapers (2000 m), sonicated in pure water for 10 minutes, and rinsed by acetone and water to make a clean surface. This electrode was then immersed in a 1×10⁻⁴ mol/L ARS solution for about 20 seconds to let ARS absorb on the electrode surface. The electrode is then ready for the copper preconcentration step.
Voltammetric procedure for Cu(II) determination
(A)
(B)
process is called open circuit preconcentration. After this process, the electrode was removed, washed with water and transferred to the sweeping cell, which, containing only pure water, was saturated with N2. Then enough acetic buffer was added into this solution to bring the concentration to 0.02 mol/L
and the pH to 3.5. The electrode potential was controlled at the value, ca., –0.35 V or –0.5 V (vs. SCE) for 180 seconds to reduce all surface Cu(II) to either Cu(I) or Cu(0), respectively. In this case, we believe that the oxidation state on the surface was Cu(I), and the surface state was the Cu(I)-ARS complex. After this reduction process, the electrode was immediately scanned toward a positive potential to strip all pre-concentrated copper from Cu(I) to Cu(II) in the surface copper-ARS complex. The stripping peak current on voltammogram was used to indicate the Cu(II) concentration in the preconcentration cell.
All experiments were conducted at room temperature (25 ± 2oC).
3. RESULTS AND DISCUSSION
3.1 Voltammetric Response and possible mechanism for the formation of the Cu(II)-ARS complex on the electrode surface
Referring to our previous work [15], the ARS molecule can be strongly adsorbed on a graphite electrode surface, coordinating with the solution copper ion to form a surface complex.
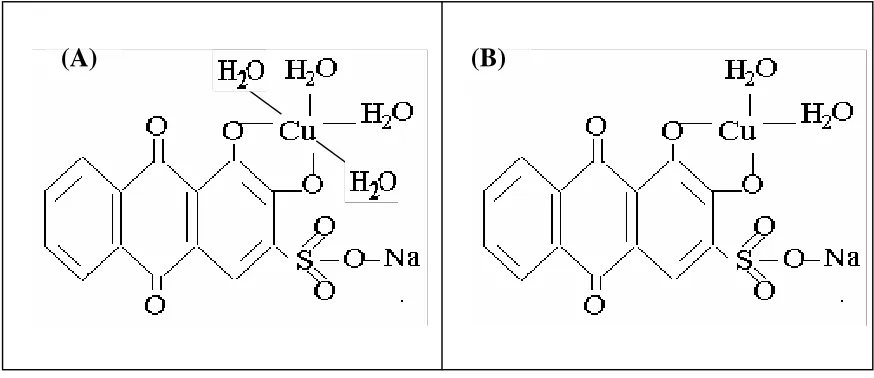
[image:4.612.88.525.485.674.2]The molecular structures of the formed surface Cu(II) complex, and its one-electron reduction product the Cu(I)-ARS complex, is proposed in Figure 1, based on fact the Cu(II) ion has a coordination number of 6. The formula for the compound should, therefore, contain 4 water molecules if the central ion is bonded to only two sites of the ligand molecule. In addition, this proposed structure is also supported by the fact that the voltammograms of the pure ligand and coordinated ligand (Figure not shown) presented the same waves that corresponded to the paraquinone group, indicating that this group may not participate in the coordination with the copper center.
Figure 2 shows the surface stripping voltammogram after a nonelectrolyte preconcentration step in an aqueous solution that only contains 1×10-12 mol/L Cu(II) ions. The large stripping peak near
-0.35V (vs. SCE) is the surface electrochemical response of ARS ligand. The corresponding reaction was assigned to a two-electron reversible redox process of the quinine group [15]. The stripping peak near -0.1V is believed to be the catalytic-adsorptive current associated with the preconcentrated Cu(I)-ARS complex. . The possible mechanism for the whole process may be proposed as follows.
Preconcentration step:
Cu(II) (solution) + ARS (adsorbed) [Cu(II)-ARS] (adsorbed) (1)
Reduction step:
[Cu(II)-ARS] (adsorbed) + e- [Cu(I)-ARS] (adsorbed) (2)
[Cu(I)-ARS] (adsorbed) + H+ [H+-Cu(I)-ARS] (adsorbed) (3)
[H+-Cu(I)-ARS] (adsorbed) [H-Cu(II)-ARS] (adsorbed) (4)
2[H-Cu(II)-ARS] (adsorbed) 2[Cu(I)-ARS] (adsorbed) + H2 (Stored) (5)
In the reduction step, the catalytic formation of an adduct between hydrogen and the Cu(I)-ARS complex by reactions (3), (4) and (5) may combine together to form H2, which is then stored in
the space between the electrode surface and the Cu-ARS layer. In reaction (5), the adsorbed Cu(I)-ARS complex will continuously carry on the catalytic reaction cycle from reactions (3) to (5). Due to the nature of the catalytic reaction, a trace surface Cu-ARS complex can start the whole process and produce a large quantity of H2. In the preconcentration period, the quantity of formed H2 should
continuously increase as the catalyst surface quantity increases. After the preconcentration and reduction steps, when the electrode potential is scanned toward a positive direction, the stripping step occurs. The proposed mechanism is as follows:
[Cu(I)ARS] (adsorbed) [Cu(II)ARS] (adsorbed) + e- (6)
H2 (Stored) + 2[Cu(II)ARS] (adsorbed) 2[H-Cu(II)-ARS] (adsorbed) (7)
[H+-Cu(I)-ARS] (adsorbed) [Cu(I)-ARS] (adsorbed) + H+ (9)
[image:6.612.215.375.240.415.2]The formed [Cu(I)-ARS](adsorbed) in reaction (9) would be oxidized back to [Cu(II)-ARS](adsorbed) according to reaction (6), making a continuous catalytic reaction cycle from reactions (6) to (9). The charge under the stripping peak near 0.1 V should be associated with the coupling of the catalytic (from the oxidation of stored H2) and accumulation processes. The mechanism of reactions
(1) – (9) was proposed based on our current understanding. Further work is definitely needed for confirmation, and work on this is continuing in our laboratory.
Figure 2: Surface stripping voltammogram of Cu(II)-ARS on the graphite electrode. Conditions: [Cu(II)] = 5×10-12 mol/L; preconcentration in the nonelectrolyte for 180 seconds; prereduction for 90 seconds at –0.35 V (vs. SCE); Stripping potential scan rate at 100 mV/s; pH 3.5 and acetate buffer 0.02 mol/L.
3.2 Optimization of the experimental parameters
For voltammetric techniques, including the preconcentration and adsorptive stripping steps, the measurement sensitivity is largely dependent on the procedure parameters [16]. Therefore, an optimization for experimental conditions is necessary.
Several experimental conditions were optimized in this work including instrumental operation parameters, ARS concentration for electrode modification, preconcentration time, reduction time and potential, solution pH, solution supporting electrolyte, and stripping potential scan rate.
3.2.1 pH effect
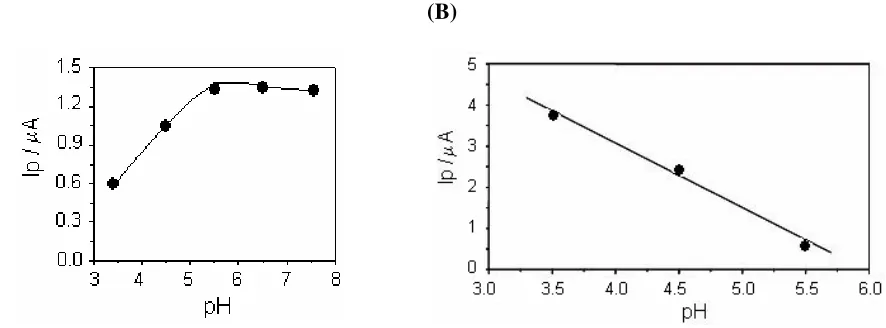
reduction. The pH effect can be expected from the mechanism expressed by reactions (1) through (9) because some of them are proton-involved. The proton involvement in the reduction and sweeping stage of Cu(II) to Cu(I) on a CME surface has been reported in the literature [15].
Figure 3 (A) clearly shows a monotonic increase in the peak current with increasing pH in the pH range of < 5.5, and a plateau after pH 7.5. At the reduction step (the electrode potential was controlled at –0.35 V (Ei)), the pH change can also affect the measurement sensitivity, as shown in
Figure 3 (B).
(A) (B)
Figure 3. pH Effect in both steps: preconcentration (A) and reduction (B). Data from voltammograms under the following conditions: (A) The preconcentration step at open circuit; (B) The reduction step in closed circuit. [Cu(II)] = 5x10-12 mol/L; pH (acetate buffer 0.02mol/L); tpre: 60s; tred: 60s; v = 100 mV/s; Ei: –0.35 V.
3.2.2 Pre-concentration time effect
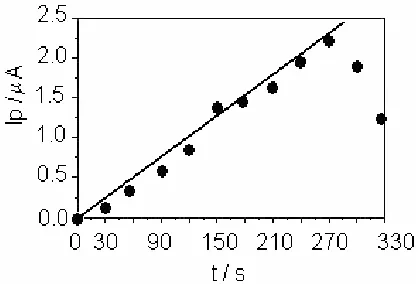
Pre-concentration time is one of the most important parameters in stripping voltammetry, which not only affects the detection sensitivity but also has an impact on the analysis duration. Figure 4 shows the effect of the preconcentration time on the peak current. Within the time range of 30-270 seconds, linearity can be observed. After 270 seconds, a plateau appears, suggesting that the ARS ligand sites on the electrode surface may be saturated by Cu(II) ions. In this work, a value of 180 seconds was chosen for the sample analysis, which is in the middle of the linear part of the curve.
3.3.3 Reduction potential effect
[image:7.612.96.539.205.369.2]Figure 4. Plot of the peak current versus different preconcentration times (s): 30, 120, 150, 180, 210, 240, 270, 300, and 330. Data from stripping voltammograms under the following conditions: [Cu(II)] = 5×10-12 mol/L, pH 5.5, and acetate buffer 0.06 mol/L at the preconcentration step; pH 3.5, and
acetate buffer 0.02 mol/L at the reduction and stripping steps; the reduction potential was -0.35 V; the stripping potential scan rate of 100mV/s; and the reduction time was 90 seconds.
3.2.4 Scan Rate
The potential scan rate for stripping was tested in the range between 25 and 125 mV/s, and the stripping peak current that was obtained showed a linear dependence on the scan rate (Figure not shown). This linear behavior may suggest that the peak current comes largely from surface adsorbed species [17]. In this work, a potential scan rate 100 mV/s was chosen and used in all the experiments. After the optimization, the following experimental parameters were applied in all subsequent measurements: 180 seconds of preconcentration at open circuit; 90 seconds of reduction at –0.35 V; and a solution pH of 3.5 with 0.02 mol/L acetate buffer at the reduction/stripping stage.
3.2.5 Calibration curves
A calibration curve (Ip versus [Cu(II)]) was obtained through the standard addition of
successive aliquots of Cu(II) ions into the electrochemical cell. Figure 5 (A) shows the voltammograms obtained at different Cu(II) concentrations. A linear relationship can be observed between the stripping peak current and a Cu(II) concentration in the range of 2.0 × 10⁻¹² to 1.0 × 10⁻¹¹
mol/L using a 180 s pre-concentration (Figure 5 (B)). If the Cu(II) concentration is higher than 1×10-11
mol/L , a deviation from linearity is observed. In the present work where the current is catalytic the linearity deviation may not due to the saturation of the analyte on the electrode surface. It is believe this saturation could be attributed to the limitation of the catalytic process on the electrode surface.
3.3 Application of the method
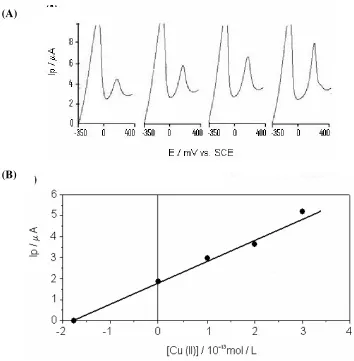
method was used to analyze the real water samples. Figure 6 shows an example for the process. A linear standard addition curve was obtained (Figure 6 (B)) from which the Cu(II) concentration could be determined at a 10-13 mol/L level, adjusted by the equation Ip ( A) = 1.81 (± 0.13) + 1.06 (± 0.08) × [Cu(II)] (mol/L), with r2 = 0.99 and n = 4. Practical samples showed a medium value of 1.7×10⁻¹³
mol/L with a recovery of 103%, a standard deviation (triplicate measurements) of 4.7%, and a confidence level of 95%.
These results indicate that the proposed analytical method is reliable for determining copper in water samples. The signal-to-noise ratio of these data (S/N = 3) corresponds to a detection limit of 5.8 x 10⁻¹⁴ mol/L (3.8 pg/L) under a pre-concentration time of 180 s and a reduction time of 90s. This result is comparable to those in literature. Liu et al. [18] reported a detection limit of 1.6 x 10⁻¹⁰ mol/L
Cu (II) using a carbon paste electrode modified with ARS-K2S2O8 through catalytic adsorptive
stripping voltammetry. Freire et al. [19] obtained a detection limit of 1.8×10⁻¹⁴ mol/L Cu2+ employing
a 3-mercaptopropionic acid SAM with 10 min of preconcentration.
The study presented in this paper demonstrated the formation of an adduct between hydrogen and the Cu(I)-ARS complex that is associated with the accumulation process seen with catalytic hydrogen reactions. The results reported here also demonstrate a simple method without prior treatment or addition of any reagent in the determination of cooper in an aqueous standard matrix.
Figure 6. (A) Stripping voltammograms at different concentrations of standard Cu(II) in ultra pure water (nanopure system). Conditions: pH 5.5 and acetate buffer 0.06 mol/L at the preconcentration step; pH 3.5 and acetate buffer 0.02 mol/L at the reduction and stripping steps; the reduction potential was –0.35V, and the reduction time was 90 seconds. The preconcentration time was 180 seconds; the stripping potential scan rate was 100mV/s. [Cu(II)]: (a) 0.0; (b) 1×10-13 mol/L; (c) 2×10-13 mol/L;
(d) 3×10-13 mol/L; (B): Data from (A). (A)
[image:10.612.117.471.256.617.2]4. CONCLUSIONS
An extremely high sensitivity for Cu(II) analysis at a level of 10-13 mol/L has been achieved in this study using ARS as a coordination ligand on the electrode surface to facilitate the Cu(II) preconcentration process. It is believed that this sensitivity may be amplified by a catalytic-adsorptive stripping mechanism. Furthermore, the preconcentration step in an open-circuit, coupled with pH and electrolyte concentrations had large scale effects on catalytic hydrogen production. The accumulation of produced H2 on the electrode/water interface amplifies the voltammetric hydrogen catalytic signal,
leading to a remarkably sensitive stripping voltammetric method for copper determination.
A catalytic-adsorptive stripping mechanism for sensitivity amplification was proposed based on our current understanding. Further work is definitely needed for confirmation, and work on this is continuing in our laboratory.
ACKNOWLEDGEMENT
This work has been financially supported by the CNPq/CT-Energ (Conselho Nacional de desenvolvimento Científico e Tecnológico) – ETACOMB Project (Proc. 505167/2004-2), a scholarship from FAPEMA (Fundação de Amparo Pesquisa do Estado do Maranhão).
References
1. 1. J. Wang, M. Z. Czae, J. Lu, M. Vuki, Microchem. J. 62(1999)121. 2. J. Wang, J. Zadeii, M. S. Lin, J. Electroanal. Chem. 237(1987)281. 3. M. Z. Czae, J. Wang, Talanta, 50(1999)921.
4. M. A. Cousino, T. B. Jarbawi, H. B. Halsall, W. R. Heineman, Anal. Chem. 69(1997) 544A. 5. C. M. G. van den Berg, Anal. Chim. Acta, 250(1991)265.
6. K. Hoppstock, M. Michulitz, Anal. Chim. Acta, 350(1997)135.
7. D. A. Phipps, “Metals and metabolism”, London, Oxford University Press, 1976.
8. T. Theophanides, J. Anastassopoulou, Crit. Rev. in Oncology/Hematology, 42(2002)57. 9. J. Wang, Electroanal. Chem. 16(1989)1.
10.C. M. G. van den Berg, Anal. Chim. Acta, 164(1984)195. 11.C. M. G. van den Berg, Mar. Chem. 5(1984)1.
12.L.M. Wier, A. R. Guadalupe, H. D. Abruna, Anal. Chem. 57(1985)2009. 13.D. M. T. O’Riordan, G. G. Wallace, Anal. Chem. 58(1986)128.
14.S. V. Prabhu, R. P. Baldwin, L. Kryger, Anal. Chem. 59(1987)1074.
15.V. E. M. Filho, A. L. B. Marques, J. J. Zhang, G. O. Chierice, Electroanalysis, 11(1999)1130. 16.S.G. Mairanovskii, J. Electroanal. Chem. 6(1963)77.
17.A. J. Bard, L. R. Faulkner, “Electrochemical methods – Fundamentals and Applications”, Wiley, New York, 1980.
18.N. Liu, J-F. Song, Anal. Bioanal. Chem. 383 (2005)358. 19.R. S. Freire, L. T. Kubota, Electrochim. Acta, 49(2004)3795.
20.E. R. Sousa, E. P. Marques, E. N. Fernandes, J. Zhang, A. L. B. Marques. J. Braz. Chem. Soc. 17(2006)177.
![Figure 2: Surface stripping voltammogram of Cu(II)-ARS on the graphite electrode. Conditions: [Cu(II)] = 5×10-12 mol/L; preconcentration in the nonelectrolyte for 180 seconds; prereduction for 90 seconds at –0.35 V (vs](https://thumb-us.123doks.com/thumbv2/123dok_us/1948945.155275/6.612.215.375.240.415/stripping-voltammogram-graphite-electrode-conditions-preconcentration-nonelectrolyte-prereduction.webp)