This is a repository copy of Temporal variations in the potential hydrological performance
of extensive green roof systems.
White Rose Research Online URL for this paper: http://eprints.whiterose.ac.uk/127701/
Version: Accepted Version
Article:
De-Ville, S., Menon, M. orcid.org/0000-0001-5665-7464 and Stovin, V.
orcid.org/0000-0001-9444-5251 (2018) Temporal variations in the potential hydrological performance of extensive green roof systems. Journal of Hydrology, 558. pp. 564-578. ISSN 0022-1694
https://doi.org/10.1016/j.jhydrol.2018.01.055
Reuse
This article is distributed under the terms of the Creative Commons Attribution-NonCommercial-NoDerivs (CC BY-NC-ND) licence. This licence only allows you to download this work and share it with others as long as you credit the authors, but you can’t change the article in any way or use it commercially. More
information and the full terms of the licence here: https://creativecommons.org/licenses/
Takedown
If you consider content in White Rose Research Online to be in breach of UK law, please notify us by
Temporal variations in the potential hydrological
performance of extensive green roof systems
Simon De-Villea,∗, Manoj Menonb, Virginia Stovinc
a
School of Architecture, Building & Civil Engineering, Loughborough University, Loughborough, LE11 3TU, UK
b
Department of Geography, University of Sheffield, Sheffield, S10 2TN, UK
c
Department of Civil & Structural Engineering, University of Sheffield, Sir Frederick Mappin Building, Mappin Street, Sheffield, S1 3JD, UK
Abstract
Existing literature provides contradictory information about variation in po-tential green roof hydrological performance over time. This study has eval-uated a long-term hydrological monitoring record from a series of extensive green roof test beds to identify long-term evolutions and sub-annual (sea-sonal) variations in potential hydrological performance. Monitoring of nine differently-configured extensive green roof test beds took place over a period of 6 years in Sheffield, UK.
Long-term evolutions and sub-annual trends in maximum potential re-tention performance were identified through physical monitoring of substrate field capacity over time. An independent evaluation of temporal variations in detention performance was undertaken through the fitting of reservoir-routing model parameters. Aggregation of the resulting retention and deten-tion variadeten-tions permitted the predicdeten-tion of extensive green roof hydrological
∗Corresponding author
performance in response to a 1-in-30-year 1-hour summer design storm for Sheffield, UK, which facilitated the comparison of multi and sub-annual hy-drological performance variations.
Sub-annual (seasonal) variation was found to be significantly greater than long-term evolution. Potential retention performance increased by up to 12% after 5-years, whilst the maximum sub-annual variation in potential reten-tion was 27%. For vegetated roof configurareten-tions, a 4% long-term improve-ment was observed for detention performance, compared to a maximum 63% sub-annual variation. Consistent long-term reductions in detention perfor-mance were observed in unvegetated roof configurations, with a non-standard expanded-clay substrate experiencing a 45% reduction in peak attenuation over 5-years. Conventional roof configurations exhibit stable long-term hy-drological performance, but are nonetheless subject to sub-annual variation.
Keywords: Green Roof, Seasonal, Annual, Retention, Detention,
Hydrological Performance
Highlights
1
• Temporal changes in potential performance evaluated over 6 years for
2
9 test beds
3
• Potential retention performance identified via monitored field capacity
4
• Detention performance explored via the fitting of simple hydrological
5
models
6
• Long-term performance evolutions are small in traditional green roof
7
configurations
• Sub-annual (seasonal) variations are dominant over long-term
evolu-9
tions
10
1. Introduction
11
1.1. Background 12
It has been widely demonstrated that extensive green roof systems offer
13
stormwater management capabilities through two hydrological processes, the
14
retention of rainfall (which subsequently is lost via evapotranspiration and
15
does not become runoff), and the detention of runoff (the transient storage of
16
rainfall as it passes through the roof layers). Stormwater managers typically
17
assume that a green roof’s physical characteristics — such as its hydraulic
18
conductivity (which influences detention) and field capacity (which influences
19
retention) — are constant over time, and therefore that the roof’s potential
20
to retain and detain runoff are also constant over time. However, these
prop-21
erties may change in response to seasonal factors (vegetation growth cycles,
22
substrate wetting/drying regimes) and/or due to longer-term processes such
23
as compaction (De-Ville et al., 2017). There is therefore a need to
deter-24
mine whether there is evidence of such seasonal or longer-term changes in
25
the underlying potential performance characteristics.
26
The most frequently reported indicator of green roof hydrological
per-27
formance is the percentage retention, reported as either a ‘mean per-event’
28
or ‘total volumetric’ retention. Many green roof monitoring programmes
29
have highlighted seasonal trends in observed retention performance,
partic-30
ularly in temperate climates of the northern hemisphere, where there are
31
distinct seasonal variations in temperature, rainfall patterns, and other
matic variables. Retention performance is consistently higher in the warmer
33
summer months of the year (Mentens et al., 2006; Uhl and Schiedt, 2008;
34
Po¨e et al., 2015; Elliott et al., 2016). This is widely attributed to the
in-35
creased levels of evapotranspiration, resulting in greater recovery of storage
36
capacities between rainfall events. Beyond temperate conditions, however,
37
Voyde et al. (2010) did not observe any seasonal trends in retention
perfor-38
mance for a 12-month study conducted in Auckland, New Zealand, owing to
39
the small seasonal meteorological differences in Auckland’s climate. In the
40
humid-subtropical climate of Hong Kong, Wong and Jim (2014) identified
41
the weakest retention performance in summer months (over a 12-month
pe-42
riod) due to increased levels of rainfall, which prevented sufficient recovery of
43
the green roofs storage capacity between events. Therefore, whilst seasonal
44
variations in observed retention performance are expected and observed in
45
temperate climates, the challenge is to identify whether these variations are
46
wholly due to climate or whether changes also occur in the underlying
physi-47
cal properties that affect the system’s fundamental retention characteristics.
48
Fewer studies have focused on the longer-term (year-on-year) performance
49
evolution of extensive green roof systems. Mentens et al. (2006) and Hill et al.
50
(2016) widely sampled existing green roof systems in Germany and Canada
51
respectively, with both finding no statistical correlation between roof age
52
and hydrological performance. However, no systematic year-on-year
com-53
parisons have been published. Whilst this partly reflects the scarcity of
54
long-term hydrological records, it should also be noted that the effect of
nat-55
ural climatic variation on observed hydrological performance is expected to
56
mask any subtle changes in the underlying hydrological characteristics of the
system (De-Ville et al., 2017). Observed retention performance is strongly
58
influenced by storm event characteristics and tends to be greatest for small
59
events, as green roofs only have a finite maximum retention capacity (e.g.
60
20 mm for an extensive system, Stovin et al. (2012)). It is not meaningful to
61
compare annual retention performance (either volumetric or mean per-event
62
retention), as rainfall patterns, temperatures, and other climate variables
63
differ significantly from year-to-year. For example, the same roof
configura-64
tion undergoing a high rainfall-low Antecedent Dry Weather Period (ADWP)
65
year/season/storm event will have a lower retention performance than if
ex-66
posed to a low rainfall-high ADWP year/season/storm event. However, the
67
green roof’s fundamental capacity for retention, as dictated by its physical
68
characteristics, may be the same in both scenarios.
69
Similarly, observations of temporal changes in detention performance are
70
typically confounded by the controlling effects of retention (Wong and Jim,
71
2014; Stovin et al., 2015b), and have therefore rarely been explored in
iso-72
lation. In summary, the literature clearly identifies patterns in sub-annual
73
hydrological performance, whilst findings on longer-term changes to either
74
retention or detention capabilities are inconclusive. No previous studies have
75
attempted to disaggregate storm event or climate-related forcing factors from
76
potential seasonal or longer-term changes to the roof’s underlying
hydrolog-77
ical response.
78
1.2. Objectives 79
This study aims to test the null hypothesis that neither sub-annual nor
80
long-term temporal variations exist in the potential hydrological performance
81
of green roof systems that have been monitored in Sheffield, UK. This is to be
achieved through: 1) the identification of approaches that permit temporal
83
variations in the physical properties that control retention and detention
84
to be quantified; 2) the exploration of a long-term hydrological record of
85
a series of extensive green roof test beds to identify temporal variations in
86
both potential retention (5-year record) and detention performance (6-year
87
record); and 3) an evaluation of the consequences of any predicted changes
88
through the prediction of hydrological performance in response to design
89
storms.
90
2. Literature Review
91
2.1. Physical controls on potential hydrological performance 92
A green roof’s maximum retention capacity is widely attributed to be
93
approximately equal to the substrate’s Plant Available Water (PAW, mm),
94
which is itself a function of the substrate’s Field Capacity (ΘF C, %v/v), 95
Permanent Wilting Point (ΘP W P, %v/v), and depth (d, mm): 96
P AW = (ΘF C −ΘP W P)·d (1)
It is proposed that tracking of these physical properties over time should
97
provide a climatically independent temporal evaluation of the Absolute
Re-98
tention Capacity (ARC) of the green roof system (equivalent to the
maxi-99
mum potential soil moisture deficit). These independent ARC evaluations
100
may be combined with the observed effects of rainfall, ADWP, and PET in
101
appropriate hydrological models to identify the Potential Retention Capacity
102
(PRC) and Potential Retention Performance (PRP) of the green roof system
103
in response to a specific climate/weather/storm event scenario. Section 3.3
outlines a novel approach to tracking field capacity using in-situ moisture
105
content sensors.
106
As with retention, the system’s detention characteristics may also be
mon-107
itored through the identification of relevant physical properties. Detention
108
processes may be modelled via the application of appropriate unsaturated
109
media flow relationships. However, the governing equations for predicting
110
unsaturated-media flow are complex, require numerous physical
character-111
istics (Palla et al., 2012), and there is therefore scope for large compound
112
errors. Alternatively, semi-empirical descriptions of the fundamental
deten-113
tion characteristics can be achieved with simple hydrological models, whilst
114
maintaining suitable levels of predictive accuracy. Stovin et al. (2015a)
pro-115
posed the use of a reservoir routing model to describe detention processes,
116
and this approach was successfully deployed to identify differences in
de-117
tention characteristics between various roof configurations independently of
118
climate.
119
In summary, conventional retention and detention performance metrics
120
derived from monitored data are poorly suited to the identification of
tempo-121
ral trends in underlying hydrological function. It is therefore proposed that a
122
coupled physical property monitoring programme and validated hydrological
123
modelling approach will better identify changes to the underlying green roof
124
physical characteristics and their impacts on potential hydrological
perfor-125
mance over time.
126
2.2. Temporal trends in green roof physical characteristics 127
Whilst yearly evaluations of hydrological performance may not exist in the
128
literature, there have been some attempts to characterise temporal changes in
green roof physical properties. Exploration of properties thought to directly
130
influence hydrological performance has identified potential for improved
hy-131
drological performance in the long-term. Getter et al. (2007) found that
132
pore volume doubled over a 5-year period, and hypothesised that this would
133
lead to improvements in retention performance due to an increase in
micro-134
porosity (≤ 50 µm). However, Getter et al. (2007) also noted that these
135
improvements may come at the expense of worsened detention performance
136
due to an increased presence of macropore (> 50 µm) channels. De-Ville
137
et al. (2017) explored the physical properties of virgin and aged (5-years)
138
green roof substrate, where observed structural differences were inferred to
139
lead to improved retention performance with age. Inconclusive results
pre-140
vented the identification of any trends in detention performance, but it was
141
highlighted that — due to the controlling nature of retention performance —
142
overall hydrological performance is likely to remain consistent, if not improve,
143
with increasing system age.
144
In a study of green roof establishment, Emilsson and Rolf (2005) observed
145
a net loss of organic matter (unspecified origin) from 3 to 1% of the total
146
substrate volume over a single year. Bouzouidja et al. (2016) identified similar
147
falls in organic content (1:1 peat dust and pine bark) over a 4 year-period
148
and reported a reduction in the mass of particles smaller than 2 mm in
149
diameter. The impact that organic matter fluctuations can have on green
150
roof hydrological performance is demonstrated by the laboratory experiments
151
of Yio et al. (2013), where a threefold increase in organic content (coir) was
152
associated with a peak attenuation (detention performance) increase from 15
153
to >50%.
The changes in physical characteristics noted above will influence the
155
substrate’s field capacity and/or its detention response. The present study
156
focuses on the use of long-term hydrological monitoring data from green roof
157
test beds to identify sub-annual (seasonal) and longer-term changes in these
158
underlying system characteristics.
159
3. Methodology
160
3.1. Introduction to the Hadfield Test Beds 161
The Hadfield Test Beds comprise 9 differently-configured green roof test
162
beds located at the University of Sheffield’s Green Roof Centre on a
third-163
floor terrace of the Sir Robert Hadfield Building (Grid Reference 53.3816,
164
-1.4773). Each test bed (TB) configuration has a different substrate
compo-165
sition and vegetation treatment pairing (Figure 1). The test beds are 1 m
166
wide by 3 m long and are installed at a 1.5◦ slope. Each test bed physically 167
comprises, from base to surface, a hard plastic tray, a drainage layer (ZinCo
168
Floradrain FD 25-E), a filter sheet (ZinCo Systemfilter SF), one of three
169
substrates to a depth of 80 mm, and one of three vegetation treatments.
170
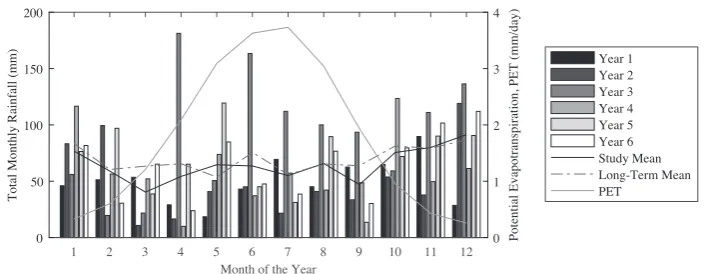
[Approximate location of Figure 1]
171
The first two substrates are commercially available substrates
manufac-172
tured by Alumasc ZinCo, Heather with Lavender (HLS) and Sedum Carpet
173
Substrate (SCS). HLS is installed in TB1, TB4 and TB7, with SCS being
in-174
stalled in TB2, TB5 and TB8. The third substrate is a bespoke mix based on
175
Lightweight Expanded Clay Aggregate (LECA) and is installed in TB3, TB6
176
and TB9. HLS is a semi-intensive commercial substrate consisting of crushed
177
brick and pumice (ZincolitPlus), enriched with organic matter including
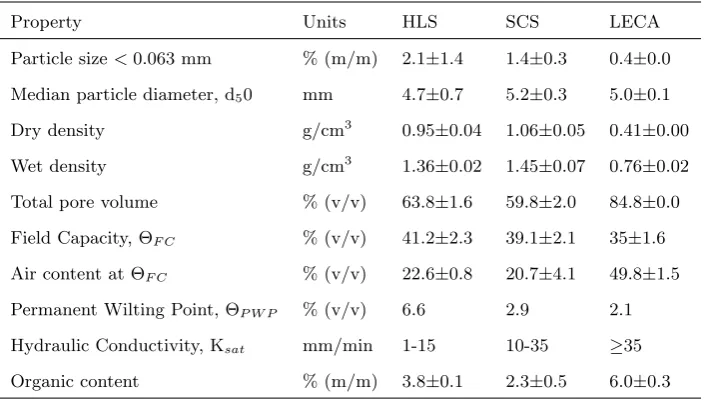
Property Units HLS SCS LECA
Particle size<0.063 mm % (m/m) 2.1±1.4 1.4±0.3 0.4±0.0 Median particle diameter, d50 mm 4.7±0.7 5.2±0.3 5.0±0.1
Dry density g/cm3
0.95±0.04 1.06±0.05 0.41±0.00
Wet density g/cm3
1.36±0.02 1.45±0.07 0.76±0.02
Total pore volume % (v/v) 63.8±1.6 59.8±2.0 84.8±0.0
Field Capacity, ΘF C % (v/v) 41.2±2.3 39.1±2.1 35±1.6
Air content at ΘF C % (v/v) 22.6±0.8 20.7±4.1 49.8±1.5
Permanent Wilting Point, ΘP W P % (v/v) 6.6 2.9 2.1
Hydraulic Conductivity, Ksat mm/min 1-15 10-35 ≥35
[image:11.595.130.483.125.325.2]Organic content % (m/m) 3.8±0.1 2.3±0.5 6.0±0.3
Table 1: Substrate physical characteristics as derived according to FLL (2008) test
meth-ods, Mean ±Standard deviation (Stovin et al., 2015b).
post with fibre and clay materials (Zincohum). SCS is a typical extensive
179
green roof substrate consisting of crushed bricks (ZincoLit), enriched with
180
Zincohum. The LECA-based substrate contains LECA as the sole mineral
181
component, with loam and compost. The physical characteristics of these
182
substrates are presented in Table 1.
183
The three vegetation treatments comprise two planted test groups and a
184
single un-vegetated group. TB1, TB2 and TB3 were vegetated with Alumasc
185
Blackdown Sedum Mat, TB4, TB5 and TB6 were vegetated with a Meadow
186
Flower mix, whilst TB7, TB8 and TB9 were unvegetated. The sedum
veg-187
etation was chosen as it is a commonly adopted species for extensive green
188
roof applications due to its tolerance of drought, extreme temperatures and
189
high wind speeds (VanWoert et al., 2005). The Meadow Flower treatment
190
comprises a mix of flowers, grasses and succulents. These species exhibit
a lower drought tolerance (Lu et al., 2014) but greatly increase the
biodi-192
versity potential compared to Sedum (Benvenuti, 2014). The unvegetated
193
test bed configurations were created to provide a control against which the
194
contribution of vegetation could be evaluated.
195
Data collected from the Hadfield Test Beds has been previously reported
196
by Berretta et al. (2014) and Stovin et al. (2015a), where the influence of
197
vegetation and substrate characteristics on moisture content behaviour and
198
overall hydrological performance were explored respectively. The findings of
199
Stovin et al. (2015a) are particularly relevant to this study, although only
200
aggregated hydrological performance statistics over their entire 4-year study
201
period were presented.
202
3.2. Monitoring Study Data Collection 203
The experimental setup included a Campbell Scientific weather station
204
that recorded hourly wind speed, temperature, solar radiation, relative
hu-205
midity and barometric pressure. Rainfall depth was measured at one minute
206
intervals using three 0.2 mm resolution ARG-100 tipping bucket rain gauges
207
manufactured by Environmental Measures Ltd. The rain gauges were
lo-208
cated at the same height as the test beds, between TB1 and TB2, TB5 and
209
TB6, and beside TB9 (Figure 1). Runoff was measured volumetrically in 25 l
210
collection tanks equipped with Druck Inc. PDCR 1830 pressure transducers.
211
The collection tank located under each test bed was designed for increased
212
measurement sensitivity at the beginning of each rainfall event and to avoid
213
direct discharge onto the sensor. The pressure transducers were calibrated
214
against collected volumes on site. An electronic solenoid valve emptied the
215
tank when maximum capacity was reached (8.3 mm runoff depth) and
ery day at 14:00. Runoff was recorded at one minute intervals. Data were
217
recorded using a Campbell Scientific CR3000 data logger.
218
Water content reflectometers were located at three soil depths to measure
219
the soil moisture profile and behaviour in four of the nine test beds (TB1,
220
TB2, TB3 and TB7). The sensors used were Campbell Scientific CS616
221
Water Content Reflectometers. The probes were installed horizontally at
222
the centre of each test bed and the rods were located at 20 mm (bottom),
223
40 mm (mid) and 60 mm (top) above the drainage layer and filter sheet.
224
Considering the proximity of the probes in each test bed, the rods of the mid
225
and top probes were installed at 90◦ and 180◦ respectively from the lower 226
one, in order to avoid distortion of the measurement reading taken by the
227
enabled probe. The orientation of each probe was pre-determined to ensure
228
that the wires did not interfere with the accuracy of the measurements from
229
nearby probes. Furthermore, to avoid inter-probe interference, the probes
230
were differentially-enabled, with each of the four sub-scans measuring three
231
probes in different test beds. Moisture content measurements were recorded
232
at 5 min intervals. Moisture probes were calibrated in the laboratory before
233
being installed into the test beds (as described in Berretta et al. (2014)).
234
The Hadfield test beds have been in place since late June 2009. After
235
a commissioning period, rainfall and runoff data collection began in
Febru-236
ary 2010. Climate data were collected from June 2010 and moisture data
237
from January 2011. This study uses data collected from all sources between
238
February 2010 and February 2016. Throughout the monitoring period the
239
runoff collection system experienced some failures. The failures were caused
240
by clogging of the automatic barrel-emptying valves with fine particulate
material washed out from the test beds. Even with regular maintenance
242
the collected rainfall/runoff dataset is not complete; this prevents the
re-243
porting of annual volumetric retention metrics and requires the adoption of
244
‘per-event’ analysis. The 6-year data record is made up of 503 individual
245
rainfall events where total precipitation exceeded 2 mm and the inter-event
246
period exceeded 6-hours. An inter-event period of 6-hours was chosen to
al-247
low comparability with previous studies (Stovin et al., 2012), whilst a 2 mm
248
minimum rainfall depth is considered to be the amount of rainfall typically
249
retained by a non-green roof (Voyde et al., 2010).
250
3.3. Identifying & Modelling Potential Retention Performance 251
3.3.1. Identifying temporal changes in field capacity 252
The ageing study utilised all three data types collected from the Hadfield
253
beds: climate; rainfall/runoff; and moisture content. Each rainfall event
254
where rainfall (P) and runoff (R) were greater than 2 mm was identified
255
from the 6-year data record (between 98 and 198 events depending on the
256
test bed).
257
As previously outlined, the identification of any year-on-year trends in
258
retention performance using monitored rainfall and runoff data is of limited
259
value due to the dominant effects of climatic factors. Therefore, a
physi-260
cal property monitoring approach was adopted to assess how the potential 261
maximum retention depth of the green roof varied over time. The moisture
262
content (Θ) of the substrate was monitored continuously using the moisture
263
content probes installed into TB1, TB2, TB3 and TB7. Theoretically, runoff
264
only occurs from a green roof once the substrate has reached field capacity
265
be at/around ΘF C. Due to the highly permeable nature of green roof sub-267
strates, any significant saturation above ΘF C is unexpected. The substrate’s 268
field capacity was therefore defined as the moisture content of the substrate
269
2 hours after the cessation of rainfall. Only events that generated >2 mm
270
runoff were considered.
271
The observed field capacity values were analysed over two temporal scales,
272
by study-year, and continuously over a Julian year. Categorical evaluations
273
were undertaken statistically using the non-parametric Kruskall-Wallis Test
274
method for identifying significant differences in distribution and to explore
275
the presence of trends over time.
276
Continuous evaluations were undertaken by fitting a Fourier series model
277
to the data to identify sub-annual trends in ΘF C. The Fourier series model 278
takes the form:
279
ΘF C =a+b·cos(D·p) +c·sin(D·p) (2)
wherea,b, andcare optimised parameters, pwas set equal to 2π/365 , ΘF C 280
is the monitored field capacity and D is day of the year (where January 1st 281
is 1 and December 31st
is 365, 366 in a leap year). Model fit was evaluated
282
with the R2 goodness of fit statistic and a bisquare weighting of residuals. 283
3.3.2. Modelling potential retention performance 284
The identified values of ΘF C allow for temporal evaluations of the maxi-285
mum retention capacities of the green roof systems. Retention performance,
286
as previously established, depends upon ΘF C, but is also a function of rainfall 287
patterns, ADWP, and PET values. These additional factors can be
incor-288
porated as part of a conceptual hydrological flux model to better identify
potential retention performance, whereby:
290
Smax =P AW = (ΘF C −ΘP W P)·d (3)
Smax is the maximum storage capacity of the substrate in mm, taken here to
291
be equal to PAW and determined from the difference in ΘF C and the Per-292
manent Wilting Point (ΘP W P, Table 1) multiplied by the substrate depth 293
(d) in mm, 80 mm in this study. Smax is used to define the storage through
294
time (St). The stored water depth at time t (St, mm) is calculated as the
295
stored water depth from the previous time step (St−1, mm) minus the ex-296
pected evapotranspiration (ET, mm). Expected ET is estimated by scaling
297
Potential ET (P ETt, mm) with a moisture limited Soil Moisture
Extrac-298
tion Function (SMEF) based upon an effective substrate saturation between
299
ΘP W P and ΘF C (Stovin et al., 2013). PET is calculated using the Hargreaves 300
method and long-term climate averages for Sheffield, UK (Figure 2).
301
St =St−1−(P ETt· St−1
Smax) (4)
The Potential Retention Capacity at time t (P RCt, mm) is defined as the 302
cumulative losses from the inital storage level, in this study set as Smax.
303
P RCt=Smax−St (5)
The Potential Retention Performance (P RP, %) in response to a
1-in-30-304
year 1-hour Summer design storm event for Sheffield, UK, was determined
305
via:
306
P RP = P RC
P ·100 (6)
where P is total rainfall depth (in this case 30 mm). An Antecedent Dry
307
Weather Period (ADWP) from 0 to 28-days in duration was investigated to
308
explore PRP under varying climatic conditions.
3.4. Identifying & Modelling Detention Performance 310
The same monitored rainfall events used for retention performance
evalua-311
tion were also utilised for identifying detention characteristics. As highlighted
312
above, conventional detention metrics derived from monitored field data (e.g.
313
Peak Delay, Peak Attenuation) are often confounded by the controlling
ef-314
fects of retention. Stovin et al. (2015b) proposed the use of a fitted reservoir
315
routing model to act as a descriptor of the physical detention processes
oc-316
curring within an extensive green roof system. This approach provides a
317
descriptor of detention that is independent of retention and climatic effects.
318
Kasmin et al. (2010) suggested that the detention performance of a green
319
roof test bed could be modelled using reservoir routing concepts, whereby:
320
ht=ht−1+Qint−Qoutt (7)
in which Qinand Qoutrepresent the flow rates into and out of the substrate
321
layer respectively (mm/min), h represents the depth of water temporarily
322
stored within the substrate (mm), and t represents the discretisation time
323
step. Qout is given by:
324
Qoutt =DS·hDE
t−1 (8)
in which DS and DE are the reservoir routing parameters (scale and
expo-325
nent respectively). For h in mm and Qout in mm/min, DS has the units
326
mm(1−DE)/min, whilst DE is dimensionless. Note: in previous literature, the 327
scale and exponent of the reservoir routing equation were referred to as k 328
and n respectively; they have been altered in this study to avoid confusion
329
with other physical properties and model parameters.
330
Yio et al. (2013) demonstrated that a model based on a fixed value of
331
DE was capable of predicting observed runoff profiles with almost no loss of
accuracy when compared with a model for which both parameters had been
333
optimised. With a fixed value of DE = 2, values of DS were optimised for 334
each identified rainfall event by fitting the predicted runoff, in response to
335
net rainfall profiles, to monitored runoff profiles. Model fit was evaluated
336
using the R2
t goodness of fit statistic. 337
As with retention, the resultantDS values were analysed at two temporal 338
scales, categorically by study-year, and continuously over a Julian year.
Cat-339
egorical evaluations were undertaken statistically using the non-parametric
340
Kruskall-Wallis Test for identifying significant differences in distribution and
341
to explore the presence of trends over time. Continuous evaluations were
un-342
dertaken by fitting a Fourier series model to the data to identify sub-annual
343
trends in DS. 344
3.5. Predicting Overall Hydrological Performance 345
Identified retention and detention physical characteristics were combined
346
to predict the runoff of the green roof systems in response to a
1-in-30-347
year 1-hour Summer design storm event — as per the CIRIA SuDS Manual
348
(Woods Ballard et al., 2015) — for Sheffield, UK, to assess the impact of
349
the identified sub-annual and long-term parameter variations. A net-rainfall
350
profile was generated by subtracting total retention losses (PRC) from the
351
beginning of the rainfall event, and this was then routed using the detention
352
model outlined in Section 3.4 combined with appropriate model parameters.
353
A range of ADWP durations, from 0 to 28-days, was investigated to explore
354
any influence on runoff response.
4. Results
356
4.1. Study Period Climate 357
The monthly rainfall depths (Figure 2) highlight the typically high levels
358
of variability associated with a temperate climate. Figure 2 also aids in
359
understanding the difficulty of observing similar rainfall characteristics over
360
time; with the exception of June, almost all other months receive vastly
361
different levels of rainfall from year to year. Cumulative rainfall for the 503
362
identified rainfall events totalled 4224 mm, out of a total recorded 4670 mm,
363
representing 90.5% of all rainfall. Characterisation of storm return periods
364
indicated that the vast majority of storms could be classified as having a
365
return period of less than 2 years (for their respective durations). Only 4 of
366
the 503 events were classified as having a return period in excess of 2 years,
367
as defined by the Flood Estimation Handbook (CEH and NERC, 2008).
368
[Approximate location of Figure 2]
369
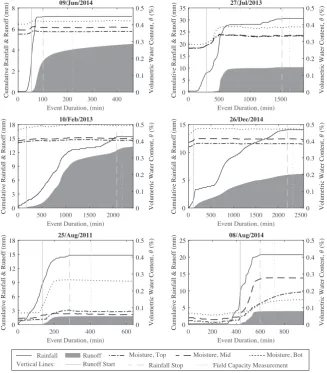
4.2. Moisture Content 370
Figure 3 presents rainfall, runoff and moisture content data for TB1 for
371
six contrasting rainfall events. The events have been selected to illustrate
372
typical responses in summer and winter conditions. The first four events,
373
09/Jun/14, 27/Jul/13, 10/Feb/13 and 26/Dec/14, all relate to conditions
374
where the substrate was either at, or near to, field capacity at the onset of
375
rainfall. Whilst there is some evidence of temporarily raised moisture content
376
levels around the time of the onset of runoff, the important point is that the
377
moisture content is relatively stable and constant following the initiation
378
of runoff. The plots confirm that the moisture content levels recorded 120
minutes after the end of an event provide a good estimate of the effective field
380
capacity during the event. The summer events (upper row) show consistently
381
lower effective field capacity values compared with the winter events (middle
382
row).
383
The final two plots illustrate cases where the moisture content prior to
384
the rainfall event was low, close to the permanent wilting point. Whilst these
385
also demonstrate increasing moisture content in response to the rainfall, the
386
patterns are less consistent. For example, there is a far greater difference
387
between moisture content at different depths in the 25/Aug/11 event
com-388
pared with the first four events, and the top probe appears to be registering
389
rising moisture levels after the event ceased on 08/Aug/14. In both of these
390
cases runoff was measured at very low levels of moisture content. These plots
391
suggest that under conditions of extreme dryness the wetting process is
un-392
even and preferential flow paths may lead to runoff before all the substrate
393
has been wetted to field capacity. There is clearly scope for more detailed
394
research on this topic. However, for the purposes of the present study, this
395
dry condition data has been omitted from calculations of seasonal variations
396
in maximum moisture holding capacity. A systematic approach was adopted
397
for the removal of outliers, in which all monitored field capacities lying below
398
1.5 x the interquartile range of a specific test bed’s observed field capacity
399
range were excluded. In practice, this resulted in lower cut-off ΘF C values of 400
28.2, 29.2, 12.9, and 24.9% for TB1, TB2, TB3 and TB7 respectively. For
401
the three brick based substrates there were considerably fewer outlier events
402
than for the LECA test bed: 2 events was omitted from TB1; 4 events from
403
TB2; 7with depth of from TB3; and 3 from TB7. There was some
ality between rainfall event exclusion between test beds. This small number
405
of excluded events represents only 1-6% of the monitored data, dependent
406
on test bed configuration.
407
[Approximate location of Figure 3]
408
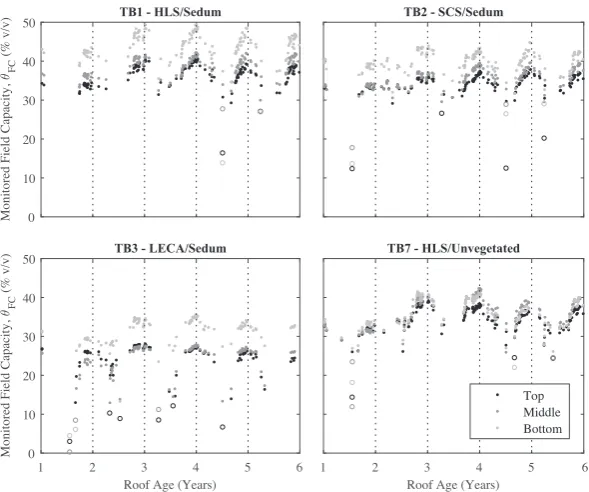
4.3. Retention performance 409
Figure 4 presents the monitored post runoff event field capacity of TB1,
410
TB2, TB3, and TB7 over the study period. Moisture probe data was not
411
available for the first year of the study, and so a 5-year period is used for
412
the evaluation of any trends in ΘF C over time. The bottom of the substrate 413
consistently exhibits a higher moisture content than either the middle or
414
top. The presence of a vertical moisture profile is exaggerated in the
vege-415
tated test beds (TB1-3) compared with the unvegetated TB7. This suggests
416
that plant and root activity contribute to the development of the vertical
pro-417
file. Comparisons between TB1 (Sedum vegetation) and TB7 (Unvegetated),
418
which share the same substrate, reveal that moisture levels are consistently
419
elevated in TB1 over TB7. Berretta et al. (2014) suggested that this
phe-420
nomenon was due to the moisture retention effects of plants and roots, a
421
result of greater entrained organic content. However, Figure 4 also reveals
422
the presence of a sub-annual cycle in which monitored field capacities were
423
highest in the winter months — vertical dotted lines indicate 1st
January
424
of each study year — and lowest in the summer. If differences were solely
425
due to vegetative processes, sub-annual trends would be unexpected in the
426
unvegetated TB7.
427
[Approximate location of Figure 4]
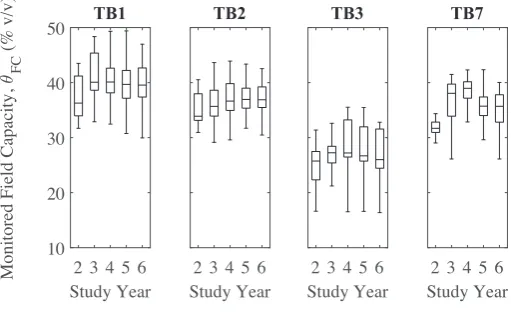
4.3.1. Long-term performance evolutions 429
Categorising the monitored field capacity values by study year (Figure 5)
430
clearly reveals significant differences (Kruskal-Wallis, p≤0.05) in the
distri-431
butions of monitored field capacity over time for the full depth of TB1 and
432
TB7; TB2 and TB3 show less variation over time. There is spread on all of
433
the distributions, some of which is due to systematic sub-annual variations
434
which will be discussed later. Supplementary Dunn’s pairwise comparisons
435
revealed a significant difference between Year-2 monitored field capacity
val-436
ues and all other years. From Year-3 onward there is no significant statistical
437
difference in the value of monitored field capacity for any test bed.
438
[Approximate location of Figure 5]
439
4.3.2. Sub-annual performance variations 440
The compiled annual monitored field capacity values of the four test beds
441
fitted with moisture content probes are presented in Figure 6. Whilst scatter
442
in the data is evident, as for Figure 4, there is a visible sinusoidal trend in
443
ΘF C over the year. Fourier series models describe this relationship with an 444
acceptable degree of model fit (R2 ≥ 0.7). As previously identified, there is 445
considerably less variation in the moisture levels with depth in the
unvege-446
tated TB7 compared to the same, but vegetated, substrate of TB1. All test
447
beds, and all layers, exhibited a minimum ΘF C in July or August, and a 448
maximum around February. Taking the worst-case (i.e. lowest) value of ΘF C 449
from the top layer of each test bed and applying a substrate-specific constant
450
PWP value (Table 1) suggests that the PAW of brick-based substrate
config-451
urations fluctuates by approximately 5 mm within a year. The LECA-based
452
substrate exhibited a much greater variation of 9.6 mm or 62% (about the
mean), which is more than 40 times the long-term change.
454
[Approximate location of Figure 6]
455
Figure 7 presents the potential retention capacities of each of the four
456
test bed configurations for varying levels of ADWP. The PRC on any day of
457
the year and for an ADWP of up to 28-days can be identified from each plot.
458
PRC is always greatest for the highest ADWP (28-days) as the regeneration
459
of storage capacity by ET is cumulative. Without a variable PAW and at
460
an infinite ADWP the PRC curves shown in Figure 7 would follow a similar
461
relationship to the PET curve of Figure 2, with lower levels of PRC in the
462
winter months and higher levels in the summer months. The effect of a
463
reduced PAW in the summer months is a corresponding reduction in the level
464
of PRC(compared to a theoretical maximum); this reduction is most evident
465
at high levels of ADWP. The greatest levels of PRC for all configurations
466
at the highest ADWPs (≥21-days) can be observed to occur in late spring
467
(May). For low levels of ADWP (≤7-days) in the brick-based substrate
468
configurations (TB1, TB3, & TB7), PRP follows a relationship more similar
469
to that of PET, maintaining the highest levels of PRC in summer months.
470
[Approximate location of Figure 7]
471
The reduced levels of PAW in the LECA-based substrate of TB3
com-472
pared to its brick-based counterparts result in lower overall estimates of PRP.
473
When the greater sub-annual variation in PAW of the LECA-based substrates
474
is also considered, PRP is heavily reduced in the summer months for any
475
ADWP ≥ 3-days and does not exhibit the same plateau in performance as
476
the brick-based substrates.
4.3.3. Summary 478
By monitoring ΘF C over a period of five years, it was found that sub-479
annual variations in maximum potential retention are more significant than
480
those identified year-on-year. From Year-1 to Year-5, the greatest change in
481
ΘF C was 12.6% in the unvegetated HLS test bed (TB7), whilst the greatest 482
sub-annual (seasonal) variation (62%) was observed in the sedum vegetated
483
LECA test bed (TB3). Sub-annual variations were found to be up to 40
484
times greater than long-term evolutions (TB3).
485
4.4. Detention performance 486
Figure 8 presents a scatter plot of the fitted detention model parameter
487
DS over time and highlights considerable variation in the data. Sub-annual
488
trends are less apparent than those seen for the retention analysis. Note:
489
higher values of DS indicate more rapid runoff and so represent reduced
490
detention performance.
491
4.4.1. Long-term performance evolutions 492
The grouping of DS values by study year reveals the long-term trends
493
in median DS over time (Figure 9). Vegetated test beds (TB1-6) exhibit 494
little or no change in detention performance (as inferred from DS values)
495
over the six-year study period when compared to unvegetated systems. The
496
vegetated systems also exhibit reduced interquartile ranges compared to the
497
corresponding unvegetated systems. The unvegetated test beds (TB7-9)
ex-498
perience large variations in the yearly-median value ofDS, with TB9 showing
499
a steady year-on-year increase (+151% Year-1 to Year-6). The unvegetated
500
beds have a statistically significant difference inDSbetween 1 and
6. For all three vegetation treatments, LECA test beds generally exhibit the
502
greatest range ofDS values for each year compared to their brick-based coun-503
terparts.
504
[Approximate location of Figure 8]
505
[Approximate location of Figure 9]
506
4.4.2. Sub-annual performance variations 507
Figure 10 reveals that there is a sub-annual pattern to detention
perfor-508
mance. The scatter plot highlights significant variation in DS over the year,
509
making trends more difficult to identify visibly compared with retention. The
510
monthly median values of DS and the applied Fourier series models reveal
511
the presence of an inverted sub-annual relationship compared with ΘF C, with 512
elevatedDSvalues (i.e. reduced detention) in summer months. However,
par-513
ticularly for TB1, there is a lack of data during the summer months. This
514
low number of data points is unsurprising as retention performance has been
515
demonstrated to be higher in summer months, preventing the generation of
516
sufficient runoff volumes for detention analysis (R≥2 mm).
517
The installed vegetation of each configuration plays a significant role in
518
dictating the median annual DS value (Table 2), with the unvegetated test
519
beds (TB7-9) exhibiting higher annual median values of DS compared to 520
vegetated configurations. However, for the vegetated test beds the vegetation
521
type (Sedum or Meadow-Flower) does not lead to any clear differences in
522
sub-annual variability.
523
[Approximate location of Figure 10]
524
Application of the Fourier series model values ofDSfor adetention perfor-525
mance only (0-day ADWP) runoff response highlights that the greater values
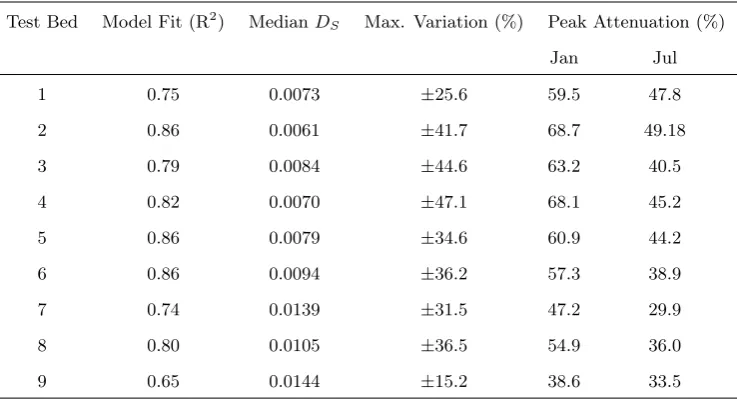
Test Bed Model Fit (R2
) MedianDS Max. Variation (%) Peak Attenuation (%)
Jan Jul
1 0.75 0.0073 ±25.6 59.5 47.8
2 0.86 0.0061 ±41.7 68.7 49.18
3 0.79 0.0084 ±44.6 63.2 40.5
4 0.82 0.0070 ±47.1 68.1 45.2
5 0.86 0.0079 ±34.6 60.9 44.2
6 0.86 0.0094 ±36.2 57.3 38.9
7 0.74 0.0139 ±31.5 47.2 29.9
8 0.80 0.0105 ±36.5 54.9 36.0
[image:26.595.122.491.125.325.2]9 0.65 0.0144 ±15.2 38.6 33.5
Table 2: Summary of detention Fourier series model fit, annual median DS values, the
maximum variation from this median value, and peak attenuation values for a 1-in-30-year
design storm with 0-days ADWP.
ofDSin summer months lead to a reduced peak attenuation (reduced perfor-527
mance, see the last two columns of Table 2). The vegetated brick-based test
528
beds (TB1 & TB2) exhibit the smallest levels of peak attenuation variation
529
over the course of the year, whilst the unvegetated brick based
configura-530
tion (TB7) and the vegetated LECA configuration (TB3) both experience
531
significantly greater sub-annual variation in peak attenuation. The greater
532
magnitude of variation in TB3 for detention is also present for retention,
533
suggesting that the LECA-based substrate is more susceptible to sub-annual
534
variations in performance than its brick-based counterparts.
4.4.3. Summary 536
The fitting of the DS parameter to observed net rainfall/runoff profiles
537
permits the temporal monitoring of detention processes independently of
cli-538
mate and retention effects. For an unvegetated system, long-term evolutions
539
in detention performance (as inferred from DS values) are significant, with 540
up to 10 times greater increases than those observed sub-annually (e.g. 151%
541
vs. 15% respectively for TB9). However, vegetated configurations generally
542
exhibit greater sub-annual (seasonal) variation compared with long-term
evo-543
lutions (e.g. 42% vs. 12% respectively for TB2). This, in conjunction with
544
the retention findings, suggests that sub-annual variations are more critical
545
than long-term evolutions.
546
4.5. Overall hydrological performance 547
4.5.1. Long-term performance evolutions 548
Figure 11 demonstrates the differences in overall performance for two test
549
beds installed with the HLS brick-based substrate (TB1 and TB7) alongside
550
a single test bed with a LECA-based substrate (TB9). The model
predic-551
tions incorporate Year-1 to Year-6 changes in the detention model parameter
552
DS and also apply the relevant monitored field capacity. For TB1, the small
553
increase in ΘF C and small decrease in DS result in no clearly observable 554
difference in runoff profile from Year-1 to Year-6 at any ADWP, with peak
555
attenuation decreasing by just 4.2% for a 0-day ADWP. The result of a
556
greater change in ΘF C for TB7 is masked by the considerable difference in 557
Year-1 to Year-6 DS value, which results in a visually distinct 0-day ADWP
558
runoff response from Year-1 to Year-6, with peak attenuation reducing by
559
value from Year-1 to Year-6 and this results in a 45.2% reduction in peak
561
attenuation. The predicted runoff responses of all 3 test beds confirm the
562
stabilising effect that vegetation can have on long-term hydrological
perfor-563
mance, as previously seen in Figures 5 and 9.
564
[Approximate location of Figure 11]
565
4.5.2. Sub-annual performance variations 566
The predicted runoff responses shown in Figure 12 represent the
mini-567
mum and maximum detention performances of TB1, TB2, TB3 and TB7,
568
and their associated maximum retention potential at these times. All
in-569
stances of minimum detention performance are during the warmer summer
570
months, whilst the maximum detention performance is seen in the winter
571
months. The differences in DS are significant and evident in the differences
572
between minimum and maximum DS 0-day ADWP responses; peak attenu-573
ation improved by 63.1% for TB3 between August and February.
574
The best runoff responses are always achieved at the 28-day ADWP
dura-575
tion due to the additional retention performance, with a maximum peak
at-576
tenuation of 90.4% for TB1 in July. Under minimum detention performance
577
conditions (summer months) there is considerably more variation between
578
the 0-day and 28-day ADWP responses (56.1%, TB1) than under maximum
579
detention performance (winter months, 15.2%, TB1). This is due to the
ele-580
vated levels of PET in the summer months which permit the faster recovery
581
of retention storage, and thus greater potential retention performance.
582
[Approximate location of Figure 12]
4.5.3. Summary 584
The modelling exercise has clearly demonstrated that retention effects
585
dominate over detention effects, with increased ADWP durations resulting in
586
significantly greater improvements in peak attenuation compared with those
587
due to either sub-annual, or long-term changes in detention charateristics.
588
Similarly, for sub-annual variations, PET rates strongly dictate the levels of
589
achievable performance in the cooler winter months.
590
5. Discussion
591
5.1. Retention 592
Long-term performance evolutions 593
In most cases, the presented data suggest that something occurred late
594
in Year-2/early in Year-3 resulting in increases to field capacity, particularly
595
in the lower substrate layers. Such a clear divide between Year-2 and Year-3
596
could indicate the end of the primary consolidation process of the substrate.
597
Whilst substrate levels were not measured, significant substrate consolidation
598
was not visually observed in Year-3 to Year-6, with substrate levels
maintain-599
ing approximate design depths. Hill et al. (2016) identified that substrate
600
depth was not significantly reduced from original design depth, even for
sys-601
tems with up to 17-years of maturation. This observation is consistent with
602
data from Year-3 onwards where field capacity – and inferred consolidation
603
– is not significantly different from year-to-year. Consolidation reduces pore
604
sizes, leading to more pores being capable of holding water against
grav-605
ity, thus improving field capacity (Menon et al., 2015). The HLS and SCS
606
substrates are supplied with compaction factors from the manufacturer of
1.25 and 1.12 respectively. FLL characterisation of substrate field capacity
608
is undertaken on compacted substrate samples to replicate established roof
609
conditions. A compaction factor of approximately 1.2 is used, whereby 120
610
mm of substrate is compacted to a 100 mm depth for testing. The similarity
611
of monitored field capacity values (Figure 4) and FLL-derived values
(Ta-612
ble 1) from Year-3 onward could indicate a similar level of compaction in the
613
in-situ substrates to the FLL test samples. This further suggests that prior
614
to Year-3 the in-situ substrates were not fully consolidated.
615
In the upper substrate layers the differences between median monitored
616
field capacity in Year-2 and Year-3 are reduced for vegetated substrate
con-617
figurations compared to lower layers and unvegetated configurations. This
618
suggests that the vegetation is playing a role in moderating substrate
con-619
solidation, an observation that has also been made in bio-filter media
(Vi-620
rahsawmy et al., 2014).
621
Whilst substrate consolidation may have led to the observed increased
622
values of ΘF C, the absolute retention storage capacity of the roof may not 623
have increased as predicted. As ΘF C is measured as a percentage, reducing 624
substrate depths (consolidation) will mean that retention capacity will
de-625
crease if ΘF C is constant. The substrate depths of the Hadfield Test Beds 626
were not monitored over the course of the monitoring programme and so it
627
cannot be definitively said that the identified increases to ΘF C have led to 628
corresponding increases in retention capacities. Assuming the following:
con-629
solidation in line with the manufacturer’s recommendations for HLS; PWP
630
values equal to those identified by Po¨e et al. (2015); an initial substrate depth
631
of 100 mm; a final substrate depth of 80 mm; and utilising the median values
of monitored field capacity for TB1, potential retention capacity (PRC) in
633
an unaged TB1 would have been approximately 28 mm compared to 26 mm
634
in an aged TB1. This example highlights the importance of
understand-635
ing the relationships between substrate physical properties and hydrological
636
performance.
637
Ultimately, from the analysis of long-term retention performance, there
638
is evidence of an increase in ΘF C between Year-2 and Year-3, but there is 639
little significant change after this point. If these increases in ΘF C are a result 640
of consolidation, then substrate depths are required to assess changes in the
641
absolute potential retention capacity of the system.
642
Sub-annual temporal variations 643
Seasonal trends within the monitored field capacity data closely follow
644
expectations of seasonal vegetation behaviour, with greater foliage extent
645
and higher water use in summer months. However, the presence of seasonal
646
changes also in TB7, which is unvegetated, indicate that this is unlikely to
647
be the sole cause. An alternative hypothesis is that a seasonal variation in
648
the substrate’s wetting and drying response — as a result of variable water
649
repellency — is being observed. As a substrate dries, just like an ordinary
650
soil, the organic secretions of roots and soil microorganisms become more
651
concentrated. In doing so, these secretions become increasingly
hydropho-652
bic, actively repelling water (Doerr et al., 2000). During winter months,
653
frequent rainfall events and low levels of ET prohibit the substrate from
dry-654
ing excessively (Berretta et al., 2014), preventing the formation of strongly
655
hydrophobic films on substrate particles. Low levels of hydrophobicity
al-656
low water to adhere to substrate surfaces, increasing the moisture content.
Contrastingly, in summer, there are fewer rainfall events and higher
tempera-658
tures, allowing for greater depletion of substrate moisture through ET. These
659
conditions allow for the generation of a hydrophobic environment, such that
660
at the onset of the next rainfall event water is repelled from substrate
par-661
ticles (Doerr et al., 2000). This causes rainfall to leave the green roof more
662
quickly and prevents the ingress of water to smaller pores, resulting in lower
663
substrate moisture levels than may otherwise be theorised.
664
5.2. Detention 665
Annual temporal variations 666
Conventional detention metrics derived from observed runoff are not
inde-667
pendent of retention effects and are poor descriptors of differences in
tempo-668
ral changes in actual detention processes. The application of a hydrological
669
model to simulate detention processes, and the fitting of its parameters,
pro-670
vides an independent and more descriptive overview of potential variation in
671
detention performance in the long-term. The steady year-on-year increase
672
in the value of DS observed in the unvegetated test beds implies that the 673
driver of this change is a continuously occurring process. The more
consis-674
tent values of DS over time for vegetated beds suggest that vegetation helps 675
mitigate against the negative effects of this unidentified process on detention
676
performance. A reduction in detention performance (implied by increased
677
DS values) is perhaps unexpected, if substrate consolidation is occurring —
678
as hypothesised from monitored field capacity observations — then detention
679
performance may be expected to increase. Consolidation reduces substrate
680
pore sizes, potentially reducing the cross-sectional area for water flow, thus
resulting in a reduced hydraulic conductivity and a theorised improved
de-682
tention performance (De-Ville et al., 2017).
683
The steady increases in DS in the unvegetated beds could indicate the
684
steady decay of the initial organic matter content over time. This loss of
685
organic content has been observed in the literature, with Bouzouidja et al.
686
(2016) observing a net loss of organic matter (peat dust and pine bark) from
687
5.0 to 2.1% v/v over 4 years in a vegetated system. Therefore, greater
or-688
ganic losses may be expected in the unvegetated test beds as no new organic
689
matter is entrained through vegetative processes. The long-term stability of
690
different organic matter types within extensive green roof systems remains
691
largely unexplored. However, the use of partially decomposed organic
mat-692
ter (such as peat, and/or peat dust) in new systems may result in greater
693
decomposition than other sources (Ampim et al., 2010). The unvegetated
694
LECA substrate (TB9) experiences the greatest increase in median DS over 695
the study period, its compost only organic material may have decayed faster
696
than the compost and fibre mix of HLS and SCS. For the unvegetated LECA
697
substrate (TB9), the trend seen in the first 5 years of the study would
sup-698
port this hypothesis of organic content decay, with detention performance
699
deterioration slowing until a steady level is reached around Year-4 to Year-5.
700
This hypothesis could have been confirmed through the repeated sampling
701
and analysis of substrate samples for organic content. The impact that
or-702
ganic matter changes can have on green roof hydrological performance was
703
demonstrated by Yio et al. (2013), where a threefold reduction in organic
704
content (coir) caused peak attenuation to fall from >50 to 15%.
Sub-annual temporal variations 706
Seasonal trends in DS are the result of many co-active processes, the
707
most visible cause being vegetation growth phases, evidenced by the
gener-708
ally reduced variation seen for unvegetated test beds (Table 2). It may have
709
been expected that the Meadow-Flower vegetation (TB4-6) would experience
710
the greatest levels of variation, due to the deciduous nature of many of the
711
species, which greatly reduces vegetation coverage in winter months.
How-712
ever, Sedum vegetated configurations experienced the greatest sub-annual
713
variation for 2 of the 3 substrate types (SCS - TB2, and LECA - TB3,
Ta-714
ble 2). This observation, coupled with the presence of sub-annual variation
715
in unvegetated test beds, indicates the presence of additional drivers of
vari-716
ation.
717
The sub-annual variation in substrate water repellency, hypothesised for
718
the retention analysis, also has the potential to influence detention
perfor-719
mance. The greater substrate moisture during winter months and reduced
720
hydrophobicity/repellency permits the movement of water through the small
721
pore networks of the substrate. This leads to increased travel times and
722
ultimately greater detention performance, whilst in summer, increased
hy-723
drophobicity/repellency prevent water ingress into smaller pores and directs
724
it into preferential flow paths (Doerr et al., 2000), reducing travel times and
725
thereby reducing detention performance. The reduced levels of seasonal
vari-726
ation in the unvegetated test beds are therefore believed to be associated
727
with reduced levels of organic matter and the absence of roots. Without
728
these, the generation of hydrophobic conditions is greatly reduced.
Com-729
bining observations for TB9’s year-on-year decline in detention performance
— hypothesised to be associated with reducing organic levels — with these
731
seasonal trends, adds additional support to the hypothesis of substrate
hy-732
drophobicity/repellency being the main observable driver of seasonal
perfor-733
mance variation.
734
5.3. Comparison of long-term evolutions and sub-annual performance varia-735
tions 736
Whilst long-term evolutions in retention and detention performance were
737
observable for vegetated configurations, they generally resulted in
insignifi-738
cant reductions to overall hydrological performance. This evidence of
con-739
sistent long term potential hydrological performance is reassuring given the
740
increasing deployment of extensive green roof systems globally. However,
741
sub-annual changes in the value of DS were an order of magnitude higher
742
than long-term evolutions. As discussed previously, TB1 experienced a 4%
re-743
duction in peak attenuation from Year-1 to Year-6, but a 15% reduction from
744
winter to summer. This provides further evidence that sub-annual trends are
745
more important in predicting vegetated green roof hydrological performance
746
than long-term trends. As green roof systems are predominantly vegetated,
747
these findings may be of particular importance to stormwater engineers.
748
The inverse relationships of sub-annual retention and detention
perfor-749
mance, are likely to result in a moderately consistent year-round runoff
750
response. Reduced summer detention performance is negated by typically
751
longer ADWPs (greater retention), and elevated winter detention benefits
752
restricted by low levels of PET (reduced retention). Figure 12 highlights
753
these effects whilst also exploring the role of storm duration and return
pe-754
riod. It is seen that extended storm durations and increased return periods,
both synonymous with higher rainfall, result in reduced peak attenuation
756
performance in all cases. This further highlights the finite nature of
reten-757
tion capacities and the importance of ADWP duration for storage recovery.
758
6. Conclusions
759
This study has explored the temporal variations in potential hydrological
760
performance of a series of extensive green roof test beds with varying
con-761
figuration. Potential retention performance was identified through a novel
762
approach of substrate moisture content monitoring. Detention performance
763
was identified via descriptive hydrological model parameters. Together, these
764
observations permitted the prediction of overall hydrological response
varia-765
tion at sub-annual and long-term temporal scales.
766
Monitored trends in substrate field capacity over time indicate an overall
767
increase in potential retention performance over the study period. The small
768
improvements in retention performance are likely to be the result of substrate
769
consolidation generating more small substrate pores capable of holding water
770
against gravity. Increased consolidation in the unvegetated test bed indicates
771
that root action helps to stabilise retention performance over time. However,
772
the magnitude of these improvements is exceeded by seasonal performance
773
variations.
774
For detention performance, seasonal variation also proved to be more
775
evident compared with annual trends. The steady year-on-year decline in
776
detention performance for unvegetated test beds, compared to the relatively
777
stable yearly performance of vegetated test beds, suggests that organic
mat-778
ter decay is the likely cause of long-term detention performance deterioration.
However, this hypothesis needs to be confirmed with monitoring of organic
780
content evolution.
781
The identified sub-annual trends in retention and detention are
hypoth-782
esised to be a result of temporally variable hydrophobicity/water repellency
783
of the substrate. However, PET is also a controlling factor for potential
784
retention performance. In the warmer summer months, water repellency
785
is increased, limiting the elevated summer potential retention generated by
786
greater PET, and directing flow into preferential flow paths thus reducing
787
detention performance. In the cooler winter months, water repellency is low
788
and so does not restrict potential retention performance which is then
lim-789
ited by low levels of PET. Detention performance is maximised under winter
790
conditions as flow is more uniformly distributed throughout the substrate.
791
All of the above findings may help to explain why a Sedum vegetated
792
green roof with a brick-based substrate has become a global industry
stan-793
dard. This configuration is capable of supporting strong levels of retention
794
and detention, without significant long-term deteriorations in performance.
795
However, what has been highlighted is the need for further understanding of
796
the precise drivers of sub-annual variation. Multiple data sources and
meth-797
ods of analysis suggest that sub-annual water repellency cycles could be the
798
driver, but further research is required.
799
Acknowledgements
800
Simon De-Ville was supported by an EPSRC DTA Award (EP/L505055/1).