GREECE
Greece
By
The Research Centre
Athens University of Economics and Business
December 1996
Luxembourg: Office for Official Publications of the European Communities, 1997 ISBN 92-827-8747-8
© ECSC-EC-EAEC, Brussels · Luxembourg, 1997
Athena Petraki Kottis and George Chr. Kottis
ACKNOWLEDGEMENTS
ACKNOWLEDGEMENTS
TABLE OF CONTENTS
EXECUTIVE SUMMARY i-x
I. LABOUR MARKET ANALYSIS AND FORECASTS 1
1.1 DEMOGRAPHIC TRENDS 1
1.1.1 Population trends 1 1.1.2 Recent changes in the size and age structure of the labour force;
projections 1 1.1.3 Migration trends 2
1.2 STRUCTURE OF THE WORK FORCE 3
1.2.1 Employment 3
• Labour force participation and trends 3
• Industrial, occupational, age, qualification and gender structure of
employment and trends 5 • Gender and regional growth of employment and trends 7
• Part-time employment, short-term contracts and hours of work 7
• Self employment and employment in family enterprises 9
• Employment in the public sector 10
• Employment projections 11
1.2.2 Unemployment 11
• Unemployment trends 12
• Age, gender, education and skill-level structure of unemployment 13 • Long-term unemployment and the incidence of it among various groups. 15
• Structural unemployment 16
• Regional variation of unemployment and areas of industrial decline 16
1.3 MAIN TRENDS IN JOB CREATION AND JOB LOSS 17
1.3.1 Job creation and job loss 17 1.3.2 Incidence of job loss on various groups 22
1.3.3 Labour mobility and turnover 23 1.3.4 Characteristics of job seekers and job search procedures 24
1.3.5 Unfilled vacancies and unemployment: The Beveridge relationship 25
1.4 WAGE AND SALARY TRENDS 27 1.4.1 The incomes policies and developments in the labour market in the 1980s .. 27
1.4.2 Wages, productivity, inflation and unemployment in the 1990s 28
1.4.3 Changes in unit labour costs 29 1.4.4 Changes in labour remuneration, productivity and unit labour costs in
manufacturing 30 1.4.5 Changes in labour remuneration in other sectors of the economy 30
1.4.10 Efficiency of the process of wage determination 33
1.5 ANALYSIS OF PRINCIPAL CAUSES OF THE RISE
IN UNEMPLOYMENT SINCE 1980 35 1.5.1 Causes of unemployment and its breakdown into classical, structural
and cyclical 35 1.5.2 Factors that have affected unemployment 36
• Contraction of the agricultural sector 36
• Stagnation and restructuring of the industrial sector 37
• Increase in the labour force participation of women 37 • Restrictive macroeconomic and exchange-rate policies, insufficient
eco-nomic growth and decrease in the rates of hiring by the public sector 38 • Wage increases irrespective of productivity changes and high
labour costs 38
• Structural problems and rigidities 39
• Inefficiencies in the organisation of the labour market 39
• Relatively large legal and illegal immigration 40
1.5.3 The non-accelerating inflation rate of unemployment (NAIRU) 41
1.6 MACROECONOMIC POLICIES AND FORECASTS 42
1.6.1 Long-run growth trends 42 1.6.2 Recent macroeconomic developments 42
1.6.3 Current macroeconomic policies and intermediate-run forecasts 44
1.6.4 Economic targets in relation to the EMU criteria 45 1.6.5 Impact of the macro-economic policies on employment 47 1.6.6 Main forecasts and medium-term scenarios of employment/unemployment. 49
II. LABOUR MARKET INSTITUTIONS 50
ILI PUBLIC INSTITUTIONS 50
II.2 THE SYSTEM OF INDUSTRIAL RELATIONS AND COLLECTIVE
WAGE NEGOTIATIONS 54
11.2.1 General 54 11.2.2 Main statutes and laws governing industrial relations 54
11.2.3 Structure and organisation of labour unions 55
11.2.4 Labour-union participation 55 11.2.5 The employers' organisations 56 11.2.6 Collective bargaining and collective agreements 57
11.2.7 Industrial action and procedures for resolving industrial disputes 58
11.2.8 The main functions of OMED and ELINYAE 59
III. LABOUR MARKET LEGISLATION 60
111.2.1 Legal and contractual limitations to working hours and regulations
concerning overtime, weekly rest periods, holidays and night work 62
• Minimum and maximum of normal working hours 62
• Overtime work 63 • Weekly rest periods 63
• Holidays 63
• Night - work 64 111.2.2 Career breaks and leaves of absence for longer periods 64
• Maternity leave 64
• Parental leave 64
111.2.3 The debate concerning the reduction of hours of work to increase
employment 65
111.3 MINIMUM WAGE REGULATION; RECENT AGREEMENTS ON
MINIMUM WAGES 65
IV. LABOUR MARKET POLICIES 66
IV.1 PASSIVE MEASURES 66 IV. 1.1 Unemployment benefits 66
• Replacement ratios 68
I V.l.2 Early retirement 69
IV.2 ACTIVE LABOUR MARKET POLICIES 69 IV.2.1 Vocational training, retraining and occupational mobility 70
• The OAED Apprenticeship Programme 71
• The O A ED A ccelerated Vocational Training Programme (TEK) 71
• OAED intra-enterprise training programmes 73
• OAED Programmes for training in professions related to the
hospitality industry 74 • Training in Post-secondary Vocational Training Institutes (IEK) 74
• Training Programmes for the Unemployed organised by various
professional and educational organisations 74
IV.2.2 Vocational guidance 75 IV.2.3 Subsidies to employers for the creation of new jobs 75
• General programme 75 • Grants for employing graduates of institutions of higher education 76
• Subsidies to hotels 76
• Subsidies to private firms where students of higher-level technical
schools (TEIs) are employed to gain practical experience 76 • Subsidy to enhance the geographic mobility of unemployed persons 76
IV.2.4 The OAED self-employment programme 76 IV.2.5 Measures for special groups of workers 77
IV.2.6
IV.2.7 IV.2.8 IV.2.9
labour market
• Support for repatriates and naturalised immigrants of Greek origin • Subsidies to firms employing former drug addicts and
former prisoners
Packages of measures for workers dismissed because of the privatisation of public enterprises and for workers in areas with high concentration of unemployment
Financing of active policy measures
Emergence of new pools of work and role to be played by active policies.... Overall evaluation of active labour market measures applied so far
in Greece
IV.2.10 New labour market policies under the multi-annual plan and the new law for employment and vocational training
• Fund for Employment and Vocational Training
• Introduction of a system of employment cards for all members of the labour force, Greek and foreign
• Mapping of the labour market
• Unemployment allowances and measures to promote employment • Linking vocational training programmes with employment
• Programmes for promoting employment in private firms
• Subsidisation of employers for the coverage of non-wage labour costs.... • Measures for enabling new graduates to acquire professional
experience
• Training of persons employed in large construction projects • Measures for lhe long-term unemployed
• Restructuring and modernisation of the National Manpower Employment Organisation (OAED)
• Measures for enhancing the mobility of unemployed persons • Offices for Dissemination of Information and Promotion of
Employment
• Requirements for legal residence and permission to work for foreigners in Greece
IV.2.11 The new labour market policies and the five Essen guidelines • Improving employment opportunities for the labour force by
promoting investment in vocational training • Improving the employment - intensity of growth • Reducing indirect labour costs
• Improving the effectiveness of labour-market policies
• Improving measures to help groups particularly hard-hit by unemployment
78 78
78
78 79 80
80
81 82
82 84 84 85 85 85
86 86 86
86 87
88
88 89
89 90 90 91
V. 1.1 Description of the national education and training systems 93
V.l.2 Rates of participation and trends 96 V.l.3 Strengths and weaknesses of the system 97
V.l.4 Educational attainment and labour market experience 100
V.2 SOCIAL BENEFITS, TAXATION AND THE LABOUR MARKET 102
V.2.1 General 102
V.2.2 Social security contributions and the tax wedge 102 V.2.3 Social security contribution rates and taxes on low earnings 104
V.2.4 Marginal rates on average earnings 104 V.2.5 Charges on employers and employees and their effects on employment 105
V.2.6 Reforming the structure of current income tax and social security system
to fight labour market exclusion 106
• Policies targeting labour supply 106
• Policies targeting labour demand. 707
V.2.7 Possibilities for making up for lost revenues from future reforms in the
tax and social security systems 107
V.3 INDUSTRIAL POLICIES AND LABOUR MARKETS 108
V.3.1 Introduction 108 V.3.2 Sectoral and regional policies 109
V.3.3 Policies for Small and Medium Enterprises 110 V.3.4 State control and privatization policies 112
V.3.5 Restructuring policies 113 V.3.6 Industrial policies in the 1990s and implications for employment 114
VI. ISSUES OF NATIONAL DEBATE AND POLICY PERSPECTIVES 116
VI. 1 SEGMENTATION OF THE LABOUR MARKET AND
ITS IMPLICATIONS 116
VI.2 THE WAGE FORMATION PROCESS AND THE RELEVANT
INSTITUTIONAL SET-UP 116
VI.3 EMPLOYMENT PROTECTION LEGISLATION AND NEED FOR
GREATER FLEXIBILITY 119
VI.4 HIGH LEVEL OF NON-WAGE LABOUR COSTS 120
VI.5 ISSUES RELATED TO LABOUR MARKET POLICIES 121 VI.5.1 Unemployment benefits and rigidities in the labour market 121 VI.5.2 Effectiveness of active labour market policies particularly with regard to
THE LABOUR MARKET 126
VI.8 ISSUES RELATED TO WORKING HOURS 127
VI .9 REFORMING TERTIARY EDUCATION AND IMPROVING
ITS LINKS WITH ENTERPRISES 128
ANNEX A : TABLES
1. Population of Greece in urban, semi-urban and rural areas, 1995 Al
2. Age distribution of population Al 3. Percentage population change by age, 1981-1991 and 1991-1995 A2
4. Size and growth of the labour force in urban, semi-urban and rural areas,
1981-1991 and 1991-1995 A2 5. Size and growth of the labour force by age and gender, 1981-1995 A3
6. Educational composition of the labour force, 1991, 1995 A4 7. Labour force participation rates by gender and age A4
8. Industrial structure of employment A5 9. EUROSTAT employment estimates A6
10. Distribution and sectoral shares of female employment A6 11. Age structure of employment by gender (percentages) A7 12. Age structure of employment by sector (percentages) A8 13. Educational structure of employment by sector 1995 (percentages) A9
14. Occupational structure of employment (percentages) AIO 15. Distribution of employment and changes by type of area and gender (percentages).A 10
16. Regional employment changes, 1991-1995 Al 1 17. Sectoral distribution of employment across types of areas, 1991 & 1995
(percentages) All 18. Average hours of work by gender (percentages of employed) A12
19. Average hours of work by sector (percentages employed) Al 2
20. Structure of employment by status and gender (percentages) A12 21. Structure of employment by status and sector, 1995 (percentages) Al 3
22. Employment in the public sector, 1991-1995 A13 23. Unemployment rates by gender and age (percentages) A14
24. Unemployment rates according to EUROSTAT data A14 25. Unemployment rates by educational level (percentages) A14
26. Unemployment for more than 12 months A15 27. Share of long-term unemployment according to EUROSTAT data (percentages).. Al 5
28. Distribution of long-term unemployment by age Al 5 29. Shares in long-term unemployment of men and women (percentages) Al 6
34. Changes in employment by sector (thousands) A18 35. Employment gains and losses in manufacturing firms according to size
(number of posts) Al 8
36. Employment gains and losses by region and sector, 1988- 1991 A19
37. Employment gains and losses in manufacturing A19 38. Employment in Greece by one-digit occupation, 1981, 1991 and 2000 A20
39. Balance of labour requirements and new labour force, by region, 1991-2000 A21
40. Monthly new hirings and job losses, in 1994-1995 A22 41. Job losers in 1991 and 1995 by age, sex and type of activity (percentages) A22
42. Risk rates of job losses by age and type of activity in Greece,
1986-87 and 1994-95 A23 43. Employees seeking another job by activity, sex, age and reason, 1991 and 1995
(percentages) A23 44. Job search procedures by sex and age, 1991 and 1995 (percentages) A24
45. Unemployment and vacancy rates in Greece: 1980-1993 A24 46. Percentage change over preceeding year in nominal and real wages,
productivity, unit labour costs, minimum wages and prices A25-26 47. Unit labour costs, percentage change over preceding year A27
48. Total and long-term unemployment rates A27 49. Percentage change of gross private productive capacity and of labour force A28
50. Estimates of NAIRU for Greece and EUR 12 and unemployment rates A28 51. Percentage changes in basic macroeconomic magnitudes over preceding year ... A29
52. Economic targets in relation to the EMU criteria and GDP growth according to
the Convergence Programme and realised magnitudes A29
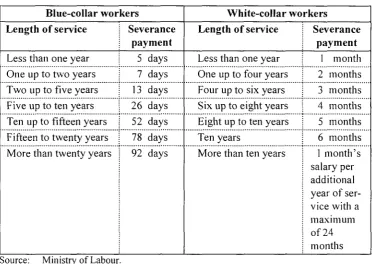
53. Severance payments A30 54. Collectively agreed wage rates in selected industries, 1995 A30
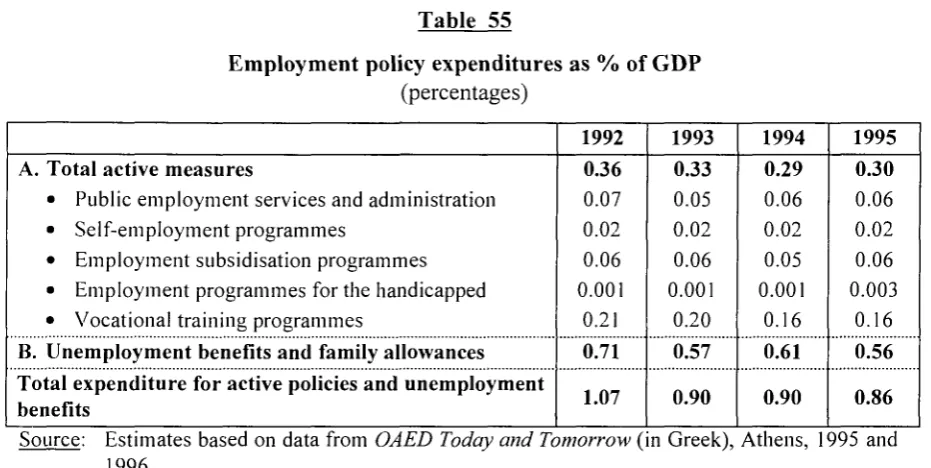
55. Employment policy expenditure as % of GDP A31
56. Duration of unemployment benefits A31 57. Percentage of the unemployed receiving benefits A31
58. Number of persons in the apprenticeship programme and cost A32 59. Number of persons trained and cost of training provided through the OAED
Accelerated Vocational Training Programme A32 60. Number of persons trained and cost of the intra-enterprise training programmes A32
61. New jobs created by the OAED self-employment programme and cost A33 62. New entrepreneurs subsidised by the OAED self- employment programme
and cost A33 63. Contributions to OAED revenues A34
3. Population change by age 1981-91 and 1991-95 B2 4. Labour force by type of area in 1981, 1991, 1995 B2 5. Change of the labour force by type of area, 1981-91 and 1991-95 B3
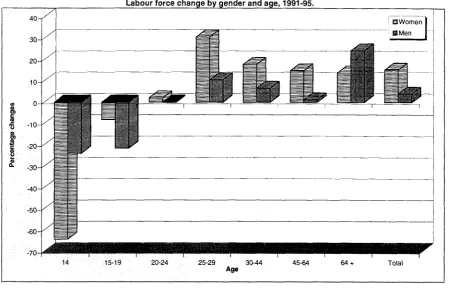
6. Labour force change by gender and age, 1981-91 B3 7. Labour force change by gender and age, 1991-95 B4 8. Labour force participation rates by gender, 1981, 1991, 1995 B4
9. Labour force participation rates by age, 1981, 1991, 1993, 1995 B5
10. Employment by sector, 1981, 1991, 1993, 1995 B5 11. Employment shares, 1981, 1991, 1993, 1995 B6 12. Change in employment by sector, 1981-91 and 1993-95 B6
13. Change in employment by age, 1981-91 and 1991-95 B7 14. Change in male employment by age 1981-91 and 1991-95 B7 15. Change in female employment by age 1981-91 and 1993-95 B8 16. Change in employment by type of area and gender, 1981-91 B8 17. Change in employment by type of area and gender, 1991-95 B9
18. Unemployment rates by gender and age, 1995 B9 19. Long-term unemployment, 1981, 1991, 1995 BIO
20. Unemployment rates by region, 1995 BIO 21. Unemployment-vacancy relationship 1980-1993 (OAED unemployment rates). Β11
22. Unemployment-vacancy relationship, 1980-1993 (Labour Force Survey
unemployment rates) Bl 1
23. Unemployment-vacancy relationship, 1980-1993 B12 24. Unemployment-vacancy relationship, 1980-1987 B12 25. Changes in real remuneration, real minimum wage and labour productivity
in the economy, 1989-1995 B13 26. Changes in real average hourly earnings and productivity in manufacturing:
changes in real minimum wage, 1989-1995 B13 27. Changes in average nominal and real remuneration and in real minimum wage;
rates of inflation and unemployment, 1989-1995 B14 28. Inflation and unemployment rates, 1990-1995 B14
ANNEX C : INFORMATION ON AVERAGE EARNINGS, SOCIAL SECU
RITY CONTRIBUTIONS AND TAXES AND METHODOLOGY
FOR THE ESTIMATION OF TAX WEDGES CI
• Average earnings CI • Social security contributions CI
• Personal income tax system CI
• Average and marginal tax wedges on labour C2
ANNEX D : EXPLANATION OF ACRONYMS USED IN THE REPORT
EXECUTIVE SUMMARY
During the last two decades Greece's population has been growing very slowly, while the number of people in the younger age groups has been declining. The ageing population phenomenon has become more apparent in the 1990s.
The labour force has been rising faster than the population mainly because of the increase in the number of women entering the labour market. This growth is concentrated in the urban and semi-urban areas, while the rural areas have experienced losses of both population and labour force. Labour force participation in Greece continues to lag behind that of many other EU countries for both men and women. In
1981-1991 the overall participation rate remained almost unchanged since the decrease in men's participation rates were offset by an equivalent increase in women's rates. In 1991-1995 there was an upward trend, attributed mainly to the increasing participation rate of women and the tightening of the retirement conditions. During that period the participation rate for the age group under 20 decreased, most likely because of an increased emphasis on schooling, the availability of more opportunities for vocational training and the rise in the rate of unemployment.
Despite the decline in the natural rate of population growth, the labour force is likely to increase in the near future because of immigration, the further increase in women's participation rates, the tightening of retirement conditions and the greater participation of younger people, if employment opportunities improve. According to our projections, during 1995-99 labour force is expected to increase by 4.02 to 5.44 percent.
The educational structure of the labour force has shown significant improvements in recent years. There has been a positive relationship between levels of education and participation rates, which has been more pronounced in the case of females.
Employment in Greece is characterised by certain tendencies observed in less developed economies, such as, high percentages of people employed in agriculture, large self-employment, large proportion of employees working in the public sector (about one third of all employees), low percentage of people with dependent employment, large size of "hidden" economy, relatively low labour force participation rates of women, etc. Because of these characteristics it is difficult to have a precise picture of the changes in employment and unemployment in the country. Changes in the supply and demand for labour affect self-employment, disguised unemployment, underemployment, multi-job holding and employment in the "hidden" economy, and may have relatively small effects on the official employment and unemployment figures.
employment, but there were few expanding industries and thus employment in major industry fell at a slow rate. Because of the expansion of small-scale industry, total manufacturing employment increased. In the 1990s the situation deteriorated even further and almost all industries faced serious problems. As a result, in 1991-1995 employment in the manufacturing sector decreased by 11.3%
Significant employment gains were recorded in the tertiary sector in both 1981-1991 and 1991-1995. However, a relatively large number of the new jobs were in the public sector (including enterprises controlled by the State).
During 1981-1991 and 1991-1995 women's share in total employment increased, particularly in services.
Greece has the lowest percentage of part-time workers among the EU countries. Legislation supporting part-time employment was introduced in 1990, but there has been little change in the percentage of people working part-time since then.
There are serious restrictions to overtime work, particularly in the case of industrial firms, but it is difficult to know how binding these are, since their enforcement is difficult, particularly in the case of small firms. Although multiple job holding is quite common in the country, only a very small percentage of the employed persons were recorded as having more than one job, probably due to non-reporting.
The introduction of a fourth shift allowed a number of firms to add a shift and this resulted in the increase in the average weekly hours of work in Greek industry from 64 to 1989 to 88 in 1994. Over that period the number of industrial firms operating in shifts increased from 52 to 86 per cent of the total number.
Employment on fixed-term contracts is quite common in Greece. Self-employment is relatively high. Close to half of employed persons are employers, self-employed or assistants without payment in family enterprises. A relatively high proportion of salary and wage earners are employed in the public sector.
The main characteristics of unemployment in Greece are its unequal regional distribution with a high concentration in certain areas and the heavy incidence of it on certain groups of people, especially the young and women. Particular problems exist for persons aged 45 and over, whose unemployment rate, although below average, has increased in recent years, since the possibilities for those unemployed in this age group to find employment are very limited.
Unemployment has increased substantially in Greece in recent years for several reasons, the most important of which are the contraction of agricultural employment, the restructuring and insufficient growth of the industrial sector, the increase in the labour force participation of women, the restriction of hiring by the public sector, the restrictive monetary and exchange-rate policies and the insufficient economic growth, the increase in wages irrespectively of changes in productivity and the consequent rise in labour costs, the structural problems and rigidities in the economy, the inefficiencies in the organisation of the labour market and the relatively large legal and illegal immigration.
because the pressures on the labour market are likely to increase in the near future, since according to expectations employment in the agricultural sector will continue to contract, women's entry into the labour market will be accelerated, immigration flows will continue and extensive restructuring and adjustments in the economy have to take place. Until recently the problem of unemployment in Greece had been disguised, because of large-scale recruitment by the public sector, a policy that has drastically changed.
Unemployment is higher in the urban areas, compared to semi-urban and rural areas and falls heavily on women, the young people and people over 50. The probability of becoming unemployed is higher for those with secondary-school education or education in technical and vocational schools of all levels and lower for persons with primary education or less. University graduates suffer from less than average but still relatively high unemployment rates.
Under present conditions, unemployment comes more from the inability of new entrants to find jobs and less from dismissals. The share of long-term unemployed among all unemployed is relatively high and increasing, particularly for women. Unemployment rates and long-term unemployment vary considerably across regions. Deep pockets of unemployment exist in certain areas where there have been major factory closures.
There are conflicting forecasts about expected changes in employment in the near future. According to our projections, employment during 1995-1999 will increase by 4.85% and therefore its growth will be close to that of the labour force. This means that the additional job creation will not be sufficient to alleviate the existing unemployment problem.
According to another estimate (coming from an unpublished study of KEPE), almost all industries in major manufacturing are expected to experience employment losses in
1996-1998. There will be some gains in small industry but the net employment creation in the whole manufacturing sector is expected to be insignificant. Moreover, forecasts about employment in the tertiary sector are pessimistic, due to automation and the expected restrictions on hiring by the public sector. Therefore, total employment is not expected to increase.
According to yet another forecast, a surplus of available jobs (beyond the number of the unemployed) is expected in the year 2000 but serious imbalances are likely to appear because of regional, educational and occupational mismatches between the supply and demand for labour.
independently of changes in productivity or unemployment. Up to 1990 there was strong Government intervention in the wage formation process, through an inflation indexation system and direct mingling in collective negotiation procedures. In 1990 the inflation indexation system was abandoned and new legislation on industrial relations was introduced that eliminated direct government interventions in collective negotiations.
With the above reforms, the wage formation process has improved considerably. However, observers point out that the Government still exercises some influence on collective agreements by announcing wage increases and inflation catch-up clauses for civil servants. These are usually considered by labour unions as a floor and negotiations take place for further improvements. Also several weaknesses in the existing arrangements for wage negotiations and for mediation and arbitration have been pointed out by the employers' associations.
In recent years because, of excessive wage increases, labour costs have risen more than inflation and this has reduced the competitiveness of the Greek products.
The country is making considerable effort to reduce inflation, eliminate budget deficits and restrict the public debt to the levels required for participation in the EMU. The restrictive monetary policies, the high interest rates and the exchange rate policy were not conducive to a substantial expansion of economic activity or a boost to employment.
According to Government announcements, the restrictive macro-economic policies are going to be continued. Although in the long run these policies will be beneficial to the economy, in the shortrun they will restrict aggregate demand and have negative effects on economic activity and employment growth. However, with the reduction of inflation and the curbing of fiscal problems, cuts in the rates of interest will be made possible and this will start to invigorate the economy.
Employment policy expenditures as a % of GDP have been very low. Greece is among the countries in the EU with the smallest expenditure on labour market policies, as a % of GDP. Another characteristic is that the largest part of the expenditure is devoted to passive measures.
The unemployment benefit system is not generous and could not be considered as creating work disincentives or a risk of an unemployment trap, as in many other countries. As a matter of fact the system has been characterised as among the least generous in the OECD countries. The benefit corresponds to about 50% of the minimum wage for workers without previous experience.
Expenditure on active labour market programmes have increased in recent years but continue to be the lowest among OECD countries. In the mid-1990s they represented only 0.56% of the country's GDP and were a little more than half of the expenditure on passive programmes.
Under present conditions, with the pressing economic problems that exist and the need to correct chronic macroeconomic imbalances and to satisfy the EMU criteria, the
-weight of the effort has to fall on structural measures of a micro-economic nature.
The main organisation responsible for running active labour market programmes is the
Manpower Employment Organisation (OAED). Since the early 1980s various measures have been used to combat unemployment. Training and retraining programmes, subsidising employers to hire unemployed persons and subsidising the unemployed to start new enterprises, have been the most important of the active measures used so far.
With the increase in the financial resources coming from the European Community in the late 1980s, there has been a rapid rise in the number of people participating in programmes introduced to combat unemployment. Also, there has been an increase in the number of other organisations offering training programmes. However, still the percentage of the labour force participating in these programmes and the relative size of the expenditures on them has remained very low, compared to other European countries.
Evaluation of some of the active labour market programmes that have been implemented so far, has highlighted serious weaknesses and significant dead weight. In view of these problems, the pressing need to deal more effectively with rising unemployment and the requirement to conform to the directions of the Essen Council, the Government formulated a multi-annual plan with measures and policies aiming at reforming the labour market, improving the quality of the labour force, facilitating job search, providing incentives for new job creation and hiring the unemployed, improving the matching up of the unemployed to vacancies and dealing in particular with the problems of youth unemployment and of areas with high unemployment concentration.
To implement the multi-annual programme, a law was passed in August 1996, which set a general framework for the measures and policies that are to be taken. The details of the application will be determined later with specific Ministerial Decisions or Presidential Decrees. The effectiveness of the new policies and measures will depend to a large extent upon the arrangements that are to be made for their application.
With regard to the implementation of the Multi-Annual Plan, various activities have taken place. The Government has put priority on the establishment of an appropriate institutional framework for the application of the policies and measures included in the Plan. In the Spring of 1995 the Experimental Institute of Vocational Training and Employment (PIEKA), staffed with a small number of highly qualified professionals, started operating. The institute is under the auspices of the Manpower Employment Organisation. Its purposes are the creation of a data bank on labour market statistics, the development of an integrated system of analysis and research concerning labour market issues, especially in the areas of local labour markets' employment potential, restructuring and industrial decline, and the development of innovative vocational training schemes. The institute has already started producing some research work in these areas, but its capabilities are limited, because of the small size of its staff.
institute has been involved in a number of tasks, such as monitoring and evaluating structures and outcomes of vocational training programmes, classifying legislation relating to issues governing working conditions, studying new forms of employment and the impact of technological innovations upon the labour market and facilitating the social dialogue between workers and employers.
Other institutions, that had been envisioned in the plan, were the Regional Committees of Vocational Training and Employment (PEEKA), which since have started to be established. A new institution is envisioned in the new law, the Regional Employment Observatories (PEPAs). The functions of the PEPA of Attica, which will perform the role of a National Employment Observatory (called EPA), will be undertaken by PIEKA.
To facilitate the implementation of the structural policies and measures included in the multi-annual plan, a high-level committee was established in 1996, consisting of the Minister of Labour, who acts as chairman, representatives from the Ministries of National Economy, Labour, Development and Agriculture, the Director-general of OAED, three independent experts and a representative from the Economic Office of the Prime Minister. This Committee is responsible for: (a) the refinement of the measures and policies included in the plan, (b) the supervision of the implementation sub-committees that will be established within OAED, (c) the contribution to the reorganisation of OAED and (d) the redrafting of the plan that was submitted to the EU, in accordance with the directions of the Essen Council.
Another institution that has recently been established is the Organisation for Certifying Training Institutes which would be eligible to undertake subsidised training. These institutions have to satisfy certain criteria regarding their facilities, the quality of teachers, their programmes etc., in order to be recognised as Centres of Vocational Training (KEK). A number of KEKs have been established and are implementing training programmes subsidised by the Ministry of Labour (with state and ESF funds).
An important development has been the recent agreement by the social partners to make contributions to finance training programmes for the employed and measures against long-term unemployment. Two separate accounts have been set up for this purpose. The first is entitled Special Unemployment Fund (EKLA) and is to be financed by a social security contribution increase of 0.35% (0.25% paid by employers and 0.10% paid by the employees). The second account bears the title Special Fund for Vocational Education and Training Programmes (ELPEKE) and is to be financed by an additional social security contribution increase of 0.45%, to be paid by employers. Under the new law the revenues from these funds will be administered by the newly-created "Fund for Employment and Vocational Training" (LAEK).
One area in which significant progress has been made with regard to the measures included in the plan is the mapping of the labour market. A computer network has been installed by OAED and is in operation, covering a number of Employment Offices in the Athens area, Thessaloniki, Volos and Larissa. The network is expanding with the gradual installation of terminals in other Employment Offices in the Athens area. Steps have been taken to expand the system in other parts of the country as well.
-modernisation of OAED. The enhanced role of social partners in the formation and implementation of employment policies, through their increased participation in the Administrative Board of OAED, is expected to improve the effectiveness of the organisation and also to promote the development of social solidarity towards the unemployed. The support of the work of OAED by a research institute (PIEKA), which has already started operation, could also contribute significantly to an increase in its effectiveness. Moreover, OAED has undertaken several steps to re-organise its services, train its personnel, promote better communication among its various departments and offices and to acquire and analyse information related to its activities and to labour market developments. In addition to this, OAED has began procedures to create a local network in the area of Attica, to automate the unemployment benefit distribution system. It plans to create 30 such networks covering the whole country.
Another important development is the establishment by OAED of three Pilot Professional Guidance Centres (located in Athens, Thessaloniki and Iraklio).
Despite the above improvements, a lot remains to be done with regard to the re-organisation and modernisation of OAED. A significant impediment to such changes is the restriction on public organisations on hiring new personnel.
The new system of employment cards with allowances which could be used as subsidies for employment or training or as unemployment benefits for all members of the labour force seems promising but the degree of its success will depend, to a large extent, upon the way it will be administered. According to some observers the system will prove complex to operate, difficult to administer without bureaucratic problems and easy to abuse. Several problems, regarding the application of the system, are discussed in the report. A pilot application has been planned for the autumn of 1996 but, up to September 1996, no preparatory activities had taken place.
With regard to the Essen guidelines, the multi-annual plan and the new law on employment envision several measures and policies. Since some of them have not been applied yet, it is difficult to make an overall evaluation.
The institutionalisation of new sources of funds through employer and employee contributions to promote vocational training and employment and the greater involvement of the social partners in the relevant decision-making bodies, the more extensive participation of firms in the provision of vocational training and the establishment of an institutional infrastructure to facilitate vocational training and upgrade its quality are measures that will increase the extent and the effectiveness of vocational training and will expand employment opportunities for the labour force.
greater flexibility in the organisations of work, such as arrangements for part-time employment, work in four shifts and the possibility of continuous operation of firms, are likely to increase the employment-intensity of growth.
The possibility of subsidising social security contributions paid by firms employing unemployed persons aged 20-29, will reduce indirect labour costs for this category of workers and encourage their employment. However, more extensive reforms will have to be considered in this regard.
A large number of measures and innovations are included in the multi-annual plan and the new law on employment, that could bring significant improvements in the effectiveness of labour market policies. However, the degree of their success will depend upon how fast and how well they are applied. Up to September 1996, steps had been taken towards setting-up a computerised system and modernising OAED, strengthening the social partners' involvement in its administration and supporting OAED activities with the establishment of a research institute, measures that are likely to contribute to an improvement in the effectiveness of labour market policies.
In the multi-annual plan and the new law there are provisions for several measures, in addition to those that already existed, to help groups particularly hard-hit by unemployment.
On the whole, since the law concerning most measures and policies included in the multi-annual plan passed very recently (August 1996), their implementation has been delayed. The steps that will be taken in the next few months will show how fast the new measures and policies are going to be applied.
An area that needs extensive reforms is education. The relatively high unemployment rates of graduates of universities and particularly of other tertiary-education institutions constitute the tip of an iceberg that has to be dealt with. Also, industrial policies and particularly policies for small and medium enterprises as well as policies for promoting restructuring and raising the chances for survival of firms should receive more attention. Speeding up the pace of restructuring and privatisation of the many public firms that exist is another area of importance.
The relatively large tax wedges that are created by the social security and tax systems reduce incentives to work and new job creation and efforts should be made to find ways to reduce them. The tax system is under consideration for revision and similar consideration should be given to the social security system.
Concluding this summary it is interesting to refer to some major issues of national debate and concern. An important issue relates to the segmentation of the labour market and the unresponsiveness of most segments to changes in labour market conditions. Particularly, in the case of segments associated with the public sector, there are features such as job security, tenure, the possibility for upward movement in the hierarchical ladder and salary increases independent of performance, that reduce the pressures for hard work and make the available positions highly desirable. However, these positions can only be obtained either through entry into the lower levels of the hierarchy or through non-competitive procedures and thus are isolated from the rest of the labour
many young people, prolong their job search and increase the duration of their unemployment.
Moreover, since the above segments as well as several segments in the private sector are not influenced by changes in labour market conditions, the pressures from such changes are restricted to the remaining segments of the labour market. Given the fact that to a large extent wages are determined by collective negotiations, and usually do not reflect changes in the supply and demand conditions, and that there are several restrictive employment protection policies, flexibility in a large part of that market may also be limited. Thus, the effects of changes are restricted to a relatively small segment of the market and are expressed mainly in the form of changes in the availability of jobs for new entrants and particularly for marginal workers and in unemployment, labour force participation rates and the extent of self-employment.
The wage formation system has been significantly improved since the abolition of inflation indexation and the reforms concerning collective negotiation agreements and mediation and arbitration procedures. However, the system suffers from some weaknesses that are discussed in the report and should be looked at.
The existing employment protection legislation contributes to the protection of certain jobs but restricts flexibility, raises costs and reduces employment opportunities available to those who are out of work. The employers' associations argue that this legislation should change, a suggestion strongly opposed by the labour unions.
The relatively high level of non-wage labour costs reduces the competitiveness of domestic products, encourages the expansion of activities in the hidden economy and reduces employment opportunities in the formal labour market. Because of an abuse of the pension system in the past and inefficiencies in its administration expenditure needs are relatively high, and since possibilities for transfers from the national budget are limited, social security contributions cannot be reduced. One solution to this problem would be to raise the upper level of earnings, beyond which social security contributions are not paid, and use the resulting revenues to make up for the loss from lowering the rates at the lower end of the wage scale.
Several issues relating to labour market policies are discussed in the report. These issues refer to the size of unemployment benefits and the effectiveness of active labour market policies. The latter is impaired by problems such as the absence of an integrated and clearly-defined national policy with regard to the unemployed and especially the long-term unemployed, the lack of coordination among the various governmental depart-ments, organisations and agencies, the discontinuity in policy making and application, caused mainly by the "reshuffling" of directors and of high-level officials, not only after governmental changes but even every time a new minister comes into office, the low level of expertise among some of the people involved in the implementation of programmes, the staffing problems of the Ministry of Labour and of the related public organisations, the lack of evaluation arrangements and mechanisms, etc.
continuously increasing size of the "hidden" economy is an issue of deep concern in the country.
During the last year there has been extensive discussion about the reduction of working time. Labour unions are demanding such a reduction without a corresponding cut in pay. Employers' associations do not have serious objections to fewer hours of work but only if this is accompanied with an equivalent wage decrease. A proposal for the possibility of re-arranging the time of work within a year without changing the total number of hours is under consideration.
Finally, the issue of reforming tertiary education, improving its links with enterprises and abolishing the monopoly of public institutions has been discussed for many years but due to the unwillingness of the Government and of the authorities of tertiary-education institutions to cause unrest among students or displease the teaching staff, no major reforms have been implemented.
It should be noted that the Government that was formed after the elections of September 1996, seems determined to proceed fast with the application of the measures and policies envisioned in the new law on employment. According to plans, in 1997 about 50,000 new jobs for the young and the long-term unemployed will be subsidised by up to 75% of the wage of the newly employed. It has been announced that within a short time the Ministerial Decisions for the application of the new law are expected to be issued and the implementation of the new policies and measures will start immediately after that.
LABOUR MARKET ANALYSIS AND FORECASTS
1.1 DEMOGRAPHIC TRENDS
1.1.1 Population trends
According to the Greek Labour Force Survey, in 1995 Greece's population was 10,238,000. Almost two-thirds of it was living in urban areas and more than one-third was concentrated in the Athens area (Table 1, Figure 1). Despite the exodus of people from the rural areas in recent years, more than one fifth of the population still continues to live there.
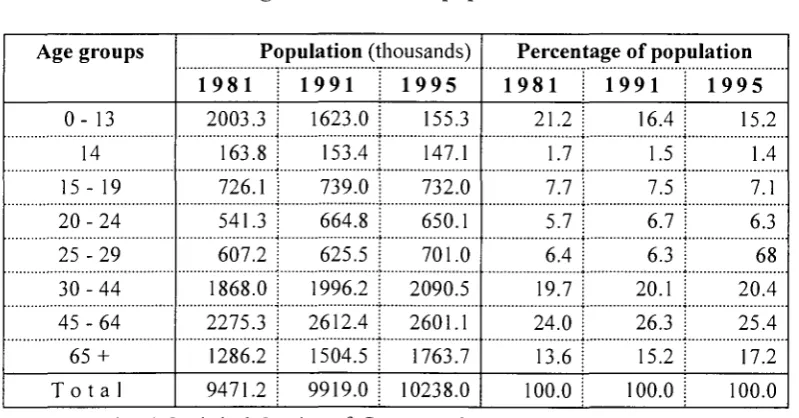
Comparing the age structure of the population in 1995 with that in 1991 and 1981, the ageing population phenomenon can easily be observed (Table 2). The population share of all age groups under 25 has shrunk. In fact, during 1991-1995 even the absolute size of all age groups under 25 has fallen. Moreover, the phenomenon has affected all regions. With only the exception of the age group 14-18 in the "other" urban areas (urban areas except Athens and Thessaloniki), the population share of all age groups under 25 in all regional divisions has fallen. On the other hand, the share of the population aged 65 and over increased in the country as a whole and in all regional divisions
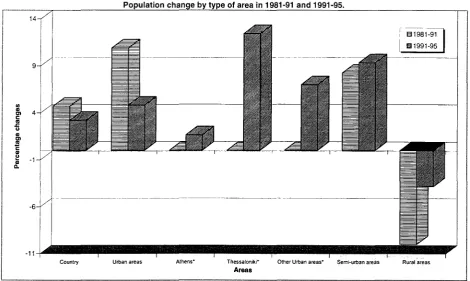
The total population of the country increased by 4.7% during 1981-1991 and by 3.2% during 1991-95. In the period 1981-1991 population growth was stronger in the urban areas, while in 1991-1995 the growth rate in the semi-urban areas was about double that in the urban areas. In the rural areas there was substantial population decline in both
1981-91 and 1991-95 (Table 3, Figure 2).
Looking at the growth rates of the various age groups we observe again the ageing population phenomenon. The rates of growth of the age group below 25 were negative in both 1981-91 and 1991-95 while those of the group 65 and over were respectively three and a half and five times larger than the average for the population in the above two periods (Table 3, Figure 3).
Because of the fall in the birth rate, below the minimum required for population replace-ment, the population is expected to start declining at some time after the year 2000, even with a moderate pickup in birth rates and a continuation of immigration trends.
1.1.2 Recent changes in the size and age structure of the labour force; projections
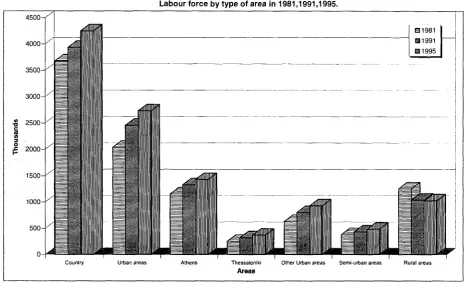
During the periods 1981-1991 and 1991-1995 the labour force grew at a rate much faster than that of the population. The labour force growth was concentrated in the urban and semi-urban areas (Table 4, Figures 4 and 5). In 1981-1991 the labour force growth was much stronger in the urban areas, while in 1991-95 in the semi-urban areas it surpassed that in urban areas. In the rural areas, during 1981-1991, the labour force declined drastically, much more than the population, while in 1991-1995 the decrease was slight and smaller than that of the population.
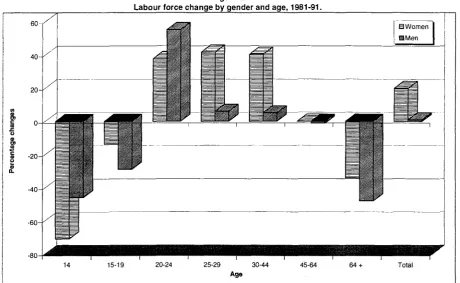
Most of the labour force growth was due to the growth of the female labour force, which in the periods 1981-1991 and 1991-95 increased by 19.9 and 15.2 percent respectively, compared to 0.9 and 4.0 percent for men (Table 5, Figures 6 and 7). Among all females, married females' labour force growth was weaker (14.9%). This has occured despite the fact that labour force participation rose more among married females and is due to the fact that married females now make up a somewhat smaller proportion of all females than what was the case four years earlier.
In the period 1991-1995 the educational structure of the labour force improved, particularly in the case of women (Table 6). In the same period the labour force below 25 years of age decreased more than the corresponding population group and this could be explained by the increase in the rate of unemployment, the availability of more opportunities for training and an increase in the desire of young people to get more education.
Despite the decline in the natural rate of population growth, the labour force is likely to increase in the near future because of immigration, the further increase in women's participation rates, the tightening of retirement conditions and the greater participation of younger people, if employment opportunties improve.
We made an estimate of labour force growth in the next four years on the basis of the following assumptions: First, the male and female population aged 14 to 64 will increase in the period 19951999 by only two thirds of their increase in the period 1991 -1995, which was 1.27% for males and 2.54% for females. Second, the labour force participation rate of males will stabilize at its 1995 levels (77.6%), while that of females will increase by no more than the increase in the 1991-1995 period (4.9%) and no less than two thirds that amount. On the basis of these hypotheses our forecast of labour force increase ranges from 4.02% to 5.44%.
1.1.3 Migration trends
During the 1980s the emigration of Greeks was limited while many Greeks who had emigrated in previous years started returning to the country. Also, a large number of Greeks who had fled to countries of the communist block during the Greek civil war, started returning to their homeland, following a favourable change in legislation. After the fall of the communist regimes in 1989, a large number of people of Greek origin, who lived in formerly communist countries, particularly in the Soviet Union and Albania, immigrated to Greece. At the same time there was an influx of illegal
-immigrants mainly from Albania but also from Bulgaria, Romania and Poland. Moreover, a large number of illegal immigrants from Iraq, Iran, Syria, Pakistan etc. kept coming to the country through Turkey. There is no official information about the number of illegal immigrants presently in Greece. According to unofficial estimates, it may be up to 400,000 to 500,000 persons, which corresponds to approximately 4 to 5 percent of Greece's population (OECD, 1996).
1.2 STRUCTURE OF THE WORK FORCE
1.2.1 Employment
Employment in Greece is characterised by certain tendencies, usually observed in less developed economies. The most striking are the following:
a. Relatively high percentage of people employed in agriculture.
b. Relatively high percentage of self-employment (about half of employed persons) and relatively low percentage in the total labour force of people with dependent employment.
c. Relatively high percentage of employees working in the public sector (about one third of all employees)
d. Relatively large size of activity in the "hidden" economy e. Relatively low labour force participation rates of women.
Because of the above characteristics it is difficult to have an accurate picture of employment and unemployment in the country. Changes in the supply and demand for labour affect self-employment, disguised unemployment, underemployment, multi-job holding and employment in the "hidden" economy, and may have relatively small effects on the official employment and unemployment figures.
Labour force participation and trends
Labour force participation in Greece continues to lag behind that of many other EU countries, for both men and women.
In 1981-1991 the overall participation rate of the working-age population remained almost unchanged since the decrease in men's participation rates were offset by an equivalent increase in women's rates. In 1991-1995 there was an upward trend in the size of the working-age population (15-64), combined with an increase in the participation rate, which reached 60.8% in 1995 compared to 57.6% in 1991. The main reasons for this increase were the rising participation rate of women (it reached 45.1% in 1995 compared to 40.2% in 1991) (Figure 8) and the tightening of the retirement conditions. Contrary to the experience in many other countries, male labour force participation has been inching up, having reached 77.6% in 1995 compared to 76% four years earlier.
schooling - while for all other age groups it increased (Table 7, Figure 9). In both 1995 and 1991 the participation rate for male workers peaked at the 30-44 age range while women's rates peaked at the 25-29 age range.
The participation rate of female workers in the age group 30-44 is lower compared to that of age group 25-29. This is due to the child-raising responsibilities of women, as well as to different labour market behavioural patterns of the older age groups. This latter effect is probably the dominant reason for the lower participation rates of those 45-64 years old.
The level and the evolution of participation rates of married females do not differ substantially from those of all females. The only differences appear in the married females' participation rates which peak in the 30-44 age range and in the rates of married females in the 15-19 age range, which increased between 1991 and 1995 (32.4% in 1995 compared to 27.1% in 1991), contrary to what happened in the case of men and unmarried women in this age bracket. It should be noted that the 15-19 age range was the only one where participation rates were higher for married females than for all females.
Generally, we observe a positive relationship between levels of education and participation rates, with the only exceptions being firstly, those with a degree from a technical/ professional school, who have higher participation rates than those with a university degree and, secondly, those with six years of schooling, who have higher participation rates than those with nine years of schooling. This positive relationship between levels of education and participation rate is much more pronounced in the case of females compared to males.
The participation rates were highest in the rural areas (72.7% in 1995, 68.2% in 1991) and lowest in the urban areas (57.7% in 1995, 54.3% in 1991), with those in the semi-urban areas in-between (62.9% in 1995, 59.2% in 1991). Among the semi-urban areas, the Athens area had the highest participation rate (58.1% in 1995, 54.6% in 1991) and the Thessaloniki area the lowest (55.4% in 1995, 52.9% in 1991), while the "other" urban areas were in-between. The participation rate age profile was much flatter in the rural areas than elsewhere. In rural and semi-urban areas the male participation rate peaked at the 25-29 age range while in the urban areas it peaked at the 30-44 age range. This difference is probably due to the fact that the facilities for tertiary education, which results in a delayed entry into the labour force, are concentrated in urban areas.
In semi-urban and rural areas female participation rates were much higher compared to urban areas. In the former areas the participation rates for married females were higher compared to all females. This phenomenon and the higher female participation rates are due to the importance of the primary sector where the share of women workers is relatively high.
-Industrial, occupational, age, qualification and gender structure of employment and trends
The service sector has the largest share in total employment and its importance keeps increasing (Tables 8, 9 and Figures 10, 11 and 12). In 1995, the primary sector's employment share was 20.5%, down from 30.7% in 1981 and 22.2% in 1991. The employment share of the secondary sector also shrank in the same period. Of all sectors comprising the secondary sector, only electricity, gas and water had a slight rise in its employment share.' The employment shares of manufacturing, mining and construction fell.
During both periods, 1981-1991 and 1991-1995, there were substantial increases in employment in the service sectors (Tables 8, 9 and Figures 10, 11, 12). However, a large part of these increases can be attributed to an expansion in the number of people employed in public administration and in enterprises and organisations controlled by the public sector.
Most service subdivisions showed an increase in their shares in total employment. Transportation and communication was an exception, since its share fell. Retail and wholesale trade and tourism showed a remarkable increase in their share. Particularly important was the rise in the employment share of the finance, insurance and real estate sector and also of the "other services" (of the latter 7.1% is public administration, 5.8% education and 4.3% health services).
The share of women's employment in total employment rose to 35.9% in 1995, from 31.4% in 1981 and 33.7% in 1991. This rise came mainly from the relatively large increases of women's employment in the tertiary sector where, in 1995, about 62% of women were employed (Table 10).
Male employment was dominant in construction, mining, transportation and commu-nications and electricity, gas and water. Manufacturing and retail and wholesale trade and tourism (with trade's share being higher), followed. Finance, insurance and real estate, the primary sector and the "other services" sector had the lowest male employment share. Within the latter sector there was considerable variation with a male employment share in public administration of 67.4%, in education of 38.3% and in health services of 36.6%.
As far as the age structure of employment is concerned, we observe that in 1995 the largest share of employed workers for both men and women belonged to the age group 30-44, with the age group 45-64 following close behind (Table 11). In 1991-1995 there was a decrease in the employment of persons below 24 and a large increase in the employment of those above 65 (Table 11, Figure 13). The differences in the age profile of male employed workers between 1991 and 1995 were not significant. There was a small drop in the percentage of workers in the age groups below 24 and a small rise of
1 This sector is dominated by large public enterprises which increased their personnel as a result of
those 30-44 and 65 and over (Figure 14). With regard to women there was a larger drop in the percentage of workers below 24 and also a larger increase in the percentage of those in the age group 30-44, compared to men (Figure 15). Looking at the age profiles of male and female employed workers we notice that the share in the age groups 45-64 and 65 and over were much lower for females, probably due to the different behavioural patterns of older age groups for which labour force participation is smaller compared to younger groups. It is worth noting that this difference in the age profile was not attenuated between 1991 and 1995.
There are some significant differences in the age profiles of employed workers across sectors. Most characteristically, in the primary sector, we observe higher than average share for workers under 20 and in the age brackets of 45-64 and 65 and over. In fact, in this sector, almost two thirds of workers are above 45. On the other hand, in most service sectors the share of employed workers in the 30-44 age bracket was above average (Table 12).
It is worth noting the higher than average share of employed workers in the 25-29 age bracket, observed in most service sectors, most notably in finance, insurance and real estate (17.1%) and education (17.2%) (Table 12). In the first of these two sectors, the expansion was probably due to the significant growth of the sector in recent years that went in line with its modernization, creating needs for new employees with new skills and qualifications, most likely to be found among recent graduates and thus relatively young people.
With regard to sectoral variation in educational qualifications, the sectors with the highest shares of employed persons in the top two educational achievement categories were finance, insurance and real estate, and the "other services" (Table 13). These sectors had also the largest shares of persons with post-graduate education. The share of university graduates among those employed in finance, insurance and real estate was 41% and in the "other services" sector was 36.3% (within which, 76.6% was in education), while the shares of these sectors in total employment were much smaller.
The primary sector is characterized by a workforce with the lowest educational achievement (87.1% of employed workers had at most completed elementary education while the average was 43.5%). Also, following with poor records were construction and mining (Table 13). In view of its modernization and restructuring needs, manufa-cturing's mediocre record (44.6% of employed workers had at most completed elementary education) also should be mentioned. Nevertheless, the fact that fairly significant progress has been achieved compared to just four years earlier constitutes a positive development: In 1991 49.2% of employed workers in all sectors had at most completed elementary education, and the corresponding proportions in the aforementioned sectors were: primary sector 89%, construction 70.9%, mining 66.8% and manufacturing 50%.
share of blue collar workers was 30.3%. Because of changes in definitions, it is difficult to make comparisons between the structures in 1995 and 1991. However, on the whole, it seems that there was an increase in the shares of occupations with more qualifications. There was significant variation in occupational shares and in their growth across sectors.
The employment shares of male workers were higher in the relatively more skilled occupations. This was particularly true in the case of blue-collar occupations. Since 1981, there has been an increase in women's participation in scientific and professional occupations and a general improvement in the occupational structure of their employment.
Gender and regional growth of employment and trends
Although employment in Greece in the period 1991-1995 increased by 5.3%, male employment grew by only 1.9%, while female employment grew by a robust 11.9%. Also, there was significant variation in employment growth by type of region: In urban areas employment increased by 8.0% and in semi-urban areas by 8.9%, while in rural areas it decreased by 2.3%. The variation in employment growth among the three urban area subdivisions was also considerable. In all areas women's employment increased much more than men's (Table 15, Figures 16 and 17).
The regional variation in employment growth in the periods 1981-1991 and 1991-1995 has affected the shares of various areas in total employment. Both urban and semi-urban areas increased their shares at the expense of the rural areas whose share fell. Between 1991 and 1995 the employment share of the Athens area remained the same, that of the Thessaloniki area increased slightly while there was a relatively large increase in the share of the "other urban" areas (Table 16).
Substantial differences were observed with respect to the sectoral distribution of employment across types of areas (Table 17). The secondary and tertiary sectors were concentrated mainly in the urban areas with about half of their total employment being in the Athens and Thessaloniki areas. Between 1991 and 1995 there were no significant changes in the sectoral distribution of employment across different types of areas.
Also, there were substantial differences in the rates of growth of employment in the 13 regions of the country. In the period 1991-1995 three regions had negative rates of growth and five other regions had rates of growth that were below the national rate (Table 16).
Part-time employment, short-term contracts and hours of work
The institutionalisation of part-time work and the introduction of the possibility for firms to use a fourth shift were two major reforms in the early 1990s that increased the flexibility of working time. Until then the firms had to pay for part-time workers contributions equivalent to those for full-time workers and this discouraged them from using this type of employment.
With the new legislation the contributions became proportional to earnings on the provision that these earnings could not be lower than 30% of the minimum wage. Part-time workers were given rights for a minimum pension, unemployment benefits and severance compensation.
Despite the above favourable legislation the popularity of part-time work has not increased. Most part-time workers hold such jobs because they cannot find full-time work. On the whole, part-time employment does not seem to appeal to Greek men or women. There are several reasons for this. Besides the fact that people are not used to this kind of employment, salaries and wages in the country are relatively low and the income that one can get from such an employment is relatively small. Women have to supplement family income and, since in most cases this is relatively low, they try to earn as much as possible. Moreover, most activities are concentrated in certain parts of the urban areas and due to congestion and the poor public transportation system the time and the cost required for going to and returning from work make the undertaking for work of only a few hours per day not worthwhile.
On the part of employers, recruiting of personnel is not as easy as in the case of countries where private employment agencies exist. For this reason, when they incur the costs of recruiting they prefer full-time instead of part-time personnel.
There are serious restrictions to overtime work, particularly in the case of industrial firms. A maximum of one hour per day and 8 hours per week with a limit of 15 hours for a six-month period for each worker is allowed in such firms. The limit for commercial enterprises is 60 hours per six-month period. The payment for overtime work is 25% higher them the usual rate and in excess of the cumulative limit is 100%.' It is difficult to know to what extent the above limits are adhered to since their enforcement, particularly in the case of small firms, is particularly difficult.
In 1995, about 69.3% of employed workers worked on average for at least 40 hours per week. Most of them (37.8%) worked between 40-47 hours. The situation is not substantialy different compared to four years earlier. During the period 1991-1995 there was a small fall in the percentage of employed workers working on average 35-39 hours per week and a small increase in the percentage of those working under 35 hours per week, but the changes were not significant (Table 18).
There are certain differences with regard to average working hours between male and female employed workers. The percentage of employed workers working in the 40-47 hours per week range does not differ significantly between the two groups. However,
1 Surpassing the cumulative limit is illegal under the civil law but not under the penal code.
females were much less likely than males to work 48 or more hours per week on average. On the other hand larger proportions of females worked under 40 hours per week, particularly under 35 hours per week. In 1995 28.5% of females and 15% of males worked less than 35 hours per week, while only 15.3% of females and 7.2% of males worked less than 24 hours per week. The proportion of workers who worked less than 25 hours per week on average has increased only slightly for both males and females between 1991 and 1995.
There has been extensive variation in the average hours of work in various sectors of economic activity (Table 19). However, no significant changes occurred between 1991 and 1995. In both years the largest percentages of people working on average less than 25 hours per week were in the primary sector and in "other services" which includes education, health etc. In the sector of trade, hotels, restaurants etc., which is a major source of part time work in other countries, less than 4% of its employment was for less that 24 hours per week.
Considerable variation appears in the average hours of work among employers, the self-employed, salary and wage workers and helpers in family enterprises. About 61.9% of employers, 53.7% of the self-employed, 40.8% of helpers in a family enterprise and only 15% of salary and wage earners work on average 48 hours per week or more. On the other hand relatively few employers and self-employed people work less than 35 hours per week on average. Most salary and wage earners work 40 hours per week.
Although multiple job holding is quite common in the country, probably due to non-reporting only 2.5% of the employed persons in 1991 and 3.7% in 1995 were recorded as having more than one job.
The introduction of a fourth shift allowed a number of firms to add a shift and resulted in the increase in the average hours of work in Greek industry from 64 in 1989 to 88 in 1994. Over that period the industrial firms operating in shifts increased from 52 to 86 per cent of their total number (OECD, 1996).
Employment on fixed-term contracts has been quite common in Greece. It is estimated that it constitutes about 18% of all salaried employment. Fixed term contracts can be renewed only twice. After that, the employment becomes regular.
Fixed term contracts have been used extensively in the public sector in response to seasonal labour requirements or for recruiting personnel without having to adhere to the civil service recruitment procedures and restrictions.
Self employment and employment in family enterprises