This is a repository copy of
Multi-level nonlinear modeling verification scheme of RC
high-rise wall buildings
.
White Rose Research Online URL for this paper:
http://eprints.whiterose.ac.uk/110631/
Version: Accepted Version
Article:
Alwaeli, W., Mwafy, A., Pilakoutas, K. orcid.org/0000-0001-6672-7665 et al. (1 more
author) (2017) Multi-level nonlinear modeling verification scheme of RC high-rise wall
buildings. Bulletin of Earthquake Engineering, 15 (5). pp. 2035-2053. ISSN 1570-761X
https://doi.org/10.1007/s10518-016-0056-8
[email protected] https://eprints.whiterose.ac.uk/ Reuse
Unless indicated otherwise, fulltext items are protected by copyright with all rights reserved. The copyright exception in section 29 of the Copyright, Designs and Patents Act 1988 allows the making of a single copy solely for the purpose of non-commercial research or private study within the limits of fair dealing. The publisher or other rights-holder may allow further reproduction and re-use of this version - refer to the White Rose Research Online record for this item. Where records identify the publisher as the copyright holder, users can verify any specific terms of use on the publisher’s website.
Takedown
If you consider content in White Rose Research Online to be in breach of UK law, please notify us by
Multi
-
level nonlinear modeling verification scheme of RC high
-
rise
wall buildings
Wael Alwaeli . Aman Mwafy . Kypros Pilakoutas . Maurizio Guadagnini
Abstract
Earthquake-resistant reinforced concrete (RC) high-rise wall buildings are designed and detailed to respondwell beyond the elastic range under the expected earthquake ground motions. However, despite their considerable
section depth, in terms of analysis, RC walls are still often treated as linear elements, ignoring the effect of deformation
compatibility. Due to the limited number of available comprehensive experimental studies on RC structural wall
systems subjected to cycling loading, few in-depth analytical verification studies have been conducted. Motivated by
the increasing need for more accurate seismic risk assessment of high-rise buildings in multi-scenario seismic regions, a
Multi-Level Nonlinear Modelling Verification Scheme is presented in this paper to investigate two different nonlinear
modeling techniques for shear walls (2- and 4-noded fiber-based elements). The investigated modeling approaches and
their key parameters are verified against the results of Phase I of uniaxial shaking table specimen tests (performed at the
University of California, San Diego) on a seven-story full-scale RC shear wall structure under base excitations
representing four earthquake records of increasing intensities. Three numerical models are created using two different
tools (ZEUS-NL and PERFORM-3D). The results obtained from the numerical models are compared with the
experimental results both on global and local response levels (top displacement, interstory drift, story shear force, story
bending moment, period elongation and rebar tensile strain). The study reveals the superior performance of 4-noded
fiber-based wall/shell element modeling approach in accounting for the 3D effects of deformation compatibility
between lateral and gravity-force-resisting systems. The study also highlights the sensitivity of attained results to the
stiffnesses assigned to the rigid links and 3D joints required to connect the shear walls to neighboring elements when a
2-noded element is used.
Keywords
Seismic response . Shear walls . High-rise buildings . Shake table testing . Nonlinear modelingW. Alwaeli . K. Pilakoutas . M. Guadagnini
The University of Sheffield, Sir Frederick Mappin Building, Mappin Street, Sheffield, S1 3JD, UK
A. Mwafy ()
1
Introduction
With increasing concern for the seismic performance of multi-story RC buildings following extensive damages caused
by recent strong earthquakes (Kobe 1995; Kocaeli, 1999; Chi-Chi, 1999; Tohoku, 2011), the effectiveness of RC shear
walls in medium- to high-rise buildings in earthquake-prone regions needs to be assessed. Shear walls can be found
either as single elements coupled with moment-resisting frames or in the form of L, T, U-shaped or tubular
cross-sections. Based on modern seismic codes, earthquake-resistant buildings are designed and detailed to respond
inelastically under the design and maximum considered earthquakes. In RC high-rise buildings, well designed and
proportioned RC slender shear walls can provide the needed strength, stiffness, and deformation ductility to ensure the
adequate performance of the structure in the “service”, “damage” and “ultimate limit” states. Nonetheless, for
simplicity, RC shear walls are often modeled as linear elements during the analysis, despite their considerably large
depth (ATC 2010; PEER 2010). This can lead to considerable underestimation of the deformed shape and compatibility
issues between shear and flexural lateral resisting mechanisms, as well as, of the local high deformation demand.
Furthermore, due to high costs and lack of availability of large-scale testing facilities, there are few reliable and
comprehensive studies on the cyclic behavior of RC wall buildings that can be used for verification purposes (Beyer et
al. 2008; Ji et al. 2007; Wallace 2007; Wallace and Moehle 2012). Hence, there is still a need for a reliable nonlinear
modeling methodology of building response which is essential for assessing the seismic vulnerability and estimating the
seismic risk of such structures (ATC 2010; Ji et al. 2007; Martinelli and Filippou 2009).
Nonlinear Response History Analysis (NRHA) is the most reliable tool currently available for predicting building
response at different levels of ground motion intensity. In NRHA, the accuracy of the nonlinear model is measured by
its sufficiency in capturing significant modes of deformation and deterioration in the analyzed structure from the onset
of damage to collapse. Various aspects of nonlinear modeling, such as element discretization, material
force-deformation relationships, and assumptions on modeling of viscous damping are essential in defining the level of model
accuracy in predicting the global and local seismic response of a structure. Very sophisticated wall microscopic models
(i.e. continuum FE models) have the ability to provide a refined and detailed definition of the local response with a high
level of flexibility and accuracy. However, the time requirement for computer run, post-processing, and interpretation of
the numerical results render these models forbiddingly expensive for the seismic vulnerability assessment of high-rise
structures especially when Multi-Record Incremental Dynamic Analysis (MRIDA) techniques are adopted.
Alternatively, the macroscopic fiber-based element modeling approach is commonly used for RC shear walls (e.g.
Wallace 2007; Wallace 2012). Using this approach provides a proper description of wall geometry, detailing of steel
reinforcing bars and material behavior. It accounts for key response features such as relocation (shifting) of the neutral
the structure connecting the walls such as gravity frames and coupling beams (both in and out of the plane of the wall).
It also considers the impact of variation of axial load on wall flexural strength and stiffness. Given that experimental
data of RC structural wall systems subjected to cycling load are very limited as most tests conducted are on isolated
wall elements, few in-depth analytical verification attempts have been conducted for such systems. Therefore, it is
essential to verify the nonlinear modeling techniques and parameters to be used with RC wall buildings against
full-scale, shake-table tested RC wall structures.
The aim of the present study is to arrive at a verifiable nonlinear modeling approach and key modeling parameters
that can be adopted in assessing the seismic performance of RC high-rise wall buildings. This is achieved by simulating
the nonlinear dynamic response of a shake table full-scale seven-story RC wall building slice within a Multi-Level
Nonlinear Modelling Verification Scheme (MLNMVS). This building was tested under base excitations representing
four earthquake records of increasing intensities on the Large High-Performance Outdoor Shake Table (LHPOST) at
University of California, San Diego (UCSD) (Panagiotou et al. 2007a; Panagiotou et al. 2007b; Panagiotou et al. 2011).
To model the shear walls in the tested structure, two fiber-based modelling approaches are investigated: (i) 2-noded
beam-column line element (also termed wide-column element), where an equivalent column at the wall centroidal axis
with wide cross section is used to model the property of the wall; and (ii) 4-noded wall element, a modelling approach
conceptually similar to the Multiple-Vertical-Line-Element model (Wallace 2007; Wallace 2010). ZEUS-NL analysis
tool (Elnashai et al. 2012) is utilized to implement the first modeling approach, while PERFORM-3D (CSI 2011) is
chosen to investigate the second.
A brief description of the USCD shake table test program and the test structure are given in Sections 2 of this paper.
In Section 3, the four input ground motions used in the tests are discussed. The numerical models created in the current
study along with the comparison of their results to the experimental data are detailed in Section 4. The paper concludes
with a summary of the work, findings, and modeling recommendations (Section 5).
2
Description of the test structure
The test program was performed on the LHPOST at UCSD as part of the George E. Brown Jr. Network for Earthquake
Engineering Simulation (NEES) program. The tests were conducted in two phases: Phase I: Rectangular Wall
(Panagiotou et al. 2007a; Panagiotou et al. 2011); and Phase II: T-Wall (Panagiotou et al. 2007b). In the current work,
selected test results from Phase I (interstory drifts, story displacements, story shears, story moments, period elongation
and local strains) are used to verify the numerical results obtained from the conducted MLNMVS.
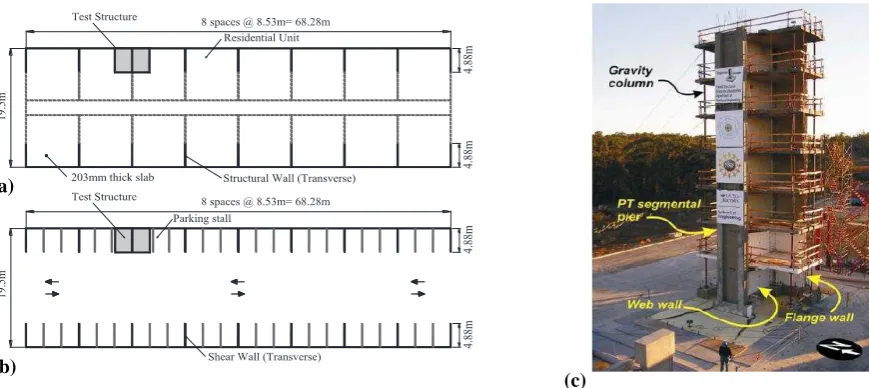
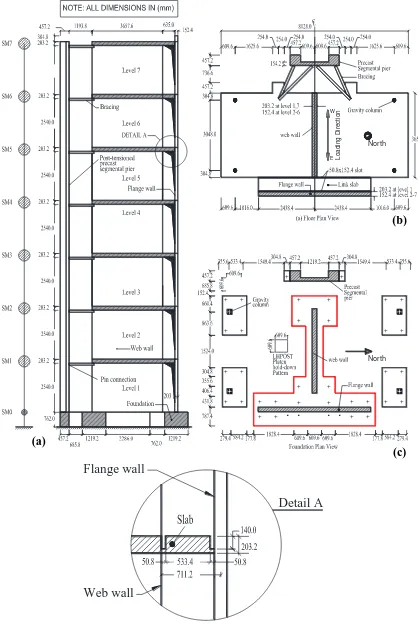
The test structure is a representative slice of a 7-story prototype residential load bearing wall building located in Los
direction), hereafter referred to as “web wall”, a 4.88m long load bearing RC rectangular wall directed North-South,
hereafter referred to as “flange wall”, an auxiliary C-shaped precast segmental pier with unbonded post-tensioning,
hereafter referred to as “precast pier”, and four auxiliary pin-ended gravity columns at the north and south ends of the
test structure. The web wall alongside the gravity columns provide support to seven, 200mm thick, 3.65m x 8.13m
simply supported RC slabs spaced at 2.74m (story height). The precast pier was designed to have pin-pin connections
with the floor slab. This was accomplished by using horizontal steel truss (angles) bolted to the floor slab at one end and
to the precast pier at the other. The bolted connections combined with the limited moment capacity of the steel angles
prevented the transfer of moment from the floor slab to the precast pier.
During Phase I of the test program, web and flange walls were linked with a 610mm wide slab. The link slab had
two, 140mm deep by 51mm wide, slots on both ends. The near-pinned link was designed to guarantee diaphragm action
in the longitudinal and transverse directions but a reduced capacity for moment transfer and coupling between the
flange and web walls. In this area, overlapping transverse reinforcing bars from the web and flange walls were provided
to account for the future establishment of monolithic connection during Phase II. Furthermore, a vertical gap of 635mm
width between the web and the flange walls was left to avoid shear transfer between the two walls. This arrangement
allowed the flange wall to provide stability only in the longitudinal direction (North-South), while the web wall
primarily provided lateral force resistance in the earthquake loading direction. During Phase II of the test, the 635mm
vertical gap was cast to ensure a T-section wall monolithic behavior. The web and flange walls were fixed at the base,
while the precast pier connection to the shake table was designed to allow rocking the loading direction (pin
connection) while providing large moment resistance in the orthogonal direction (fix connection). The precast pier with
its foundation, the horizontal steel truss, and the link slab, as a system, provided the torsional stability for the entire test
structure, including the flange wall. Therefore, rotational strains at the flange wall ends were not needed. It is worth
emphasizing that during both test phases, the earthquake excitations (loading) were applied only in the web wall
direction (East-West).
The four pin-ended gravity columns were made of high-strength, prestressed steel threaded Dywidag bars, 44.5mm
in diameter for the first story and 25.4mm in diameter for the above stories. The Dywidag bars were grouted inside
high-strength, 102mm diameter, 8.6mm thick steel pipes to prevent them from buckling. These bars formed the
columns’ end pin-connections with the RC slabs and the foundation, enabling the columns to carry axial tension and
compression only and not to contribute to lateral force resistance. The test structure height, starting from the top of the
foundation, was 19.20m with total mass (excluding the foundation) of around 210tons.
Concrete with a target 27.6MPa specified compressive strength and Grade 60 steel reinforcement were used in the
test structure. The measured average concrete compressive strength at the day of the final test was 37.9MPa, while the
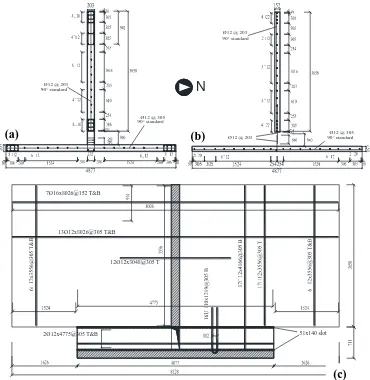
longitudinally prestressed and designed to remain elastic during testing. Figure 1 shows floor plans of the prototype
building with a perspective view of the test structure, while the geometry of the test structure and the reinforcement
details for the web wall, flange wall, and slabs are given in Figs. 2 and 3, respectively. More details about the test
structure can be found in Panagiotou et al. (2007a; 2011).
3
Input ground motions
Phase I of the test program investigated the response of the cantilever web wall to four levels of excitations with
increased intensities (EQ1-EQ4) representing four historical earthquakes recorded in Southern California. Prior to and
between the earthquake tests, the structure was subjected to long-duration ambient vibration tests and long-duration
low-amplitude white noise tests for system damage identification (Moaveni et al. 2010). The low-intensity input motion
EQ1 was the VNUY longitudinal component from the 1971 Mw 6.6 San Fernando earthquake. The two medium
intensity input motions EQ2 and EQ3 were the VNUY transverse component record from the 1971 Mw 6.6 San
Fernando earthquake and the WHOX longitudinal component from the 1994 Mw 6.7 Northridge earthquake,
respectively. The large intensity input motion EQ4 was the Sylmar Olive View Med 360o component record from the
1994 Mw 6.7 Northridge earthquake. Figure 4 shows the acceleration time histories alongside the acceleration and
displacement response spectra of the four input motions while Table 1 lists the peak recorded values of selected
response parameters for the test structure (Panagiotou et al. 2011).
4
Multi-level modeling verification scheme
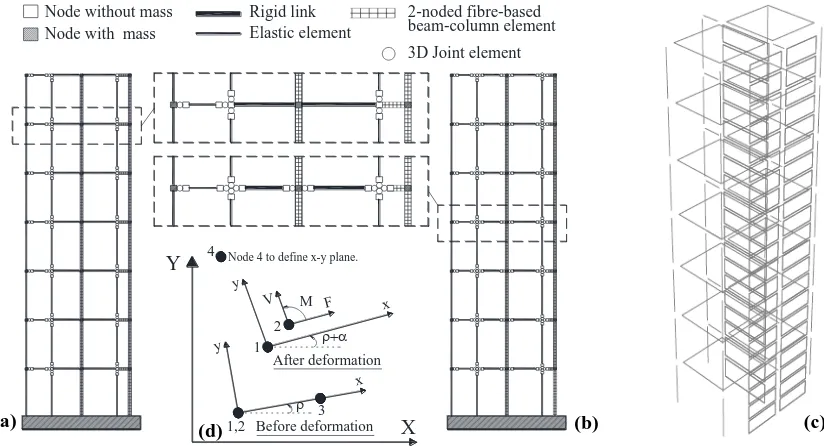
Three numerical models are developed for the present study. ZEUS-NL (Elnashai et al. 2012) is utilized to develop the
first two: “Z-Model”; a two-dimensional (2D) nonlinear model using 2-noded fiber-based frame element modeling
approach in modeling the RC walls, and “IZ-Model”; an improved 2D nonlinear model using the same aforementioned
approach. PERFORM-3D (CSI 2011) is utilized to develop the third model “P-Model”; a three-dimensional (3D)
nonlinear model using 4-noded fiber-based wall modeling approach. Modeling key features and the multi-level
verification results for each of the three developed numerical models are given in the following sub-sections. Figure 5
shows schematic diagrams of the three models.
4.1
Modeling and verification using 2D, 2-noded fiber-based frame element modeling approach:
Z-Model
The 2D (in the plane of excitations) model for the test structure is developed using ZEUS-NL (Fig. 5a). The centerline
connecting the segmental pier to the structure. 2-noded fiber-based cubic elasto-plastic elements are used to model the
response of web and flange walls as well as the slotted slab connecting them. Elastic frame elements are used to model
the prestressed segmental pier, the gravity columns, and the braces. Rigid links are utilized to connect the web wall
centerline to the gravity column elements at both wall ends. A 3D joint element characterized by linear elastic behavior
is used to simulate the pin-pin connection of gravity columns, braces and the East-West hinge connection between the
segmental prestressed pier and its footing. The 3D joint element can be used in 2D and 3D modeling to model pin
joints, inclined supports, structural gaps, soil-structure interaction and elasto-plastic joint behavior. To define a 3D joint
element, four nodes are required. Nodes 1 and 2 are the end nodes of the element and must be initially coincident; node
3 defines the x-axis of the joint, while the fourth node defines the x-y plane (Fig. 5d). Each of nodes 1 and 2 has
6-degrees of freedom where for each; three different types of force-deformation relationships (linear elastic,
bilinear/trilinear symmetric elasto-plastic and bilinear/trilinear asymmetric elasto-plastic) can be assigned to represent
axial, shear and bending cyclic behavior. Any degree of freedom in nodes 1 and 2 can be restrained by assigning a
linear force-deformation relation with a very high stiffness value to it. The seismic mass of the test structure is lumped
at floor levels to simplify the numerical model. The weight of the structure is also applied as nodal loads to account for
gravity and P-∆ effects during NRHA.
The uniaxial nonlinear constant confinement constitutive model of Mander et al. (1988) with improved cyclic rules
proposed by Martínez-Rueda and Elnashai (1997) is used to calculate the properties of confined concrete which are
assigned to the corresponding fibers in the web and flange walls cross-sections at the first story (Fig. 6a). The concrete
in the upper stories had no confinement reinforcement and thus modeled using unconfined concrete fibers. In both
cases, the tensile strength of concrete is neglected. The force-deformation behavior of the steel reinforcing bars in the
test structure (Fig. 6b) is idealized using the uniaxial steel model of Menegotto and Pinto (1973) coupled with the
isotropic hardening rules proposed by Filippou et al. (1983). In Fig. 6b, Eo is the initial elastic modulus of steel, E1 is the
strain-hardening modulus, Ro is a parameter defining the initial loading curvature, and a1 to a4 are experimental-based
parameters that control the curvature and isotropic strain hardening in subsequent load cycles, taken as 20, 18.5, 0.15,
0.01 and 7, respectively (Elnashai et al. 2012).
Previous studies indicated that shear deformation may have a significant contribution to the lateral displacement of
walls especially at lower stories, even in walls that are categorized as flexure-dominated (Thomsen and Wallace 1995).
In ZEUS-NL, the fibers in the cubic elasto-plastic element used to model the web wall have zero resistance to
transverse forces, and hence shear deformation cannot be determined at the section level. It can be, however, explicitly
modeled by introducing shear springs to the wall element. Justified by the fact that the experimental results for the test
structure evidenced almost exclusively flexural cracking at the web wall base (Martinelli and Filippou 2009; Panagiotou
ZEUS-NL includes Rayleigh damping as the only option to account for the effects of the viscous damping during
dynamic analysis. The mathematical model of Rayleigh damping in this package is based on initial stiffness in
calculating the damping matrix. When the use of tangent stiffness-proportional damping is not an available option,
previous studies recommended lowering the first mode initial stiffness-proportional damping value (e.g. Hall 2006;
Smyrou et al. 2011). The use of the mass-proportional damping term in the damping matrix is discouraged by several
researchers. For an instant, Priestley and Grant (2005) showed that including the mass-proportional term in the damping
equation can heavily weight the mass matrix, leading to a nearly constant damping matrix during the post-elastic
response of the structure regardless of stiffness degradation. Hall (2006) suggested that the presence of
mass-proportional damping will generate extraneous damping forces due to the rigid body motion component involved in the
formulation of earthquake analysis that is based on total motion. It is worth noting that rigid body motion phenomena
become more significant in the analysis of tall buildings.
For the test structure, previous studies have adopted different approaches and values to model viscous damping. For
instance, Panagiotou and Restrepo (2006) used a damping ratio of 0.3% for the first longitudinal mode to accurately
simulate the response to earthquake input motions; Martinelli and Filippou (2009) used Rayleigh damping with mass
and initial stiffness-proportional damping matrix and a 1.0% damping ratio for the first two flexural modes; while
Waugh and Sritharan (2010) used tangent stiffness-proportional viscous damping corresponded to 0.5% and 0.8%
damping ratios for the first and third uncracked mode periods, respectively. The use of such a low damping ratio in
modelling the test structure can be attributed to the absence of non-structural elements and also to the fact that flexural
cracking was largely limited to the lower part of the structure as a consequence of the low ratio of longitudinal
reinforcements in which the design approach of the building led to (i.e. displacement-based design). Based on the above
discussion, a stiffness-proportional viscous damping corresponding to 0.5% damping ratio in the first longitudinal mode
is used in the Z-Model, while the mass-proportional damping term is set to zero.
The input motions shown in Fig. 4 are applied to the base of the Z-Model in the East-West direction parallel to the
web wall. Using the Newmark integration scheme, NRHA is conducted at a time step of 1/60s. The four input motions,
EQ1 to EQ4, are concatenated to account for the accumulated structural damage on the response of the test structure.
Six seconds of zero base acceleration is added in between the earthquake records to allow the structure to come to rest
prior to being subjected to the next record. The applied concatenated base motion record is 523s long in total.
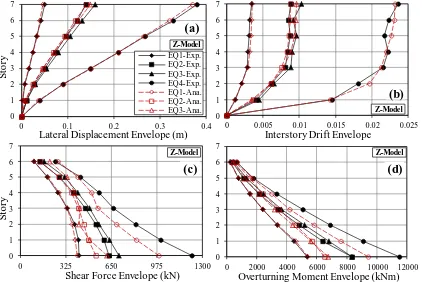
The capability of the Z-Model in predicting the global response of the test structure during the most intense 30s of
each of the four earthquake input motions is assessed by comparing the numerical results with measured data for
top-floor relative displacement time histories (Fig. 7), response envelopes of story displacement, interstory drift (ISD), story
shear force and story overturning moment (Fig. 8). Figure 7 shows that the model captures well all the significant peak
by as much as 25%. The discrepancies of the computed response for EQ3 have also been reported in other studies
(Kelly 2007; Waugh and Sritharan 2010). This is mainly attributed to the similarity in earthquake intensity between
EQ2 and EQ3 input motions. As a consequence of these two records having comparable intensities, the unloading and
reloading paths of the material models rather than their envelopes have a big influence on the numerical response of
EQ3. Accurate representation of the unloading and reloading behavior of material models becomes more important
when the structure does not move into virgin territory, as for example during aftershocks. Figure 8a shows very good
agreement between predicted and measured displacement envelopes at floor-levels (story displacement). As expected,
the displacements of EQ3 are under predicted. The maximum calculated roof drift ratios are found to be 0.30% for EQ1,
0.75% for EQ2 and 2.05% for EQ4, compared to their corresponding measured values of 0.28%, 0.75%, and 2.06%,
respectively. For EQ3, the obtained and measured maximum roof drifts are 0.78% and 0.83%, respectively. ISD is
typically considered as a key parameter in defining performance limit states for seismic vulnerability assessment of
buildings and hence it is essential to have this parameter accurately predicted. As shown in Fig. 8b, the ISD envelopes
are well predicted by the analysis for EQ1, EQ2, and EQ4, while for EQ3 the envelope is within 30% of the
experimental values for the reasons given above.
Despite the very good agreement between predicted and measured response values (top displacement time
histories, story displacement, and ISD envelopes), the Z-Model underestimates the story shear and consequently story
moment envelopes of the test structure, especially when the structure behaves inelastically (Fig. 8c and 8d). The
discrepancies between reported and numerical story shear and moment values can be attributed to the influence of the
3D interaction between gravity columns, floor slabs and the web wall on the overall lateral capacity of the test structure.
The significant contribution of this interaction to the lateral force resistance of the test building was also confirmed by
Panagiotou and Restrepo (2006) using pushover analysis. The main reason for this influence is that, due to their
interaction with the floor slab, the gravity columns developed significant axial strains during testing. Consequently, the
columns near the tension side of the web wall experienced tensile forces whilst those closer to the compression side
were subjected to compression forces. Given the 3.05m span between the columns, the tension and compression forces
enabled a large moment to be developed and effectively increased the lateral force resistance of the test structure.
4.2
Modeling and verification using 2D, 2-noded fiber-based frame element modeling approach:
IZ-Model
To address the shortcomings of the Z-Model, an improved 2-noded fiber-based model (IZ-Model) is developed to
introduce the 3D slab-columns-web wall interaction effect. In this model, 3D joint element is introduced at both ends of
the rigid link that connect the web wall centerline to the gravity columns at each floor level (Fig. 5b). A bilinear
out-of-plane flexural rigidity of the slab. The asymmetric relation is due to the different reinforcement mats in the top and
bottom of the slabs in the test structure. The remaining five degrees of freedom in nodes 1 and 2 of the 3D joint were
restrained by assigning them high stiffness values. Figure 9 shows the story shear and moment envelopes predicted
using the IZ-Model for EQ1 to EQ4, where significant improvements can be seen. This exercise highlights the
importance of taking into account the 3D interaction effect of all structural members in the building to accurately
predict the seismic response.
To assess the capability of the IZ-Model to capture the damage evolution of the test structure during the four input
motions, the frequency spectra of the top relative displacement time histories using the Fast Fourier Transform (FFT)
method and the structure periods of the first two modes are plotted for EQ1 to EQ4 in Fig. 10. It is worth noting that the
measured fundamental frequency of the test structure changed from 1.96Hz before testing to 0.86Hz at the end of EQ4,
with corresponding fundamental periods of 0.51s and 1.16s, respectively. Despite the significant lengthening of the
fundamental period of the test structure by more than 200%, the IZ-Model was able to track this damage progression
with good accuracy. At the end of EQ4, the observed difference between measured and predicted first mode frequency
is 20%, which can be attributed to the high flexural stiffnesses of the rigid links and 3D joints in the model.
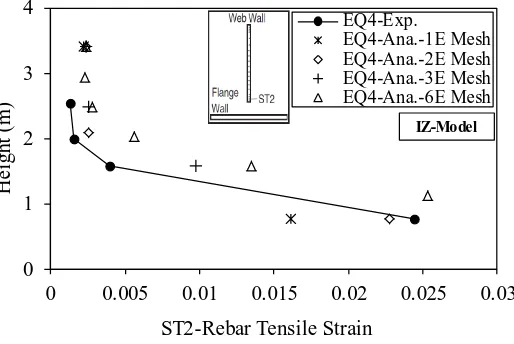
Another measure of the capability of the numerical model is the determination of local damage. Figure 11 depicts
the tensile strain envelope of an outer reinforcing bar located in the web wall, marked as ST2 in the tests, along the
height of the first level for EQ4 input motion. It should be noted that computed strains can be mesh-sensitive, especially
at zones of concentrated plasticity. To investigate the influence of mesh size on the computed stains, the web wall
member in the first level of the building is modeled using four different meshes: One Element-mesh (1E); Two
Element-mesh (2E); Three Element-mesh (3E); and Six Element-mesh (6E). The results presented in Fig. 11 indicate
that the IZ-Model (2E) predicted the tensile strain envelopes of the ST2 reinforcing bar with good accuracy. It is worth
mentioning that the 2E needed an element length of 1321mm, which is close to the expected plastic hinge length at the
web wall base (0.5 times the flexural depth of the wall=1830mm) as proposed by ASCE/SEI 41-06 (2007). Hence,
mesh sizes not exceeding the expected plastic zone length are confirmed as being suitable for fiber-based modeling of
RC shear walls.
4.3
Modeling and verification using 3D, 4-noded fiber-based wall modeling approach:
P-Model
To evaluate the capability of the 4-noded element modeling approach in predicting the response of the test structure, the
P-Model is developed using PERFORM-3D (CSI 2011). To model the web and flange walls, a 4-noded fiber-based
shear wall element is used with nonlinear vertical fibers to represent the behavior of concrete and reinforcing steel.
the first level is represented by two vertical elements. The link slab is modeled using 2-noded fiber-based frame
element. An elastic frame element with specified cross-section properties is used to model the prestressed segmental
pier, while elastic bar element is utilized to model the pin-pin end braces and gravity columns. Finally, an elastic
4-noded slab element is used to represent the floor slabs. For the sake of comparison, the same principles used in the
Z-Model and IZ-Z-Model for modeling the seismic mass of the test structure are followed.
A four-linear-segment Force-Deformation (F-D) relation is used to approximate the concrete stress-strain
relationship based on the modified Mander model (Fig. 6c). For the reinforcing steel material model, a similar relation
is used with the post-yield stiffness and cyclic degradation parameters defined following the adjustments described by
Orakcal and Wallace (2006). A linear stress-strain relation is used to model the materials of the prestressed segmental
pier, floor slabs, braces and gravity columns. In PERFORM-3D, viscous damping can be modeled using modal
damping, a more preferred viscous damping modeling approach (CSI 2011). However, for consistency, the same
assumptions and procedures used in the ZEUS-NL models for the viscous damping, applying of input motions and
numerical strategy are adopted in this model.
Shear deformation in the web wall is accounted for in the P-Model by assigning a trilinear relation to the wall
element similar to the one given in ASCE/SEI 41-06 (2007) to represent the nonlinear shear behavior of the wall. Test
results by Thomsen and Wallace (2004) and the follow-up calibration studies by Gogus (2010) are used to define the
shear F-D relation. In the used trilinear relation, the uncracked shear modulus is taken as 0.4Ec and diagonal (shear)
cracking is assumed to start at 0.25 ≤ 0.5vn , where vn is the wall nominal shear strength from ACI code (2014).
The post-cracking slope is reduced to 0.01Ec to account for the nonlinear shear deformations due to shear-flexure
interaction (Massone 2006).
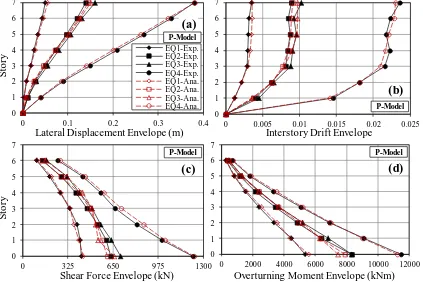
Following the same sequence used in the previous section, Figs. 12, 13, 14 and 15 show predicted versus measured
top-floor relative displacement time histories, response envelopes, evolution of modal characteristics and ST2 steel
rebar tensile strain, respectively. Very good agreement can be seen for all predicted responses except for EQ3, for the
same reasons discussed earlier.
While the data measured from the shake table test confirmed the accuracy of the investigated modeling approaches
and key parameters in predicting global response and local damage induced by seismic demands on slender wall
structures, some limitations became apparent in the 2-noded fiber-based modeling approach (e.g. accounting for 3D
compatibility effects). The study reveals the superior ability of 4-noded fiber-based wall/shell element to account for 3D
effects of deformation compatibility between lateral and gravity-force-resisting systems. The study also addresses the
sensitivity of attained results to the stiffnesses assigned to the rigid links and 3D joints required to connect the shear
5
Summary and conclusions
In this paper, the results from Phase I of the shake table tests undertaken at UCSD of a full-scale slice of a seven-story
RC wall building are employed to conduct a Multi-Level Nonlinear Modelling Verification Scheme (MLNMVS). The
scheme verifies different approaches and key parameters in modeling RC slender shear walls forming the
lateral-force-resisting system in RC high-rise wall buildings. Three numerical models are created to simulate the nonlinear response
of the test structure to four consecutive table excitations representing real earthquake motions with increasing maximum
acceleration from 0.15g to 0.91g. 2-noded fiber-based beam-column element approach is adopted to model the web and
flange walls in the 2D “Z-Model” and ‘IZ-Model” centerline models using ZUES-NL tool. PERFORM-3D package is
utilized to create the third, 3D, model “P-Model” using 4-noded fiber-based wall/shell element. The main conclusions
drawn from this study are:
With appropriate care in the modeling of the geometry, both investigated nonlinear modeling approaches (2-
and 4-noded fiber-based elements) are sufficient to predict global deformation response (story lateral
displacement and interstory drift) of RC wall buildings with relatively good accuracy.
The study reveals the supremacy of 4-noded fiber-based wall/shell element in accounting for the 3D effects of
deformation compatibility between lateral and gravity-force-resisting systems. The 3D interaction between
gravity columns, floor slabs, and the web wall significantly contributed to the overall lateral capacity of the
test structure.
When initial stiffness is used in constructing the damping matrix for RC wall buildings with no or
well-isolated non-structural elements, low viscous damping ratio (0.5% for the test structure) is suitable for
assessing their seismic performance.
The observed difference between predicted and measured responses of the test structure under the two
consecutive input motions with comparable intensities (EQ2 and EQ3) highlights the importance of accurate
representation of the unloading/reloading paths of the material models. This is particularly true when
assessing the performance of buildings under earthquake motions that do not move the structure into virgin
territory (i.e. past previous deformations).
No noticeable change is observed in the numerical response of the test structure when shear deformation is
accounted for in the P-Model compared to the results obtained from the IZ-Model. This is justified by the test
results that demonstrated almost exclusively flexural cracking at the web wall base. However, shear
even in walls categorized as slender and/or flexure-dominated. Hence, considering the shear deformation
either implicitly (coupled model) or explicitly (uncoupled model) is recommended.
References
ACI (2014) Building code requirements for structural concrete (ACI 318M-14) and commentary. American Concrete Institute, Farmington Hills, MI
ASCE (2007) ASCE/SEI 41-06: Seismic rehabilitation of existing buildings American Society of Civil Engineers, Reston, VA
ATC (2010) PEER/ATC-72-1: Modeling and acceptance criteria for seismic design and analysis of tall buildings. Applied Technology Council, Redwood City, CA
Beyer K, Dazio A, Priestley M (2008) Quasi-static cyclic tests of two U-shaped reinforced concrete walls. Journal of Earthquake Engineering 12:1023-1053
CSI (2011) PERFORM-3D V5: Nonlinear analysis and performance assessment for 3D structures: User Manual. Computer and Structures, Inc., 1995 University Avenue, Berkeley, CA
Elnashai AS, Papanikolaou V, Lee D (2012) Zeus-NL: A system for inelastic analysis of structures: User Manual. Mid-America Earthquake Centre, Department of Civil and Environmental Engineering, the University of Illinois at Urbana-Champaign, Urbana, IL
Filippou FC, Popov EP, Bertero VV (1983) UCB/EERC-83/19: Effects of bond deterioration on hysteretic behavior of reinforced concrete joints. The University of California, Berkeley, CA
Gogus A (2010) Structural wall systems-nonlinear modeling and collapse assessment of shear walls and slab-column frames. Dissertation, University of California, Los Angeles, CA
Hall JF (2006) Problems encountered from the use (or misuse) of Rayleigh damping. Earthquake Engineering & Structural Dynamics 35:525-545
Ji J, Elnashai AS, Kuchma DA (2007) An analytical framework for seismic fragility analysis of RC high-rise buildings. Engineering Structures 29:3197-3209
Kelly T (2007) A blind prediction test of nonlinear analysis procedures for reinforced concrete shear walls. Bulletin of the New Zealand Society for Earthquake Engineering 40:142-159
Mander JB, Priestley MJN, Park R (1988) Theoretical stress-strain model for confined concrete. Journal of Structural Engineering 114:1804-1826
Martinelli P, Filippou FC (2009) Simulation of the shaking table test of a seven-story shear wall building. Earthquake Engineering & Structural Dynamics 38:587-607
Martínez-Rueda JE, Elnashai AS (1997) Confined concrete model under cyclic load. Materials and Structures 30:139-147
Massone LM (2006) RC wall shear–flexure interaction: Analytical and experimental responses. Dissertation, University of California, Los Angeles, CA
Menegotto M, Pinto P Method of analysis for cyclically loaded reinforced concrete plane frames including changes in geometry and non-elastic behavior of elements under combined normal force and bending. In: IABSE Symposium on the Resistance and Ultimate Deformability of Structures Acted on by Well-Defined Repeated Loads, Lisbon, Portugal, 1973.
Moaveni B, He X, Conte JP, Restrepo JI (2010) Damage identification study of a seven-story full-scale building slice tested on the UCSD-NEES shake table. Structural Safety 32:347-356
Orakcal K, Wallace JW (2006) Flexural modeling of reinforced concrete walls-experimental verification. ACI Structural Journal 103:196-206
Panagiotou M, Restrepo J Model Calibration for the UCSD 7-Story Building Slice. In: NEES-UCSD Workshop on the Analytical Model of Reinforced Concrete Walls, San Diego, CA, 2006.
Panagiotou M, Restrepo JI, Conte JP (2007a) Shake table test of a 7 story full scale reinforced concrete structural wall building slice phase I: Rectangular Wall Section vol SSRP–07-07. Department of Structural Engineering, University of California, San Diego, CA
Panagiotou M, Restrepo JI, Conte JP (2007b) Shake table test of a 7 story full scale reinforced concrete structural wall building slice phase II: T-Wall Section vol SSRP–07-08. Department of Structural Engineering, University of California, San Diego, CA
Panagiotou M, Restrepo JI, Conte JP (2011) Shake-table test of a full-scale 7-story building slice. Phase I: Rectangular wall. Journal of Structural Engineering 137:691-704
PEER (2010) TBI: Guidelines for performance-based seismic design of tall buildings. The University of California, Berkeley, CA
Smyrou E, Priestley MJN, Carr AJ (2011) Modelling of elastic damping in nonlinear time-history analyses of cantilever RC walls. Bulletin of Earthquake Engineering 9:1559-1578
Thomsen JH, Wallace JW (1995) CU/CEE-95/06: Displacement-based design of RC structural walls: An experimental investigation of walls with rectangular and T-shaped cross-sections. Department of Civil and Environmental Engineering, Clarkson University, Potsdam, NY
Thomsen JH, Wallace JW (2004) Displacement-based design of slender reinforced concrete structural walls-experimental verification. Journal of Structural Engineering 130:618-630
Wallace JW (2007) Modelling issues for tall reinforced concrete core wall buildings. The Structural Design of Tall and Special Buildings 16:615-632
Wallace JW (2010) Performance-based design of tall reinforced concrete core wall buildings. In: Mihail G, Ansal A (eds) Earthquake Engineering in Europe. 1 edn. Springer, Netherlands, pp 279-307
Wallace JW (2012) Behavior, design, and modeling of structural walls and coupling beams—Lessons from recent laboratory tests and earthquakes. International Journal of Concrete Structures and Materials 6:3-18
Wallace JW, Moehle JP Behavior and design of structural walls–lessons from recent laboratory tests & earthquakes. In: Proceedings of the International Symposium on Engineering Lessons Learned from the 2011 Great East Japan Earthquake, Tokyo, Japan, 1-4 March 2012.
Table 1 Peak recorded values of selected response parameters for the test structure (Panagiotou et al. 2011) Response Parameter Before
EQ1
After EQ1
After EQ2
After EQ3
After EQ4
Fundamental period (s) 0.51 0.65 0.82 0.88 1.16
Roof relative lateral displacement (m) - 0.05 0.14 0.16 0.38
Roof drift ratio (%) - 0.28 0.75 0.83 2.06
Inter-story drift ratio* - 0.35 0.89 1.03 2.36
Peak table acceleration (g) - 0.15 0.27 0.35 0.91
System base shear (kN)§ - 425 628 704 1185
System base moment (kNm) § - 5606 8093 8490 11839
*Overall stories.
§ Calculated as the product of story mass with measured horizontal floor acceleration.
Fig. 1 Prototype building and test structure used in modeling verification: (a) Residential floor plan; (b) Parking floor plan; and (c) Perspective view of the test structure (Panagiotou et al. 2007a)
(a)
(b)
[image:15.595.82.517.232.426.2]Fig. 2 Test structure used in modelling verification: (a) Elevation; (b) Floor plan view; and (c) Foundation plan view
North
L
o
a
d
in
g
Dire
c
ti
o
n
E W
+ +
+
+
+ +
+ +
+ +
+ +
+ +
+ +
+ + + +
+
+
+ +
+
+ +
+
+ +
+ +
North
. .
.
.
+ +
Flange wall
Web wall
Detail A
(a)
(b)
Fig. 3 Reinforcement details for the test structure: (a) web and flange walls at first level; and (b) web and flange walls at levels 2-6; and (c) floor and link slabs at all levels
Fig. 4 Most intense 30s time histories and response spectra of recorded table ground motions for the test structure used in modeling verification
Ø12 @ 203 90° standard
90° standardØ12 @ 305
Ø12 @ 203 90° standard
Ø12 @ 203 90° standardØ12 @ 305
51x140 slot 2Ø12x4775@305 T&B 7Ø16x8026@152 T&B 13Ø12x8026@305 T&B 12Ø12x3048@305 T
N
-1 -0.5 0 0.5 140 50 60 70
EQ1
agmax=0.15g
Vgmax=0.26m/sec
185 195 205 215
EQ2
agmax=0.27g
Vgmax=0.32m/sec
325 335 345 355
EQ3
agmax=0.35g Vgmax=0.43m/sec
455 465 475 485
EQ4
agmax=0.91g
Vgmax=1.02m/sec
0 1 2 3
0 0.5 1 1.5 2
Sp ec tr al A cc eler atio n Sa (g )
Period, T (s)
EQ1 EQ2 EQ3 EQ4 =5% 0 0.2 0.4 0.6
0 0.5 1 1.5 2
Sp ec tr al Dis p lace m en t Sd (m )
Period, T (s)
EQ1 EQ2 EQ3 EQ4 =5% T ab le A cceler ation ( g )
(a)
(b)
[image:17.595.139.457.512.722.2]
Fig. 5 Schematic diagrams of developed models for the test structure: (a) Z-Model; (b) IZ-Model; (c) P-Model; and (d) 3D joint element
Fig. 6 Constitutive material models: (a) concrete in Z-Model and IZ-Model; (b) steel rebars in Z-Model and IZ-Model; and (c) general four-linear-segment F-D relation for concrete and steel rebars in P-Model
Node without mass Node with mass
Rigid link Elastic element
2-noded fibre-based
3D Joint element beam-column element
Y
X
1,2
3
y 1
x y
2 F
V M
x
After deformation
Before deformation
Node 4 to define x-y plane.
4
Reloading curve Unloading curve Envelope curve
c c
f
E1
R0
E0
y
R ( R a a )012 y
,,
U
Y
Zero slop
X
X R
stiffness Initial
stiffness Hardening
D strength loss Optional full deformation Maximum loss
Strength No strength loss F
(a) (b) (c)
(c) (b)
(a)
[image:18.595.76.516.451.566.2]Fig. 7 Z-Model: measured versus computed top relative displacement during the four Input motions
Fig. 8 Z-Model: measured versus computed envelopes: (a) relative displacement; (b) interstory drift; (c) story shear; and (d) story overturning moment -0.1 -0.05 0 0.05 0.1
40 45 50 55 60 65 70
Dis p lace m en t (m ) Exp. Ana. Z-Model EQ1 -0.2 -0.1 0 0.1 0.2
185 190 195 200 205 210 215
EQ2 Z-Model -0.2 -0.1 0 0.1 0.2
325 330 335 340 345 350 355
Dis p lace m en t (m ) Time (s) EQ3 Z-Model -0.5 -0.25 0 0.25 0.5
455 460 465 470 475 480 485
Time (s) EQ4 Z-Model 0 1 2 3 4 5 6 7
0 0.1 0.2 0.3 0.4
S
to
ry
Lateral Displacement Envelope (m)
EQ1-Exp. EQ2-Exp. EQ3-Exp. EQ4-Exp. EQ1-Ana. EQ2-Ana. EQ3-Ana.
(a)
Z-Model 0 1 2 3 4 5 6 70 0.005 0.01 0.015 0.02 0.025
Interstory Drift Envelope
(b)
Z-Model 0 1 2 3 4 5 6 70 325 650 975 1300
S
to
ry
Shear Force Envelope (kN)
(c)
Z-Model 0 1 2 3 4 5 6 70 2000 4000 6000 8000 10000 12000
Overturning Moment Envelope (kNm)
(d)
[image:19.595.89.511.423.705.2]Fig. 9 IZ-Model: measured versus computed envelopes: (a) Story shear; and (b) Story moment
Fig. 10 IZ-Model: evolution of modal characteristics during the four input motions: (a) frequency spectra; and (b) structure periods
Fig. 11 IZ-Model: tensile strain of ST2 reinforcing bar over the height of the first level for EQ4 0 1 2 3 4 5 6 7
0 325 650 975 1300
Sto
ry
Shear Force Invelope (kN)
EQ1-Exp. EQ2-Exp. EQ3-Exp. EQ4-Exp. EQ1-Ana. EQ2-Ana. EQ3-Ana. EQ4-Ana. IZ-Model
(a)
0 1 2 3 4 5 6 70 2000 4000 6000 8000 10000 12000
Overturning Moment Envelope (kNm)
(b)
IZ-Model
0 0.5 1
0 0.5 1 1.5 2
No rm alize d A m p litu d e Frequency (Hz)
End of EQ1-Ana. End of EQ2-Ana. End of EQ3-Ana. End of EQ4-Ana.
1. 60 1 .1 4 1. 25 1 .0 3
Measured Frq. (Hz):
After EQ1: 1.53 After EQ2: 1.23 After EQ3: 1.11 After EQ4: 0.86
IZ-Model
(a)
Before EQ1 After EQ1 After EQ2 After EQ3 After EQ40 0.2 0.4 0.6 0.8 1 1.2 P er io d , T ( s) 1ST Mode-Exp. 1ST Mode-Ana. 2ND Mode-Exp. 2ND Mode-Ana. IZ-Model
(b)
0 1 2 3 40 0.005 0.01 0.015 0.02 0.025 0.03
H e ig h t (m )
ST2-Rebar Tensile Strain
[image:20.595.170.427.548.720.2]Fig. 12 P-Model: measured versus computed top relative displacement during the four input motions
Fig. 13 P-Model: measured versus computed envelopes: (a) relative displacement; (b) interstory drift; (c) shear force; and (d) story overturning moment -0.1 -0.05 0 0.05 0.1
40 45 50 55 60 65 70
Dis p lacem en t (m ) Exp. Ana. P-Model EQ1 -0.2 -0.1 0 0.1 0.2
185 190 195 200 205 210 215
EQ2 P-Model -0.2 -0.1 0 0.1 0.2
325 330 335 340 345 350 355
Dis p lace m en t (m ) Time (s) EQ3 P-Model -0.4 -0.2 0 0.2 0.4
455 460 465 470 475 480 485
Time (s) EQ4 P-Model 0 1 2 3 4 5 6 7
0 0.1 0.2 0.3 0.4
S
to
ry
Lateral Displacement Envelope (m)
EQ1-Exp. EQ2-Exp. EQ3-Exp. EQ4-Exp. EQ1-Ana. EQ2-Ana. EQ3-Ana. EQ4-Ana.
(a)
P-Model 0 1 2 3 4 5 6 70 0.005 0.01 0.015 0.02 0.025
Interstory Drift Envelope
(b)
P-Model 0 1 2 3 4 5 6 70 325 650 975 1300
S
to
ry
Shear Force Envelope (kN)
(c)
P-Model 0 1 2 3 4 5 6 70 2000 4000 6000 8000 10000 12000
Overturning Moment Envelope (kNm)
(d)
[image:21.595.88.511.421.703.2]Fig. 14 P-Model: evolution of modal characteristics during the four input motions: (a) frequency spectra; and (b) structure periods
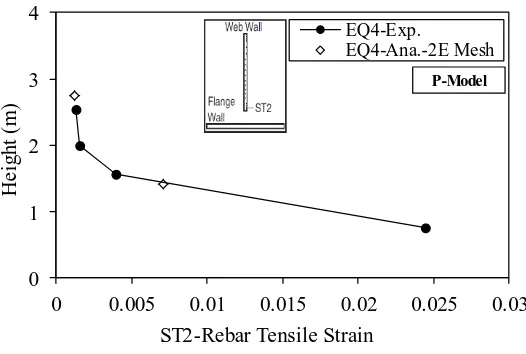
Fig. 15 P-Model: tensile strain of ST2 reinforcing bar over the height of the first level for EQ4 0
0.5 1
0 0.5 1 1.5 2
No rm alize d A m p litu d e Frequency (Hz)
End of EQ1-Ana. End of EQ2-Ana. End of EQ3-Ana. End of EQ4-Ana.
1. 52 1. 13 1. 19 0. 91
Measured Frq. (Hz):
After EQ1: 1.53 After EQ2: 1.23 After EQ3: 1.11 After EQ4: 0.86
P-Model
(a)
Before EQ1 After EQ1 After EQ2 After EQ3 After EQ40 0.2 0.4 0.6 0.8 1 1.2 P er io d , T ( s) 1ST Mode-Exp. 1ST Mode-Ana. 2ND Mode-Exp. 2ND Mode-Ana. P-Model
(b)
0 1 2 3 40 0.005 0.01 0.015 0.02 0.025 0.03
H e ig h t (m )
ST2-Rebar Tensile Strain
EQ4-Exp.
EQ4-Ana.-2E Mesh
[image:22.595.165.428.288.465.2]