INTRODUCTION
Octopus are important ecological components of marine food webs, being simultaneously prey items, voracious predators and an increasingly important tar-get for fisheries worldwide (Clarke 1996, Boyle & Rod-house 2005, FAO 2005). One of the most remarkable characteristics of octopus are their energy efficiencies, which allows them to sustain high growth rates during their short lifespans (usually <18 mo) while maturing and reproducing. This is facilitated by a generalist diet, very high consumption rates, high conversion rates, efficient use of oxygen and their unique ability like most cephalopods to sustain continuous hyperplastic and hypertrophic muscle growth (Jackson & O’Dor
2001, Semmens et al. 2004). However, despite recent advances in this area (Wells & Clarke 1996, Daly & Peck 2000, Petza et al. 2006), our understanding of the energetics of octopus growth remains sketchy. There are still debates as to the actual form of the growth curve for wild octopus, in particular whether they dis-play a 2-phase growth pattern (an initial rapid expo-nential phase followed by a slower second growth phase) as is often observed in captivity (Forsythe & Hanlon 1988, Domain et al. 2000, Semmens et al. 2004, Boyle & Rodhouse 2005). Analyses of field data may never shed light on this issue as field size-at-age data for highly variable species such as squid typically con-tain few data for the early part of the life span and fre-quently exhibit a greater scattering of data points with
© Inter-Research 2009 · www.int-res.com *Email: [email protected]
Effects of temperature on energetics and the
growth pattern of benthic octopuses
Jessica André
1,*, Eric P. M. Grist
2, Jayson M. Semmens
1, Gretta T. Pecl
1,
Susumu Segawa
31Tasmanian Aquaculture and Fisheries Institute, Marine Research Laboratories, University of Tasmania, Private Bag 49, Hobart, Tasmania 7001, Australia
2Environmental Research Institute, North Highland College, UHI Millenium Institute, Caithness, KW14 7JD, UK 3Department of Ocean Sciences, Faculty of Marine Science, Tokyo University of Marine Science and Technology,
4-5-7 Konan, Minato-ku, Tokyo 108-8477, Japan
ABSTRACT: In octopus, growth trajectories have implications for survivorship, adult size and fecun-dity. Many species exhibit a 2-phase growth pattern starting with rapid exponential growth before shifting to a slower (commonly power) growth rate. Based on the concept that energy conservation enforces this threshold, we developed a temperature-dependent model which incorporates the energy balance between food intake and expenditure in growth and metabolism. We employed the model to investigate growth patterns occurring at different temperatures for 2 octopus species, Octo-pus ocellatusand O. pallidus.Model projections were consistent with laboratory data and suggest that increases in temperature as small as 1°C could have a significant influence on cephalopod growth, affecting the threshold body mass by up to 15.5% and the body mass at 100 d by up to 62.6%. Sensitivity analyses suggest that threshold size is more sensitive than threshold age to any given change in parameter values, and that metabolic rate has the greatest influence on the growth thresh-old. This model provides a basis for predicting individual growth trajectories and consequential pop-ulation structure of natural octopus poppop-ulations. This type of analysis also has the potential to predict optimum conditions for a species and could be a powerful tool for predicting how climate change might affect species distribution as well as population structure and abundance.
KEY WORDS: Energy balance · 2-phase growth · Gold-spot octopus · Pale octopus · Climate change
increasing age (Arkhipkin & Roa-Ureta 2005). This causes serious difficulties in statistical approaches that depend only on regression inference to estimate the individual growth curve, so that the curve may often be misspecified when data are inadequate to support the relationship being fitted. Grist & Jackson (2004) introduced the concept of energy balance as a mecha-nism that might lead to 2-phase growth in cephalo-pods. The authors hypothesised that after reaching a critical size, the energy intake from food would no longer sustain the energetic demands of both meta-bolism and individual growth at the current level. As a consequence, individuals are predicted to shift to a slower growth rate, thus resulting in a 2-phase growth pattern. While taking account of body size, this model does not explicitly invoke environmental temperature, which is the most important abiotic factor influencing cephalopod life history alongside nutrition. Since tem-perature influences all aspects of the energy budget and, according to the hypothesis of Grist & Jackson (2004), energetics determines the transition between the 2 growth phases, temperature must therefore influ-ence the transition body mass and transition age out of exponential growth, and consequently individual growth trajectories. This has implications for survivor-ship (Calow 1987), adult size (Forsythe & Van Heukelem 1987) and hence fecundity (Mangold 1987) at the individual level, subsequently influencing popu-lation structure. Assessing the effect of temperature on the growth of octopus is therefore crucial to under-standing the population dynamics of these short-lived and increasingly exploited species, particularly in the light of predicted warming of the oceans. Our main aim is to investigate the influence of temperature on the energetics of octopus, and its associated impact on growth, through the utilisation of a temperature-dependent energy balance model.
THE ENERGY BALANCE MODEL
Concept
The traditional formulation of the energy budget of marine animals is based on the balanced energy equa-tion formulated by Winberg (1956), which follows the fundamental law of energy conservation
(1) where FT is the total energy intake rate from food, Mand G are the respective rates at which energy is expended in metabolism and growth (both somatic and reproductive), and W is the rate at which energy is wasted in excretions such as urine, faeces and other wastage (e.g. mucus, shed sucker cuticles). In this
paper, these rates are expressed in kJ d–1. Unlike somatic growth, reproductive growth in octopus differs between sexes in both energy allocation and timing. Males appear to mature earlier, coinciding with the shift between growth phases, whereas females tend to mature in the second slower phase of growth (Sem-mens et al. 2004). Assessing reproductive investment has been achieved for a few species (Boyle & Knobloch 1984, Perez & Haimovici 1991, Cortez et al. 1995) but estimating the onset of sexual maturation remains problematic, as the influence of food availability and temperature on this aspect of reproduction has yet to be quantified. Given the deficiency in information, we did not incorporate reproductive growth to avoid intro-ducing unsupportable complexity into the model. The current representation is consequently characteristic of females’ energetics.
The rate Wcan be eliminated by way of an assimila-tion efficiency parameter A, defined as the proporassimila-tion of the intake energy which is not lost in excreta (Kleiber 1947), so that
(2) In order for an individual to survive there must be sufficient energy available to support metabolism and growth so that F≥M+ Gor equivalently F– M– G≥0, which hence gives rise to an energy balance constraint (Grist & Jackson 2004).
The dependencies of metabolic rate Mand food in-take rate Fon body mass B(in g) have previously been characterised by an allometric scaling law of the form y= qBpwhere p> 0 is a scaling exponent and q> 0 is a
constant (West et al. 1997, Boyle & Rodhouse 2005, O’Dor et al. 2005). The growth rate Gduring the expo-nential phase is (by definition) directly proportional to body mass. Hence, the required supply of energy E(B) can be expressed as a function of body mass B
(3) where E(B)must remain positive in order for an indi-vidual to survive (Fig. 1).
Beyond a critical body weight B* achieved at age t* (where B* = B0exp(mt*) and B0is the hatch size) when E(B)= 0, it follows that an individual would be unable to support its total energy expenditure. Grist & Jackson (2004) hypothesised that a shift from exponential growth would then be necessary.
The value of 0.75 has been traditionally assigned as the scaling exponent of metabolism p2 for many ani-mals (Kleiber 1932); however, octopus generally have higher p2 values which may reach up to 0.90 (Kat-sanevakis et al. 2005). The qiare generally
species-specific (West et al. 1997) and are typically estimated from experimental studies.
E B F B M B G B
q Bp q Bp q B ( ) = ( ) ( ) ( )
= − −
– –
1 1 2 2 3
FT×A = F = M G+
Incorporation of temperature dependence
Since temperature Taffects feeding, metabolic and growth rates in cephalopods, we incorporate tempera-ture dependency by modifying E(B) to E(B,T ) and through specifying qias temperature dependent qi(T )
so that
(4) where the functions qi(T )were empirically determined
from temperature-dependent data sets. We assume all body mass exponents pi to be species-specific and
independent of temperature as noted with p2 by Zeuthen (1953), von Bertalanffy (1957) and Katsan-evakis et al. (2005).
METHODS
We parameterised the model for 2 commercially exploited octopus, Octopus ocellatusand O. pallidus. Model parameters for each species were estimated from data published in the literature and collected in laboratory experiments, henceforth referred to as Expts 1, 2 and 3. Parameter values for both species are summarised in Table 1.
Data sets.Expt 1 provided data on the growth and feeding rates and oxygen consumption of Octopus ocellatus, details of which are published in Segawa & Nomoto (2002). Eleven juveniles hatched in captivity were reared for 205 d at 20 ± 1°C (n = 6) and 25 ± 1°C (n = 5). Individuals were fed hermit crabs Clibanarius
E B T F B T M B T G B T
q T Bp q T B
, , , ,
( ) = ( )− ( )− ( )
= 1( ) 1− 2( ) pp2−q T B3( )
0.6
0
B*
Body mass (g)
Initial rate of exponential growth not possible
E
(
B
,
T
)
1
15°C 20°C 25°C
2 3 4 5 6 7 8
0.4
0.2
0.0
–0.2
[image:3.612.63.282.83.227.2]–0.4
Fig. 1. Octopus ocellatus. Energy balance function E(B,T ) when parameterised for individuals reared at 15, 20 and 25°C with data obtained from Expt 1. By definition, threshold body
mass B* is reached when E(B,T )= 0
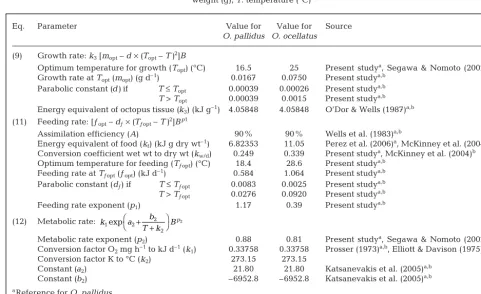
Eq. Parameter Value for Value for Source
O. pallidus O. ocellatus
(9) Growth rate: k3[mopt– d×(Topt– T )2]B
Optimum temperature for growth (Topt) (°C) 16.5 25 Present studya, Segawa & Nomoto (2002)b
Growth rate at Topt(mopt) (g d–1) 0.0167 0.0750 Present studya,b
Parabolic constant (d)if T≤Topt 0.00039 0.00026 Present studya,b
T> Topt 0.00039 0.0015 Present studya,b
Energy equivalent of octopus tissue (k3) (kJ g–1) 4.05848 4.05848 O’Dor & Wells (1987)a,b
(11) Feeding rate: [ƒopt– dƒ×(Tƒopt– T )2]Bp1
Assimilation efficiency (A) 90% 90% Wells et al. (1983)a,b
Energy equivalent of food (kf) (kJ g dry wt–1) 6.82353 11.05 Perez et al. (2006)a, McKinney et al. (2004)b
Conversion coefficient wet wt to dry wt (kw/d) 0.249 0.339 Present studya, McKinney et al. (2004)b
Optimum temperature for feeding (Tƒopt) (°C) 18.4 28.6 Present studya,b
Feeding rate at Tƒopt(ƒopt) (kJ d–1) 0.584 1.064 Present studya,b
Parabolic constant (dƒ) if T≤Tƒopt 0.0083 0.0025 Present studya,b
T> Tƒopt 0.0276 0.0920 Present studya,b
Feeding rate exponent (p1) 1.17 0.39 Present studya,b
(12) Metabolic rate:
Metabolic rate exponent (p2) 0.88 0.81 Present studya, Segawa & Nomoto (2002)b
Conversion factor O2mg h–1to kJ d–1(k1) 0.33758 0.33758 Prosser (1973)a,b, Elliott & Davison (1975)a,b
Conversion factor K to °C (k2) 273.15 273.15
Constant (a2) 21.80 21.80 Katsanevakis et al. (2005)a,b
Constant (b2) –6952.8 –6952.8 Katsanevakis et al. (2005)a,b aReference for O. pallidus
bReference for O. ocellatus
k a b
T k B p
1 2 2
2 2
exp +
+ ⎛
⎝ ⎞⎠
[image:3.612.54.536.427.721.2]virescensand Pagurusspp. ad libitum. Individual food consumption was measured daily and octopus were weighed every 6 to 14 d to assess growth. The oxygen consumption curves provided the species-specific metabolic exponent p2, which was calculated as the mean p2value obtained under the 2 temperature treat-ments. One individual in the 20°C treatment died at age 63 d and was excluded from the present analyses because there were too few data points to establish valid feeding and growth curves.
Expt 2 provided data on the growth rates and feed-ing rates of Octopus pallidus, details of which are pub-lished in André et al. (2008). Eight juveniles hatched in captivity were reared for 143 d at 14.7 ± 0.08°C (± SE) (n = 4) and 16.9 ± 0.12°C (n = 4). Animals were fed 2 porcelain crabs Petrolisthes elongatus daily, totalling between 4 and 12% of the octopus body weight d–1. The level of food offered was comparable with the level of food consumed by other octopus species reared in captivity under ad libitum conditions (Joll 1977, Mangold 1983, O’Dor & Wells 1987) and the survival rate over the duration of the experiment was 75% (with 2 individuals dying before the end of the experi-ment in the warm treatexperi-ment). Individual food con-sumption was measured daily and octopus were weighed every 5 to 10 d to assess growth. One individ-ual in the 16.9°C treatment was excluded from the analyses as it died at age 57 d and there were too few data points to establish valid feeding and growth curves.
Expt 3 provided data on the metabolism of Octopus pallidus. Oxygen consumption at 18°C was measured at ages 93, 132 and 146 d for 2 randomly selected indi-viduals from Expt 2. The resulting curve provided the species-specific metabolic exponent p2. Further details of the experimental procedures are presented in Appendix 1.
Experimental estimation of transition body mass and age.We used the method of Hatfield et al. (2001) based on instantaneous relative growth rate (IRGR) to identify the transition point between the growth phases. If growth is exponential, IRGR (i.e. % increase in body mass d–1) will remain constant from measure-ment to measuremeasure-ment, although there will be some fluctuation as in any biological system (Hatfield et al. 2001). The point at which IRGR starts to decline steadily marks the end of the initial exponential growth phase. The instantaneous growth rate for cephalopods following exponential growth is typically calculated according to the equation:
(5)
where B2is the body mass at time t2and B1is the body mass at time t1(Forsythe & Van Heukelem 1987).
Using this method, we clearly identified a 2-phase growth pattern for Octopus ocellatus individuals in Expt 1 (Fig. 2) with a mean ± 95% CI threshold age t* of 43 ± 27 d at 20°C (range = 15 to 71 d, n = 5) and 37 ± 12 d at 25°C (range = 25 to 49 d, n = 5), and a mean ± 95% CI threshold body mass B* of 2.5 ± 3.5 g at 20°C (range = 0 to 6.0 g, n = 5) and 2.3 ± 1.6 g at 25°C (range = 0.7 to 3.9 g, n = 5). No threshold was detected for O. pallidusin Expt 2 as growth remained exponential during the duration of the experiment (Fig. 2).
Model parameterisation.Growth rate: Growth stud-ies have long established that temperature strongly influences the growth rate of cephalopods (e.g. Man-gold & von Boletzky 1973, Forsythe & Hanlon 1988, Leporati et al. 2007, André et al. 2008). The depen-dence of growth rate on temperature in fish has been modelled with an inverted parabola to represent the general nonlinear decrease in growth rate observed towards extreme temperatures (e.g. Ricker 1979, Bartsch 2002). This model has a central optimum, cor-responding to the maximum growth rate, and a sym-metrical drop-off on both sides. Based on this inverted parabolic function, the temperature mediation of growth rate coefficient mis given by:
(6) where moptis the maximum value of m(T )at the opti-mum temperature, dis a constant, Toptis the optimum temperature for maximum growth and Tis the ambient temperature. However, Toptmay not necessarily be the midpoint of the species’ temperature range so that asymmetric curves might follow from introducing tem-perature limits on either side of the optimum (Bartsch 2002). The temperature-dependence of growth rate is then expressed by 2 equations:
(7) During exponential growth at constant temperature, instantaneous growth rate (in g d–1) is given by
(8)
This can be expressed in terms of its energy equiva-lent (in kJ d–1) as a function of body mass with temper-ature dependence incorporated from Eq. (6) to obtain
(9) where k3is the kJ energy equivalent of 1 g of octopus
tissue.
To estimate early post-hatch growth rate mat differ-ent environmdiffer-ental temperatures, we performed, for G B T( , ) =q T B3( ) = k m T B3 ( ) =k m3
[
−d T( −T)2]
Bopt opt
G B B
t mB mt mB
( ) = d = )=
d 0exp(
m T m d T T T T
m d T T
( ) = −
(
−)
<= −
(
−)
opt opt opt
opt opt
1
2
2
2 2
T>Topt m T( ) = mopt−d T( opt−T)2
IRGR = −
− ⎛
⎝⎜lnBt tlnB ⎞⎠⎟ ×
2 1
2 1
each temperature treatment (warm or cool) and each species, a regression of body mass versus time using nonlinear mixed-effect models with an exponential model B = B0e xp(mt) (Fig. 2, Table 2). This standard approach for repeated measures uses maximum likeli-hood estimation with an underlying assumption that individual data are normally distributed to determine parameter estimates (Lindstrom & Bates 1990).
For Octopus ocellatus, the regression was only per-formed up to the mean threshold point, after which octopus entered a slower growth phase. We assumed the growth rate mto be 0 at the lower and upper limit of a species’ thermal range, namely 10 and 23°C for O. pallidus, and 8 and 32°C for O. ocellatus.For O.
pal-lidus, we obtained the parameters mopt, Toptand d by nonlinear regression of an inverted parabolic curve (Eq. 6) to the combined data sets of ‘growth rate versus temperature’ data pairs from Expt 2 and the 2 ‘zero growth rate versus temperature’ data pairs estimated from the thermal range.
For Octopus ocellatus, we estimated moptto be the maximum growth rate observed in Expt 1 (0.075 g d–1 with corresponding Toptof 25°C), which resulted in an asymmetrical inverted parabolic curve for tempera-ture-dependence (Eq. 7). Parameter d1 was obtained from nonlinear regression of an inverted parabolic curve to the point pair (mopt, Topt) and the ‘zero growth rate versus temperature’ data pairs (0, 8) and (0, 42).
0
r2 = 0.86
B = 0.236 exp(0.014t) r2 = 0.80
B = 0.148 exp(0.057t)
r2 = 0.97
B = 0.125 exp(0.075t)
r2 = 0.71
B = 0.165 exp(0.018t)
20 40 60 80 100 120 140 160 180 200 Age (d)
In(body mass)
0 20 40 60 80 100 120 140 160 180 200
0 20 40 60 80 100 120 140 160 180 200 0 20 40 60 80 100 120 140 160 180 200
6
4
2
0
–2
3
a O. ocellatus (20°C) O. ocellatus (25°C)
O. pallidus (14.7°C) O. pallidus (16.9°C)
b
d c
2
1
0
–2 –1
3 2
1
0
–2 –1 6
4
2
0
–2
Species Temperature Feeding rate: F= q1Bp1 Growth: B= B0exp(mt)
(°C) q1± SE p1± SE B0± SE m± SE
O. ocellatus 20.0 0.778 ± 0.0402 0.46 ± 0.0223 0.148 ± 0.0192 0.057 ± 0.0047
25.0 1.117 ± 0.1316 0.31 ± 0.0444 0.125 ± 0.0128 0.075 ± 0.0039
O. pallidus 14.7 0.464 ± 0.0300 1.206 ± 0.1453 0.236 ± 0.0237 0.014 ± 0.0003
[image:5.612.92.504.267.543.2]16.9 0.517 ± 0.0451 1.126 ± 0.0912 0.165 ± 0.0648 0.018 ± 0.0073 Table 2. Octopus ocellatus and O. pallidus. Feeding rate and growth parameters with associated SE estimated by nonlinear
[image:5.612.60.536.638.721.2]mixed-effect models
Fig. 2. Octopus ocellatusand O. pallidus. Individual growth curves for O. ocellatusat (a) 20°C (n = 5) and (b) 25°C (n = 5), and O.
pallidusat (c) 14.7°C (n = 4) and (d) 16.9°C (n = 3). The solid black lines, estimated from nonlinear mixed-effect models,
Parameter d2was obtained from nonlinear regression of an inverted parabolic curve to the point pair (mopt, Topt) and the ‘zero growth rate versus temperature’ data pairs (0,18) and (0, 32). We assumed coefficient k3 for both species to be the same as for O. cyanea, which we sourced from O’Dor & Wells (1987).
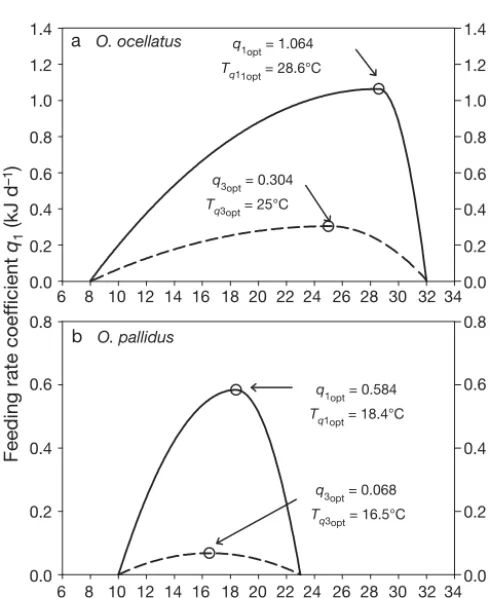
A plot of the temperature-dependence of growth rate for both species is represented in Fig. 3.
Feeding rate:From Expts 1 and 2, we estimated indi-vidual feeding rate F(in kJ d–1) every 5 to 14 d over the duration of the experiments using the formula:
(10)
where Fwis the feeding rate in g wet wt d–1, Ais the assimilation efficiency, kf is the energy equivalent of the prey tissue in kJ g–1 dry wt and k
w/dis the wet weight to dry weight conversion coefficient for prey tissue. For both octopus species, we used the general cephalopod A= 90% from Wells et al. (1983). The kf for porcelain crabs was sourced from Perez et al. (2006) and we estimated kw/dfrom the wet:dry weight
ratio of 30 crab samples from Expt 2. We used the val-ues of kfand kw/destimated by McKinney et al.(2004) for the hermit crab Pagurus longicarpusin lieu of the other hermit crab species (Pagurus spp. and Cliba-narius virescens). We performed regressions of feed-ing rate versus body mass usfeed-ing a nonlinear mixed-effect model with a power model F(B)= q1Bp1for each species and temperature treatment (warm or cool) (Fig. 4, Table 2).
Higher temperatures result in higher feeding rates in octopus (Mangold & von Boletzky 1973, Van Heu-kelem 1973, Mangold 1983, Segawa & Nomoto 2002, André et al. 2008). Towards the maximal thermal toler-ance of a species, however, the feeding rate starts to decline (Mangold 1983). We therefore assumed the relationship between q1 and temperature to be an asymmetrical inverted parabola as for growth rate so that:
F B T( , ) = q T B( ) p
1 1
F = F Ak kw f w/d
8 6 1.4
1.2 1.0
0.8
0.6 0.4
0.2 0.0
0.8
0.6
0.4
0.2
0.0
1.4
1.2 1.0
0.8
0.6 0.4
0.2 0.0
0.8
0.6
0.4
0.2
0.0 b
a
10 14 16 18 20 22 24 26 28 30
q1opt = 1.064
Tq11opt = 28.6°C
q1opt = 0.584
Tq1opt = 18.4°C
q3opt = 0.304
Tq3opt = 25°C
q3opt = 0.068
Tq3opt = 16.5°C
32 34 12
8
6 10 12 14 16 18 20 22 24 26 28 30 32 34
Temperature (°C)
Feeding rate coef
ficient
q1
(kJ d
–1)
Gr
owth rate coef
ficient
q3
(kJ d
–1)
O. pallidus O. ocellatus
Fig. 3. (a) Octopus ocellatusand (b) O. pallidus. Feeding rate coefficient q1(solid line) and the growth rate coefficient q3
(dashed line) as a function of temperature T. For each species, symmetric or asymmetric inverted parabolic curves were used to describe q1(T )and q3(T )across the thermal range
encountered in nature
0
0 20 40 60 80
1 2 3 4 5
6
5
4
3
2
1
0
3.5
3.0 2.5
2.0 1.5 1.0 0.5 0.0
Body mass (g)
Feeding rate (kJ d
–1)
b a
O. pallidus O. ocellatus
20°C 20°C: F = 0.778 B0.46
(r2 = 0.95)
(r2 = 0.67)
(r2 = 0.71)
(r2 = 0.47)
25°C: F = 1117 B0.31
16.9°C: F = 0.517 B1.13
14.7°C: F = 0.464 B1.21
25°C
[image:6.612.307.538.321.661.2]14.7°C 16.9°C
Fig. 4. Octopus ocellatusand O. pallidus. Feeding rate Fas a function of body mass B estimated from nonlinear mixed-effect models for (a) O. ocellatusat 20°C (solid line, n = 5) and 25°C (dashed line, n = 5) and (b) O. pallidusat 14.7°C (solid
[image:6.612.41.286.359.658.2]with
(11)
where Tƒoptis the optimum temperature for maximum feeding rate ƒopt, dƒ1and dƒ2are constants and Tis the ambient temperature. We assumed the difference between Topt and Tƒopt to be relative to the species’ thermal range and proportionally constant between octopus species. Based on known thermal range and Toptof our study species and data for Octopus vulgaris (thermal range: 12 to 29°C, Topt= 17.5°C, Tƒopt= 20°C) from Aguado Giménez & García García (2002), we estimated Tƒoptto be 28.6°C for O. ocellatus(thermal range: 8 to 32°C, Topt= 25°C) and 18.4°C for O. pallidus (thermal range: 10 to 23°C, Topt = 16.5°C). We per-formed a nonlinear regression of the inverted para-bolic curve to the experimental ‘feeding rate versus temperature’ data pairs, setting the ‘zero feeding rate’ at 8 and 49.2°C for O. ocellatusand 10 and 26.8°C for O. pallidus.The maximum feeding rate ƒoptand con-stant dƒ1that minimised the sum of squares to the feed-ing rate data were retained for each species. The con-stant dƒ2was then obtained from nonlinear regression of an inverted parabolic curve to the point pair (ƒopt, Tƒopt) and the ‘zero growth rate versus temperature’ data pairs (0, 25.2) and (0, 32) for O. ocellatus, and (0,13.8) and (0, 23) for O. pallidus. A plot of the temper-ature-dependence of feeding rate for both species is represented in Fig. 3.
Metabolic rate:Temperature and body mass are the
2 most important factors linked to metabolic rate (Gillooly et al. 2001). Katsanevakis et al. (2005) devel-oped a model of the form M(B,T )= q2(T )Bp2to encom-pass the effect of both these factors on the oxygen con-sumption rate of Octopus vulgaris, and suggested that the term q2(T )could be generalised because metabolic rates of octopod species have a similar dependence on temperature. To obtain metabolic rate in kJ d–1 as a function of temperature in °C, we re-expressed the equation of Katsanevakis et al. (2005) as:
(12)
where Mis the oxygen consumption rate in kJ d–1, Bis the body mass, Tis the temperature in °C, k1is the con-version factor from mg h–1to kJ d–1, k
2, a2and b2are con-stants and p2is a species-specific metabolic rate expo-nent. Parameter values for a2and b2were imported from Katsanevakis et al. (2005). We estimated p2from Expt 1 for O. ocellatusand Expt 3 for O. pallidus.Coefficients k1 and k2were obtained from the literature (Prosser 1973, Elliott & Davison 1975). Since the original formula was tested in the temperature range 13 to 28°C
(Kat-sanevakis et al. 2005), we determined the function q2(T ) across the temperature ranges 13 to 28°C for O. ocellatus and 13 to 23°C for O. pallidusto avoid extrapolation.
Model estimation of transition body mass and age. We compared the threshold body mass B* and age t* estimated experimentally with model growth projec-tions for B* and t* at the experimental rearing temper-atures of 20 and 25°C for Octopus ocellatusand 14.7 and 16.9°C for O. pallidus.
The relationship between growth pattern and tem-perature was explored by plotting B* and t* as func-tions of temperature between the ranges of 13 and 23°C for Octopus pallidusand 13 and 28°C for O. ocellatus. Additionally, we projected growth trajectories over 100 d with individuals starting from the same hatch size B0, but experiencing different temperature scenarios. We estimated growth trajectories every degree be-tween 13 and 28°C for O. ocellatusand 13 and 23°C for O. pallidus. In this simple simulation, growth was as-sumed to be exponential in form until the transition point. The second slower growth phase was repre-sented as linear and tangential to transition point (t*, B*). Hatch size B0was representative of the species and was set to 0.11 g for O. ocellatus(Segawa & Nomoto 2002) and 0.25 g for O. pallidus(Leporati et al. 2007).
Sensitivity analysis. A sensitivity analysis was per-formed to assess the response of model growth projec-tions to small changes in parameter values. We used the metric of ‘elasticity’, in which the effect of propor-tional (rather than absolute) perturbations on a given output quantity are evaluated (Caswell 2001). Elastic-ity is defined as:
(13)
where SP(%) is the elasticity of the output quantity to a
given % increase in parameter P, x0is the output of the original model and xPis the output of the model modified
for parameter P(Barbeau & Caswell 1999, Lauzon-Guay et al. 2006). Elasticities of B* (critical transition weight) and t* (critical transition age) to independent perturba-tions of dƒ, Tƒopt, ƒopt, p1,a2, b2, p2, d, Toptand moptwere calculated at 2 levels of parameter change, namely at 1 and 5%. To assess the influence of temperature, the analyses were repeated at 4 temperatures across the spe-cies thermal range, namely at 15, 20, 25 and 28°C for Oc-topus ocellatus, and at 13, 16, 18 and 21°C for O. pallidus.
RESULTS
Estimation of transition body mass and age
For both species, there was good agreement between the laboratory observations and the
projec-S x x
x P = P− 0×
0 100
M B T q T B k a b
T k B
p p
,
( ) = ( ) = +
+ ⎛
⎝ ⎞⎠
2 1 2 2
2
2 exp 2
=ƒopt−dƒ2
(
Tƒopt−T)
T>Tƒopt 2q T1( ) = ƒopt−dƒ1
(
Tƒ −T)
2 T <Tƒtions of the model (Table 3). Model estimates for B* and t* for Octopus ocellatus were close to the ob-served values (Table 3), encompassed within the 95% CI at 20°C and just outside the 95% CI at 25°C. O. pallidusdid not display a 2-phase growth pattern dur-ing the 143 d of the experiment and the model pre-dicted that exponential growth would always be sup-ported at the temperatures tested (Table 3). Hence, only results for O. ocellatus are presented for the remaining analyses.
Impact of temperature on growth pattern
The relationships between temperature and thresh-old size and between temperature and threshthresh-old age were not linear. As temperature increases, B* is pro-jected to slowly increase while t* is projected to decrease, so that the transition out of exponential growth would occur at an earlier age but similar body mass (Fig. 5). Beyond 25°C, however, B* and t* are both projected to increase so that the transition from exponential growth would be expected to occur later and at higher body mass.
Projected growth trajectories suggested that higher temperatures do not necessarily translate to higher body mass, with individuals growing at 23°C reaching higher body mass at 100 d than those at 28°C (Fig. 6). Projections at temperatures between 23 and 26°C pro-duced the largest individuals. A 1°C change in envi-ronmental temperature produced a 1 to 15.5% differ-ence in B* and 0.1 to 16.2% in t*, which resulted in a 0.7 to 62.6% difference in body mass at the end of the simulation. Simulation at 13°C suggested that expo-nential growth would always be sustained in the first 100 d.
Model sensitivity
Results from the sensitivity analyses performed with either ±1% or ± 5% parameter changes were similar
and hence for conciseness only the sensitivity analyses for a 1% increase are presented (Fig. 7).
The threshold body mass B* was most sensitive to increases imposed on metabolic rate parameters, in particular to changes in b2and a2. The corresponding transition age t* exhibited a similar sensi-tivity profile. Temperature had the most effect on the sensitivity of B* to changes in the feeding parameter Tƒoptand growth parameter Topt. The sensitivity of B* to changes in metabolic parameters (and most feeding parameters) also increased with temperature, and was more pro-nounced at temperatures in the upper thermal range of the species. The sensi-tivity profile of transition age t* was simi-lar to that of B* but was less influenced by temperature.
Species Temp. B* obs. ± 95% B* sim. t* obs. ± 95% t* sim.
(°C) CI (g) (g) CI (d) (d)
O. ocellatus 20.0 2.5 ± 3.5 5.3 43 ± 27 56.6
25.0 2.3 ± 1.6 5.6 37 ± 12 52.4
O. pallidus 14.7 nt nt nt nt
[image:8.612.305.551.80.231.2]16.9 nt nt nt nt
Table 3. Octopus ocellatusand O. pallidus. Comparison of observed (obs.) with simulated (sim.) threshold body mass B* and transition age t*. nt: no
threshold
0
t*
10 12 14 16 18 20 22 24
110
100
90
80
70
60
50
40 26 28 30 32 8.0
7.5
7.0
6.5
6.0
5.5
5.0
4.5
Temperature (°C)
Tr
ansition body mass
B
* (g)
Tr
ansition a
g
e
t
* (d)
[image:8.612.306.545.283.444.2]B*
Fig. 5. Octopus ocellatus. Model threshold body mass B* and transition age t* as a function of environmental temperature T
0 20 40 60 80 100 120
30
25
20
15
10
5
0
Age (d)
Body mass (g)
23°C 27°C 21°C 28°C 19°C
17°C
15°C
13°C 25°C
Fig. 6. Octopus ocellatus. Projected growth trajectories at selected environmental temperatures. (s): transition point
[image:8.612.58.342.641.721.2]DISCUSSION
The energy balance paradigm reflected appropri-ately the conditions experienced by the animals and the growth pattern of both species, providing realistic estimations of the transition mass B* and transition age
t* when 2-phase growth was detected experimentally. Results reinforce the hypothesis advanced by Forsythe (1993) that changes in environmental temperature as small as 1°C can have significant effect on cephalopod growth. A 1°C increase in temperature in the model implied up to 15.5% change in the threshold body mass for Octopus ocellatus and considerably altered the growth trajectory of individuals.
The model suggests that the influence of tempera-ture on threshold body mass B*, and hence on the shape of individual growth curves, would be mostly driven by metabolism. Sensitivity analyses indicate metabolic rate is the most influential component of the model and will generally more acutely influence
threshold body mass rather than threshold age, as reported for Sepia apamawith the basic energy bal-ance model (Grist & Jackson 2004). More significantly, our analysis suggests that elevated temperature would increase the sensitivity of B* to changes in metabolic rate, which would have important ramifications on the structure of cephalopod populations in the coming decades. The predicted increase in seawater tempera-ture combined with a reduction in seawater pH, due to increasing CO2levels in the oceans, will decrease the ability of cephalopods to bind oxygen for transport (Seibel & Fabry 2003), therefore altering metabolic rate at the individual level. This would impact on the body mass at transition out of exponential growth, possibly affecting size at maturity, and is likely to substantially alter the population dynamics of most cephalopod species.
The reversal in the decreasing trend of t* observed in model projections at higher temperatures is con-nected to the optimal temperature for growth Topt. As temperature increases beyond that point, more energy becomes available from food while overall energy expenditure starts to decrease due to a decline in growth rate, hence delaying both the threshold time and body mass, at least until the optimal temperature for feeding Tƒoptis reached. The accurate estimation of
Toptand Tƒoptis therefore crucial for these type of ener-getic models, but these data are sparse for octopus.
Currently, the lack of a complete range of data on feeding, metabolism and growth for cephalopod spe-cies is an impediment, and models such as the one pre-sented here require drawing parameters from a wide range of species. The estimated transition point being just outside the 95% CI at 25°C for Octopus ocellatus
reflects these unavoidable approximations, and there is a need for concerted efforts to conduct the full range of observations on some species well suited to studies in captivity and representative of major fished species. There is also a need to establish whether temperature affects the metabolic rate and feeding rate exponents
p1and p2for more species than just O. vulgaris (Kat-sanevakis et al. 2005). These exponents are considered temperature-independent in our analysis, but one or both of these parameters could vary with temperature with implications for size or age at transition out of exponential growth.
Energetic information on wild cephalopods is noto-riously difficult to obtain. Average growth rate (Pecl 2004, Leporati et al. 2008) and aspects of metabolism (O’Dor et al. 1994, Webber et al. 2000, O’Dor 2002, Aitken et al. 2005) have successfully been estimated for a few species, but feeding data remains largely inaccessible. Carefully conducted laboratory studies with animals fed ad libitum and subject to minimal human interaction, as was the case for Octopus
ocel-–12 –10 –8 –6 –4 –2 0 2 4 6
–12 –10 –8 –6 –4 –2 0 2 4 6
df Tfopt
fopt
p1
a2
b2
p2
d Topt
mopt
Sensitivity B*
Sensitivity t*
Gr
owth
Metabolism
Feeding
df Tfopt
fopt
p1
a2
b2
p2
d Topt
mopt
Gr
owth
Metabolism
Feeding
15°C 20°C 25°C
28°C
15°C 20°C 25°C
[image:9.612.54.291.84.395.2]28°C
Fig. 7. Octopus ocellatus. Sensitivity to small perturbations in feeding, metabolism and growth rate parameters of (a) B* and (b) t* at 15, 20, 25 and 28°C. Elasticity was measured as the proportional change in B* (body mass threshold size) or t* (age at threshold size) resulting from a 1% increase in each
latusin the present study, are thought to be represen-tative of feeding and growth rates of wild animals (Wells & Clarke 1996), and remain the only option to fully parameterise energetics models for wild cephalo-pods. Field studies may never elucidate whether or not cephalopods demonstrate a 2-phase growth pat-tern in the wild. Growth curves that adequately rep-resent the behaviour of a population mean can very poorly describe the pattern followed by any individual in that population (Alford & Jackson 1993). Further-more, while statolith (Jackson 1990) and stylet incre-ment analyses (Doubleday et al. 2006, Leporati et al. 2008) provide insights into individual growth rate integrated over the life span, the lack of a relationship between increment width and daily growth rate (Jackson & Moltschaniwskyj 2001) renders the detec-tion of a change in growth difficult and the re-con-struction of individual growth curves impossible (Arkhipkin 2005). The present study suggests that a transition out of exponential growth is not a compul-sory phase, and it may occur late, as seen for O. ocel-latusat lower temperatures, or not at all, as seen for
O. pallidus.
The model presented in the present paper is the first to include both body size and temperature-dependence in the overall energy budget of cephalo-pods and is adaptable to both squid and cuttlefish species. The incorporation of periodic variation in temperature to simulate seasonal water temperature would allow the inclusion of the ‘Forsythe effect’ (Forsythe 1993, 2004) and provide a better represen-tation of the individual growth trajectories that are followed in natural populations. Individual variability could also be incorporated as stochastic variations in initial hatching size, which is known to significantly influence growth trajectory during the exponential phase (Pecl et al. 2004, Leporati et al. 2007). Such a model would permit a more in-depth exploration of population dynamics in natural cephalopod popula-tions with great potential for improving fishery man-agement by predicting population structure under prospective food and temperature scenarios. On a wider scale, this type of analyses could be used to predict how climate change might affect key cephalo-pod species. The negative impact of increasing pH, linked to ocean warming, could be incorporated in the metabolism term of the energy balance equation, enabling predictions about population abundance and structure under different climate change scenar-ios. Moreover, these types of models have the capac-ity to predict optimum conditions for potentially com-petitive species and could be a powerful tool for understanding both the evolution of species and for predicting how climate change might affect species distribution.
Acknowledgements. We are grateful to S. Tracey, S. Foster and J. Clapcott for their advice on various aspects of this pro-ject. Experiments on Octopus palliduscomplied with current Tasmanian and Australian laws and were approved by the Animal Ethics Committee of the University of Tasmania under project no. A0008385. Experiments on O. ocellatusconformed to relevant local animal welfare laws, guidelines and policies.
LITERATURE CITED
Aguado Giménez F, García García B (2002) Growth and food intake models in Octopus vulgarisCuvier (1797): influ-ence of body weight, temperature, sex and diet. Aquacult Int 10:361–377
Aitken JP, O’Dor RK, Jackson GD (2005) The secret life of the giant Australian cuttlefish Sepia apama (Cephalopoda): behaviour and energetics in nature revealed through radio acoustic positioning and telemetry (RAPT). J Exp Mar Biol Ecol 320:77–91
Alford RA, Jackson GD (1993) Do cephalopods and larvae of other taxa grow asymptotically? Am Nat 141:717–728 André J, Pecl GT, Semmens JM, Grist EPM (2008) Early
life-history processes in benthic octopus: relationships be-tween temperature, feeding, food conversion, and growth in juvenile Octopus pallidus. J Exp Mar Biol Ecol 354: 81–92
Arkhipkin AI (2005) Statoliths as ‘black boxes’ (life recorders) in squid. Mar Freshw Res 56:573–583
Arkhipkin AI, Roa-Ureta R (2005) Identification of ontoge-netic growth models for squid. Mar Freshw Res 56: 371–386
Barbeau MA, Caswell H (1999) A matrix model for short-term dynamics of seeded populations of sea scallops. Ecol Appl 9:266–287
Bartsch J (2002) Modelling the temperature mediation of growth in larval fish. Fish Oceanogr 11:310–314
Boyle PR, Knobloch D (1984) Male reproductive maturity in the octopus, Eledone cirrhosa (Cephalopoda: Octopoda). J Mar Biol Assoc UK 64:573–579
Boyle P, Rodhouse PG (2005) Cephalopods ecology and fish-eries. Blackwell Science, Oxford
Calow P (1987) Fact and theory — an overview. In: Boyle PR (ed) Cephalopod life cycles, Vol 2. Academic Press, Lon-don, p 351–366
Caswell H (2001) Matrix population models: construction, analysis and interpretation. Sinauer Associates, Sunder-land, MA
Clarke MR (1996) The role of cephalopods in the world’s oceans: an introduction. Philos Trans R Soc Lond B Biol Sci 351:979–983
Cortez T, Castro BG, Guerra A (1995) Reproduction and con-dition of female Octopus mimus(Mollusca: Cephalopoda). Mar Biol 123:505–510
Crowley R (1999) Hydrochemistry operations manual. Report no. 236. CSIRO, Hobart
Daly HI, Peck LS (2000) Energy balance and cold adaptation in the octopus Pareledone charcoti.J Exp Mar Biol Ecol 245:197–214
Domain F, Jouffre D, Caverivière A (2000) Growth of Octopus vulgaris from tagging in Senegalese waters. J Mar Biol Assoc UK 80:699–705
Doubleday ZA, Semmens JM, Pecl GT, Jackson GD (2006) Assessing the validity of stylets as ageing tools in Octopus pallidus.J Exp Mar Biol Ecol 338:35–42
Elliott JM, Davison W (1975) Energy equivalents of oxygen consumption in animal energetics. Oecologia 19:195–201
➤
➤
➤
➤
➤
➤
➤
➤
➤
➤
➤
➤
➤
FAO (2005) Global production statistics 1950–2005. FAO, Rome. Available at: www.fao.org/fishery/statistics/global-production (accessed Nov 15, 2007)
Forsythe JW (1993) A working hypothesis of how seasonal temperature change may impact the field growth of young cephalopods. In: Okutani T, O’Dor RK, Kubodera T (eds) Recent advances in fisheries biology. Tokai University Press, Tokyo, p 133–143
Forsythe JW (2004) Accounting for the effect of temperature on squid growth in nature: from hypothesis to practice. Mar Freshw Res 55:331–339
Forsythe JW, Hanlon RT (1988) Effect of temperature on lab-oratory growth, reproduction and life span of Octopus bimaculoides.Mar Biol 98:369–379
Forsythe JW, Van Heukelem WF (1987) Growth. In: Boyle PR (ed) Cephalopod life cycles, Vol 2. Academic Press, Lon-don, p 135–156
Gillooly JF, Brown JH, West GB, Savage VM, Charnov EL (2001) Effects of size and temperature on metabolic rate. Science 293:2248–2251
Grist EPM, Jackson GD (2004) Energy balance as a determi-nant of two-phase growth in cephalopods. Mar Freshw Res 55:395–401
Hatfield EMC, Hanlon RT, Forsythe JW, Grist EPM (2001) Laboratory testing of a growth hypothesis for juvenile squid Loligo pealeii (Cephalopoda: Loliginidae). Can J Fish Aquat Sci 58:845–857
Jackson GD (1990) Age and growth of the tropical nearshore Loliginid squid Sepioteuthis lessonianadetermined from statolith growth-ring analysis. Fish Bull 88:113–118 Jackson GD, Moltschaniwskyj NA (2001) The influence of
ration level on growth and statolith increment width of the tropical squid Sepioteuthis lessoniana(Cephalopoda: Loliginidae): an experimental approach. Mar Biol 138: 819–825
Jackson GD, O’Dor RK (2001) Time, space and the ecophysi-ology of squid growth, life in the fast lane. Vie Milieu 51: 205–215
Joll LM (1977) Growth and food intake of Octopus tetricus (Mollusca: Cephalopoda) in aquaria. Aust J Mar Freshw Res 28:45–56
Katsanevakis S, Stephanopoulou S, Miliou H, Moraitou-Apos-tolopoulou M, Verriopoulos G (2005) Oxygen consumption and ammonia excretion of Octopus vulgaris (Cephalo-poda) in relation to body mass and temperature. Mar Biol 146:725–732
Kleiber M (1932) Body size and animal metabolism. Hilgardia 6:315–353
Kleiber M (1947) Body size and metabolic rate. Physiol Rev 27:511–541
Lauzon-Guay JS, Barbeau MA, Watmough J, Hamilton DJ (2006) Model for growth and survival of mussels Mytilus edulisreared in Prince Edward Island, Canada. Mar Ecol Prog Ser 323:171–183
Leporati SC, Pecl GT, Semmens JM (2007) Cephalopod hatchling growth: the effects of initial size and seasonal temperatures. Mar Biol 151:1375–1383
Leporati SC, Semmens JM, Pecl GT (2008) Determining the age and growth of wild octopus using stylet increment analysis. Mar Ecol Prog Ser 367:213–222
Lindstrom MJ, Bates DM (1990) Nonlinear mixed effects mod-els for repeated measures data. Biometrics 46:673–687 Major GA, Dal Pont G, Klye J, Newell B (1972) Laboratory
techniques in marine chemistry, a manual. Report no. 51. CSIRO, Cronulla
Mangold K (1983) Food, feeding and growth in cephalopods. Mem Natl Mus Victoria 44:81–93
Mangold K (1987) Reproduction. In: Boyle PR (ed) Cephalo-pod life cycles, Vol 2. Academic Press, London, p 157–200 Mangold K, von Boletzky S (1973) New data on reproductive biology and growth of Octopus vulgaris.Mar Biol 19:7–12 McKinney RA, Glatt SM, Williams SR (2004) Allometric length–weight relationships for benthic prey of aquatic wildlife in coastal marine habitats. Wildl Biol 10:241–249 O’Dor RK (2002) Telemetered cephalopod energetics: swim-ming, soaring and blimping. Integr Comp Biol 42: 1065–1070
O’Dor RK, Wells MJ (1987) Energy and nutrient flow. In: Boyle PR (ed) Cephalopod life cycles, Vol 2. Academic Press, London, p 109–133
O’Dor RK, Hoar JA, Webber DM, Carey FG, Tanaka S, Mar-tins HR, Porteiro FM (1994) Squid (Loligo forbesi) perfor-mance and metabolic rates in nature. Mar Freshw Behav Physiol 25:163–177
O’Dor RK, Aitken JP, Jackson GD (2005) Energy balance growth models: applications to cephalopods. Phuket Mar Biol Cent Res Bull 66:329–336
Pecl GT (2004) The in situ relationships between season of hatching, growth and condition in the southern calamary, Sepioteuthis australis.Mar Freshw Res 55:429–438 Pecl GT, Steer MA, Hodgson KE (2004) The role of hatchling
size in generating the intrinsic size-at-age variability of cephalopods: extending the Forsythe hypothesis. Mar Freshw Res 55:387–394
Perez JAA, Haimovici M (1991) Sexual maturation and repro-ductive cycle of Eledone massyae, Voss 1964 (Cephalo-poda: Octopodidae) in southern Brazil. Bull Mar Sci 49: 270–279
Perez MC, Lopez DA, Aguila K, Gonzalez ML (2006) Feeding and growth in captivity of the octopus Enteroctopus mega-locyathusGould, 1852. Aquac Res 37:550–555
Petza D, Katsanevakis S, Verriopoulos G (2006) Experimental evaluation of the energy balance in Octopus vulgaris, fed ad libitumon a high-lipid diet. Mar Biol 148:827–832 Prosser CL (1973) Comparative animal physiology. WB
Saun-ders, Philadelphia, PA
Ricker WE (1979) Growth rates and models. In: Hoar WS, Randall DJ, Brett JR (eds) Fish physiol, Vol VIII. Bioener-getics and growth. Academic Press, New York, p 677–743 Segawa S, Nomoto A (2002) Laboratory growth, feeding, oxy-gen consumption and ammonia excretion of Octopus ocel-latus.Bull Mar Sci 71:801–813
Seibel BA, Fabry VJ (2003) Marine biotic response to elevated carbon dioxide. In: Hannah L, Lovejoy T (eds) Climate change and biodiversity: synergistic impacts, Vol 4. Cen-ter for Applied Biodiversity Science, Conservation InCen-ter- Inter-national, Washington, DC, p 59–67
Semmens JM, Pecl GT, Villanueva R, Jouffre D, Sobrino I, Wood JB, Rigby PR (2004) Understanding octopus growth: patterns, variability and physiology. Mar Freshw Res 55: 367–377
Van Heukelem WF (1973) Growth and life-span of Octopus cyanea(Mollusca:Cephalopoda). J Zool 169:299–315 von Bertalanffy L (1957) Quantitative laws in metabolism and
growth. Q Rev Biol 32:217–231
Webber DM, Aitken JP, O’Dor RK (2000) Costs of locomotion and vertic dynamics of cephalopods and fish. Physiol Biochem Zool 73:651–662
Wells MJ, Clarke A (1996) Energetics: the costs of living and reproducing for an individual cephalopod. Philos Trans R Soc Lond B Biol Sci 351:1083–1104
Wells MJ, O’Dor RK, Mangold K, Wells J (1983) Feeding and metabolic rate in octopus. Mar Behav Physiol 9:305–317 West GB, Brown JH, Enquist BJ (1997) A general model for
the origin of allometric scaling laws in biology. Science 276:122–126
Winberg GC (1956) Rate of metabolism and food require-ments of fishes. Belorussian State University, Minsk
(translated from Russian by Fish Res Board Can Transl Serv no. 194, 1960)
Zeuthen E (1953) Oxygen uptake as related to body size in organisms. Q Rev Biol 28:1–12
AIM
The dependence of metabolic rate Mon body mass Bis characterised by an allometric scaling law of the form M= q2Bp2. The purpose of the experiment was to estimate the
species’ metabolic rate exponent p2.
METHODS
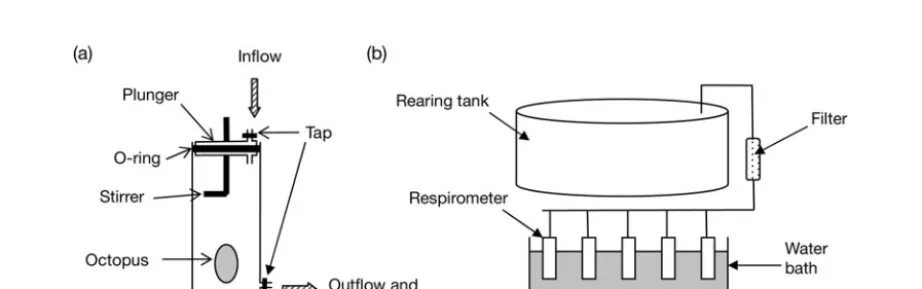
We reared pale octopus Octopus pallidushatchlings from eggs in 250 l stock tanks under fluorescent lighting repli-cating natural daylight (06:00 to 18:00 h light, 18:00 to 06:00 h dark), and measured the oxygen consumption of 2 juveniles on 3 occasions at age 94, 134 and 148 d. All mea-surements were taken between 10:00 and 15:00 h while the animals were in post-digestive conditions (at least 12 h after feeding). Animals were placed in individual 600 ml clear plastic respirometers and a gentle flow of oxy-genated water was passed through the respirometer for a period of 1 h in order to acclimatise the octopuses before measurements were taken (Fig. A1a). Care was taken to ensure that no air bubbles were trapped in the chambers. The water used in the respirometers was the same as that from the rearing tanks and was filtered (10 μm) before entering the chambers (Fig. A1b). Respirometers were immersed in a controlled-temperature water bath to main-tain a constant temperature of 18°C for the duration of the experiment. Five respirometers were set up for each temperature treatment (4 with octopus and 1 blank). Respirometers were attributed randomly to octopuses to avoid any bias. After the acclimatisation period, respirom-eters were sealed by closing both taps. To ensure complete
homogeneity of the sample, water was slowly mixed with a clear stirrer for 20 s before each sampling. This manipu-lation did not seem to disturb the octopus, which did not display any colour changes, rapid movements or notice-able increase in ventilation.
Water was sampled through the outflow with a 20 ml syringe, ensuring that no air was drawn into the syringe. The outflow tap was opened and the plunger slowly pressed to expel water samples. The first 5 ml of water expelled was discarded as this corresponded to still water sitting in the outflow tube. The duration of the experiment was 180 min for the measurements at 94 d and 120 min for the measurements at 134 and 148 d. Water samples for oxygen analysis and temperature measurements were removed hourly. Oxygen concentration was determined using a modified Winkler titration method (Major et al. 1972, Crowley 1999). In the modified method, volume was scaled down to 20 ml and manganese sulphate solution and potassium iodide/sodium hydroxide solution were micropipetted directly into the syringe. Duplicate titrations were carried out for each sample (two 10 ml titrations). All volumes of water extracted during the experiment were recorded precisely to correct the subsequent oxygen concentrations for volume. Oxygen consumption rate was calculated in μl O2g octopus–1h–1and converted to
kJ d–1.
RESULTS AND CONCLUSION
Oxygen consumption rate in kJ d–1was expressed as M=
0.0546B0.8774(Fig. A2) and we hence estimated p 2at 0.88
for Octopus pallidus.
Appendix 1. Oxygen consumption of juvenile pale octopus Octopus pallidus
Fig. A1. (a) Respirometer design and (b) experimental setup for the oxygen consumption experiment
[image:12.612.75.536.550.694.2]Appendix 1 (continued)
Fig. A2. Octopus pallidus. Oxygen consumption Mas a function of body weight Bfor juvenile octopus at 18°C 0
0.05 0.1 0.15 0.2 0.25
0 0.5 1 1.5 2 2.5 3 3.5 4 4.5 5
Wet body weight (g)
Re
s
p
ira
ti
o
n
ra
te
(
k
J d
–1)
M = 0.0546B 0.8774 r2 = 0.8644
Editorial responsibility: Yves Cherel, Villiers-en-Bois, France