Note:
This article will be published in a forthcoming issue of
the
Journal of Physical Activity & Health
. This article appears
here in its accepted, peer-reviewed form, as it was provided
by the submitting author. It has not been copy edited, proofed,
or formatted by the publisher.
Section: Original Research
Article Title: Effects of School-Based Physical Activity Program on Students’ Moderate to Vigorous Physical Activity and Perceptions of Physical Competence
Authors: Arto Gråstén1, Anthony Watt2, Jarmo Liukkonen3, and Timo Jaakkola3
Affiliations: 1Faculty of Education, University of Tasmania, Launceston, Tasmania, Australia. 2College of Arts and Education, Victoria University, Melbourne, Victoria,
Australia. 3Faculty of Sport and Health Sciences, University of Jyväskylä, Jyväskylä, Finland. Running Head: Physical Activity as Civil Skill Program
Journal: Journal of Physical Activity & Health
Acceptance Date: February 14, 2017
©2017 Human Kinetics, Inc.
Full title: Effects of school-based physical activity program on students’ moderate to vigorous physical activity and perceptions of physical competence
Running head: Physical Activity as Civil Skill Program Manuscript type: Original research
Abstract word count: 198 Manuscript word count: 7311
Authors:
Arto Gråstén (Corresponding author), PhD, MEd, Lecturer, ([email protected]), Faculty of Education, University of Tasmania, Locked Bag 1307, Launceston, Tasmania, Australia, 7250. Tel: +613 6324 3265
Anthony Watt, PhD, Associate Professor, ([email protected]), College of Arts and Education, Victoria University, P.O. Box 14428, Melbourne, Victoria, Australia, 8001.
Jarmo Liukkonen, PhD, Professor, ([email protected]), Faculty of Sport and Health Sciences, University of Jyväskylä, P.O. Box 35 (L), Jyväskylä, Finland, 40014.
Timo Jaakkola, PhD, Adjunct Professor, ([email protected]), Faculty of Sport and Health Sciences, University of Jyväskylä, P.O. Box 35 (L), Jyväskylä, Finland, 40014.
ABSTRACT
Background: The study examined the effects of school-based program on students’ self-reported moderate to vigorous physical activity and physical competence, and associated links to gender, grade, body mass index, and physical education assessments. Methods: Participants were 240 middle school students (143 intervention, 97 control) from three small cities in North-East Finland. The intervention group received task-involving climate support in physical education classes and additional physical activities during school days across one year. Results: The intervention group’s physical competence increased, whereas the control group’s competence remained stable across the period. However, physical activity levels were stable in both groups. The findings also showed that body mass index was negatively associated with physical competence and activity in the intervention group at the follow-up measure. Physical education assessments were positively related with only the baseline scores of physical competence in the intervention group. In contrast, the assessments had positive relationships with physical competence and activity of control group students. Conclusions: The present program was an effective protocol to increase student’s perceptions of physical competence. Since the quantity of school physical education including recess activities cannot be dramatically increased, positive learning experiences should be provided, and thus, support perceptions of physical competence.
Keywords: intervention study, public health, physical education, physical activity assessment
Promoting regular physical activity has become an ongoing societal challenge1 that is clearly evidenced in the decreasing physical activity levels of school-aged children in several Western, African, and Asian populations.2,3 School physical education (PE) represents a cost-effective framework from which to stimulate engagement in physical activity because an underlying link already exists within that curriculum domain and there is the potential to directly reach all cohorts of children and youth.4,5 Furthermore, students with positive perceptions of physical competence in PE are more likely to perceive their physical activity related experiences as positive, thus, leading them toward being more physically active.6 Most school-based physical activity interventions implemented in the 2000s were not designed to collect follow-up data regarding psychological outcomes, for instance perceived physical competence, so that the long-term impacts could be extensively determined.7 This paper examined the effects of the school-initiated Physical Activity as Civil Skill Program8 on middle school students’ moderate to vigorous physical activity (MVPA), perceptions of physical competence, and associations with body mass index (BMI) and PE assessments.
In the present paper, physical competence refers to the student’s beliefs about their physical ability to be successful in physical activities9 and MVPA is defined as any muscular movement which requires energy expenditure, causes rapid breathing, and noticeably accelerates the heart rate.10 The Physical Activity as Civil Skill Program8 was based on the Achievement Goal Theory (AGT)11 and the Social Ecological Model (SEM).12 Adopting the certain constructs of both AGT and SEM, is a useful method for determining how students that may vary in their perceptions of the social-cognitive determinants of exercise motivation (e.g. physical competence) differ in their participation in MVPA.13 Specifically, the AGT provides a viable model to understand the association between the social-cognitive environment and behavior, as demonstrated through the interactions of motivational climate and physical competence in PE. In contrast, the SEM considers the relationships between students’
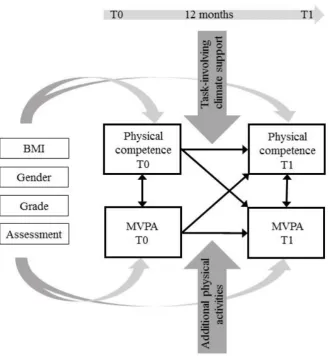
individual characteristics, physical environment, and MVPA participation. Thus, a central assumption of the program was that middle school students’ physical competence and MVPA can be enhanced by providing task-involving climate support in PE classes grounded on AGT and additional physical activities provided during school days and incorporating the features
of SEM, to motivate and provide opportunities for MVPA.
Task-involving climate support was implemented to develop students’ physical
competence through motivational climate in PE classes. According to the AGT, two types of motivational climate exist, a task-involving climate (psychological climate that supports personal development, leaning, cooperation, and effort) and an ego-involving climate (supports normative evaluation, competition, and defeating others).14 Positive development of physical competence, as represented by perceived personal physical ability,6 is most likely to occur if the motivation climate in school PE is more task-involving.15-17 In contrast, ego-involving climate in PE has shown either a neglible correlation13 or negative correlation with physical competence.15 Previous intervention studies in PE contexts demonstrated that students’ perceived competence towards physical activity increased when emphasizing task-involving teaching practices.18,19 For instance, after a seven-month intervention involving 374 Greek middle school students, a task-focused intervention group reported higher levels of perceived physical competence. Students worked at their own skill level (i.e. throwing basketball from different distances), selected their own teammates in order to promote social interaction, led activities, and were praised for exerting effort and participating in both the class and out-of-school physical activities, evaluated themselves based on self-referenced criteria, dictated the pace of learning based on their needs and interests, and decided when to move on to the next drill.18 Typically, boys score higher than girls in physical competence,20-22 and students with low BMI have higher perceptions of physical competence.23 In addition, PE has regularly been evaluated in Finnish schools using graded assessments from failed (4) to excellent (10).24
However, graded assessments based on students’ physical skills and performance, have been reported as contributing to a reduction in the perception of physical competence, especially among students with low physical activity levels.25 The possible link between physical competence and these assessments is widely unknown. Thus, it is important to consider gender, BMI, and assessments, when examining the development of physical competence and its relations with MVPA participation in school context.
Additional physical activities were facilitated by developing the school physical
environment to increase MVPA during school days, based on the features of the SEM. Precisely, the model comprises intra-individual and inter-individual levels in an activity.12 The intra-individual level identifies students’ individual beliefs (e.g. physical competence) and behavior (e.g. MVPA engagement), whereas the inter-individual level recognizes the physical and social school environments (e.g. opportunities being physically active, social relationships). Recess activities during school days (as provided in the current program), could be improving attitudes or efforts toward physical activities at the intra-individual level, whereas changes at the inter-individual level could be implemented by providing facilities and equipment for activities to enhance MVPA participation. Several school-based interventions have demonstrated successful outcomes in terms of increasing students’ MVPA participation by providing motivational support at the intra-individual level and through implementation of physical activities at the intra-individual level.19,26-30 For instance, as an outcome of a curriculum focused two-year program implemented among 1578 middle school students in Southern California, MVPA increased 18% in the intervention schools. The intervention consisted of the use of additional curricular materials, staff professional development, and on-site follow-up, whereas control schools maintained the usual program delivery model.27 Similarly, for a sample of 146 sedentary adolescent girls in the U.S., participation in vigorous activity increased 32% across a nine-month intervention when the girls engaged in supervised
activities four times per week and received instructions for out-of-school physical activity once per week.28 The interventions considered above introduced a range of approaches to increase MVPA during school days. However, none of these investigations were designed to collect follow-up data regarding both psychological outcomes and MVPA engagement. Hence, a school-based program providing physical competence support at the intra-individual level and additional activities at the inter-individual level is needed.
Given the rising trend in obesity,31 and age-related decrease in MVPA during adolescence,2 and a need for school-based programs including follow-up data of psychological outcomes,7 it is important to investigate the longitudinal relationships between MVPA and physical competence across a school-initiated program, so that the long-term impacts of intervention could be extensively determined.7 Only a limited set of studies have considered the interrelationships of MVPA, BMI and psychological variables (e.g. physical competence, enjoyment), emphasizing the need for longitudinal studies that could reveal causal relationships between BMI status and MVPA engagement and psychological determinants of MVPA.32 Furthermore, no studies were identified that considered the relationships between MVPA and PE assessments. The current study therefore, was designed to investigate the relationships of MVPA and physical competence associations with BMI and PE assessments. Physical competence and MVPA related differences in gender, BMI, and PE assessments were examined, since boys have previously been shown to be more physically active,33,34 report higher physical competence than girls,20-22 in addition to age,33,34 higher BMI,23 and lower PE assessment25 related declines in MVPA participation and physical competence.
The aims of the study were 1) to investigate the relationships of MVPA and physical competence in the intervention and control groups, 2) to investigate whether MVPA participation and physical competence would be different between intervention and control groups, and 3) to explore whether there are differences in MVPA participation and physical
competence in respect to correlates such as gender, grade, BMI, and PE assessment. It was assumed that MVPA and physical competence would strongly associate across the assessment period. In addition, MVPA participation and physical competence should increase across the intervention group students and decrease or remain stable in control group students across the program. Finally, students with lower BMI and higher assessment were expected to be more physically active than students with higher BMI and lower assessment.
Methods
Participants
The total sample comprised 240 (143 intervention, 97 control) students aged 13 to 16 years (14.48 ± 0.99, mean ± SD) from three small cities located in North-East Finland. All Grade 7 and 8 students were invited to participate through a direct contact with school principals. Twenty-four percent of students at this age in the region participated in the study. The human participants’ approval statement was obtained from the ethics committee of the local university. Permission to participate in the study was also obtained from all students and their parents by a written request. Participation was voluntary and no extra credit was awarded
for participation. Schools were not randomized, principals and teachers of three schools
decided to organize the intervention activities and one school participated in the intervention
as a control school. In total, forty-six teachers (22 intervention, 24 control) aged from 30 to 60
years participated in the study and 61% of them had teaching experience more than ten years.
All teachers of the intervention schools contributed their time to organize the school break
activities and eight PE teachers were in charge of implementing the task-involving climate
support in PE classes.
Procedure
The longitudinal data were collected using online questionnaires in April 2012 and
April 2013. Students completed the questionnaires under the supervision of the teachers during 45-minute classes in the schools’ computer labs. The participants were advised to ask for help if confused concerning either the instructions or the clarity of a particular item. To minimize the tendency to give socially desirable responses, students were encouraged to answer honestly and were assured that their responses were confidential. Students were told that they were allowed to terminate their participation at any time. All students who provided complete data across two measurement points were included into the present study.
School-based program
The Physical Activity as Civil Skill Program8 was based on the previously established assumptions that physical competence and MVPA and can be influenced by psychological and physical enhancements. The core content of the program was designed in two workshops by a team possessing relevant expertise including program staff, teachers, school healthcare
personnel, policy-makers, school PE and sport experts from the university, and local sport
clubs. The features of the AGT and SEM were used as practical tools to establish more
opportunities for daily physical activities, to improve social support, perceived physical
competence in order to foster greater levels of MVPA in intervention students. In the
beginning, teachers were asked to give suggestions to implement the program in practical
terms. The purpose was to list all best practices together in order to help all schools to improve
their school day physical activities. The teacher education was organized by the program staff.
In addition, experts were involved in the practical sessions, such as the functional
demonstration of apparatus gymnastics. In total, 26 practical education sessions of 90 to
120-minutes in duration were completed over the two-year period of 2011-2013. The teachers
participated in the supplemental training sessions voluntarily or in the minority of cases as a part of teachers’ collective bargaining agreement for supplemental training. Consequently, most teachers (61%) participated in the supplement training at least once. In particular, PE
teachers from the intervention schools participated in four 90-minute workshops to extend and
develop their current PE teaching practices. The teachers were also given written material on PE motivation, physical competence, and task-involving teaching practices. The intervention was operationalized between program staff and teachers and between teachers and students.
Two full-time employees were responsible for organizing the teacher and parent consultation
including practices, teacher training, public communication, and supervision. The task of the
researchers was to implement the systematic follow-up study for the key variables. Researchers
did not attempt to control the intervention either at program staff-teacher level or
teacher-student level. It was solely based on the teachers’ written feedback and notes. Additionally, the
program staff monitored the school breaks twice a month. The program included task-involving climate support and additional physical activities, starting in April 2012 and continuing until April 2013. This schedule was the preference of the school principals and teachers as well as their participation as an intervention or a control school.
Task-involving climate support comprised teacher training, since their actions play a
crucial role in promoting physical competence in PE classes. Teachers were given supplemental training to increase students’ physical competence. The workshops and practices had the following elements: 1) Task-involving teaching practices (students work together within a small cooperative group structure, students are responsible for setting up equipment, during class time students dictate the rate of progression through specific practices), 2) Physical
competence support (assessment emphasizes individual improvement, experiences of learning, and success), 3) Improving students’ personal skills (students choose practices from a range of
offered practices with different skill requirements, more activity and less waiting during PE
classes), and 4) Positive feedback and encouragement (recognition and feedback is based on
the individual progress).
Additional physical activities consisted of the following actions: 1) Extended break
(daily extended break of 30 minutes in addition to the lunch break and regular breaks), 2)
Access to fitness hall (students were allowed to use fitness facilities during the extended and regular breaks in order to exercise or play games), 3) Supervised ballgames (i.e. floorball,
indoor soccer, basketball, badminton, table tennis); students were responsible for setting up ballgames and refereeing during extended breaks (i.e. 5 days x 30 minutes x 12 weeks) under the teachers’ supervision, 4) Equipment supply (exercise equipment were available to all
students during the extended and regular breaks, students were responsible for setting up equipment). The intervention group received school-based activities across one school year, whereas control group participated in the regular PE classes following the guidelines of the Finnish national curriculum.24 For more detailed information about the program, a thorough report should be consulted.35
Measures
The fidelity of task-involving climate implementation
The fidelity of task-involving climate implementation was measured using the Motivation Climate in Physical Education Scale (MCPES).36 The individual item stem was “In
my PE class…” The task-involving climate dimension consisted of five items (e.g. It is important for students to try their best in PE classes), and the ego-involving climate dimension included four items (e.g. It is important for students to succeed better than others in PE
classes). Responses were indicated on a five-point Likert-scale ranging from strongly disagree (1) to strongly agree (5). Recently, the confirmatory factor analysis (TLI = 0.96, CFI = 0.98,
RMSEA = 0.06) and composite reliability (0.86) supported the construct validity of the scale for Finnish middle school students.35
Background variables
Gender and grade were asked using structured questions. The introduction preceding the items was: “Read each question carefully. Using the given options, please circle the number
that best describes your personal qualities.” School administrators were consulted in order to
gather students’ PE assessments using the scale, failed (4) to excellent (10), approved by the
Finnish National Board of Education.24 Graded assessments represented students’ physical, social, and psychological performance, skills, effort, and knowledge in PE classes evaluated objectively by the PE teachers. Height and weight were measured using digital equipment by the school nurses through the annual health inspection provided to all students. BMI was calculated using weight and height (kg/m2), based on the cut-off points for 12 to 16 years old girls (22.14 to 24.54) and boys (21.56 to 24.19) presented by Cole et al.37
MVPA
Self-reported MVPA was examined using the Health Behavior in School-aged Children Research Protocol.38 The scale incorporated a modified version of the MVPA measure.39 The introduction preceding the items was: “In the next two questions physical activity means all
activities which raises your heart rates or momentarily get you out of breath for example in
doing exercise, playing with your friends, going to school, or in school PE. Sport also includes for example jogging, intensive walking, roller skating, cycling, dancing, skating, skiing, soccer,
basketball and baseball.” The items required students to summarize their time spent in MVPA
each day in the following way: 1) “When you think about your typical week, on how many days
are you physically active for a total of at least 60 minutes per day?” and 2) “Over the past 7
days, on how many days were you physically active for a total of at least 60 minutes per day?”
Both items rated on an eight-point response scale (0 to 7 days). The mean score of the two items was used as students’ MVPA score. To improve the reliability of self-reports, the frequency of days exceeding 60 minutes of MVPA were also collected using accelerometers from the smaller sample (n = 96) among the same students as in the present study. Single-axial Polar Active monitors were small, easy to use, and worn on the wrist. The accelerometer-determined data based on the cut-off points presented by the manufacturer (moderate 3.50 to 5 MET, vigorous 5 to 8 MET). The monitors detected the intensity of the movements at ten second intervals and displayed minutes spent in MVPA on a daily basis. The frequency of days exceeding 60 minutes of MVPA for each student was determined and used as standardized MVPA scores in order to compare the self-reported and accelerometer-based scores. Students had the procedures explained to them verbally, including a brief overview of possible physical
discomfort that could be caused from wearing an accelerometer. Students worn accelerometers during waking hours across a seven-day period. The devices were calibrated and the data was processed by the researchers. The Polar monitors have been validated in both children and adolescents.40
Perceived physical competence
Perceived physical competence was investigated using the Physical Self-Perception Profile (PSPP).41 The item stem was "What am I like?” The subscale consisted of five items (e.g. “I am confident in PE”) and students responded to each item using a five-point
Osgood-scale from “I’m among the best when it comes to athletic ability” (1) to “I’m not among the best when it comes to athletic ability” (5). Higher values reflected higher perceived physical competence. The mean score of the five items represented students’ perceived physical competence score. Gråstén showed that the composite reliability of the factor loadings was
0.90 and the confirmatory factor analysis supported the construct validity of the scale (TLI = 0.97, CFI = 0.98, RMSEA = 0.07).35
Data analysis
First, normal distribution, outliers, and missing values of the data were examined. No modifications due to normality or outliers were required.42 The data included 2.7% of missing values. Little’s Missing Completely at Random Test (MCART) ( = 45.184, df = 38, p = 0.197)
indicated that the missing values were not systematic. Therefore, the missing values were assumed to be missing completely at random.43 The descriptive statistics including correlation coefficients, means, standard deviations, and Cronbach alphas were determined. The fidelity of task-involving climate implementation was analyzed using independent sample t-tests between T0 and T1 measurements.
The mean differences between self-reports and objective scores of days exceeding 60 minutes of MVPA were tested using paired sample t-tests.
Finally, to answer to the research questions, 1) the associations between physical competence and MVPA at T0 and T1 were tested using the cross-lagged model, 2) the intervention effects on physical competence and MVPA were tested by calculating mean differences between time points T0 and T1 at p < .05 level, and 3) gender, grade, assessment,
and BMI were added into the model as correlates. The proportion of variance predicted by the observed variables were analyzed using squared multiple correlations (R2). Fig. 1 presents the theorized model of physical competence and MVPA.
Using the maximum likelihood parameter estimator with robust standard errors (MLR), the cross-lagged model was performed. Chi-square test (χ2) was used as a test of the model’s overall goodness-of-fit to the data. A non-significant difference between observed frequency distribution and theoretical distribution had an acceptable fit to the data. To determine the
appropriateness of the model the standardized root mean square residual (SRMR) and the root mean square error of approximation (RMSEA), the comparative fit index (CFI), the Tucker-Lewis index (TLI) were also examined.44 A value less than 0.06 for SRMR is generally considered as a good model fit and a value of 0.08 or less for the RMSEA indicate a reasonable error of approximate fit.45,46 The CFI and TLI indices range from 0 to greater than 1. Fit indices greater than 0.95 are indicative for an exellentmodel fit.45 The missing value analysis and t-tests were implemented using SPSS (version 22.0; IBM Corp; Armonk, NY, USA) and the structural equation and intervention effects with Mplus (version 7.11; Mplus user’s guide, 6th ed. Los Angeles, CA, USA).
Results
Descriptive statistics
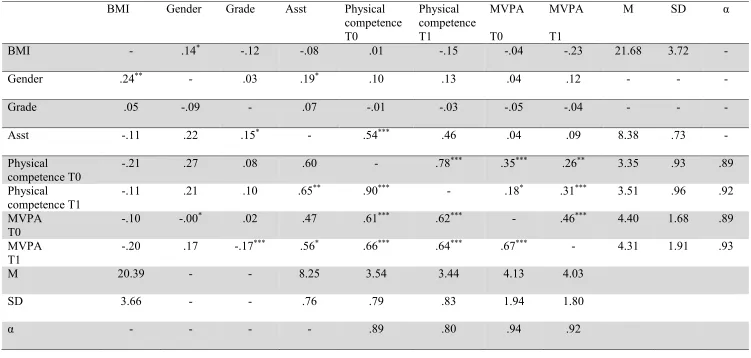
Correlation coefficients, means, and standard deviations, Cronbach alphas of the study variables were determined (Table 1). The results showed that the associations between physical competence and MVPA ranged from weak to moderate within the intervention group, whereas the particular relationships were strong within the control group. The mean scores indicated that both intervention and control group’s physical competence and MVPA were moderate at the baseline and the follow-up. BMI ranged from 15 to 48 within the intervention girls (14% overweight) and from 15 to 26 within the control group girls (6% overweight). In boys, the intervention group’s BMI values varied between 16 and 32 (42% overweight) and control group’s BMI between 16 and 42 (22% overweight). Additionally, graded assessments varied between 6 and 10 in the intervention group (45% of students had 9 or 10) and the control group’s assessments from 7 to 10 (34% of students had 9 or 10). The correlation coefficients showed moderate positive relationship between standardized self-reports and objective scores in girls (r = 0.46, p < .001) and weak positive relationship in boys (r = 0.26, p > .05). However,
no significant differences between self-reports and objective scores were found at p < .05 level.
On this basis, the present self-reports of MVPA can be considered sufficiently reliable.
Testing the fidelity of task-involving climate implementation
Independent sample t-tests for the fidelity of implementation revealed that the intervention students reported an increase (4.03 to 4.24) in the mean score of perceived task-involving climate (t(284) = -1.891, p < .05) and a decrease (3.02 to 2.78) in ego-involving
climate (t(284) = 1.458, p < .05). In contrast, the control group’s perceptions of task-involving
climate (3.64 and 3.54) were stable (t(192) = -1.352, p = .089), while perceptions of ego-involving climate increased (2.93 to 3.11) from T0 to T1 (t(192) = -1.772, p < .05). Based on
this, it was assumed that task-involving climate support in PE classes was properly provided.
The cross-lagged model of physical competence and MVPA
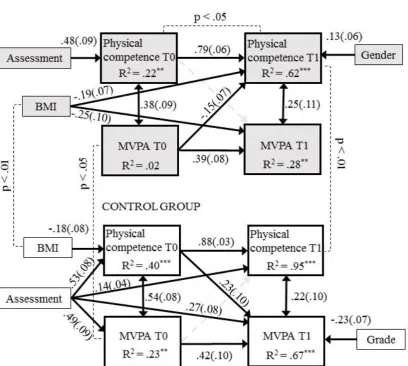
The cross-lagged model was implemented in order to analyze the associations of students’ perceived physical competence and MVPA through one year of program (Fig. 1). First, the theorized model was run for the purpose of seeing which paths were not significant. Second, the model was fixed by removing the non-significant paths. The fixed model revealed an excellent model fit for the data (χ2(1) = 0.356, p = 0.551, CFI = 1.00, TLI = 1.00, RMSEA = 0.000, SRMR = 0.001) (Fig. 2).
The standardized results highlighted that both groups’ physical competence was linked to MVPA at the baseline and after one year of program. Similarly, previous physical competence and MVPA (T0) strongly associated with later physical competence and MVPA (T1) in both the intervention and control groups. However, the intervention group’s MVPA at the baseline negatively related to physical competence at T1, whereas the control group’s physical competence at T0 had a positive relationship with MVPA at T1.
The results showed that the intervention group students’ physical competence increased, whereas the control group’s physical competence scores remained stable across the intervention. Additionally, the intervention group had higher MVPA and BMI scores at the baseline and higher physical competence scores at T1 than control group.
BMI was negatively associated with physical competence and MVPA at T1 within the intervention group and the control group students’ physical competence at T0. The PE assessments were only linked to physical competence at T0 within the intervention group. In contrast, assessments related to physical competence and MVPA at both T0 and T1 measurements within the control group. A significant gender difference was found in physical competence scores at T1 within the intervention group, with boys scoring higher than girls. Similarly, Grade 7 students scored higher than Grade 8 students in MVPA at T1 within the control group.
Finally, the effect sizes ranged from weak to strong explaining 22% to 62% of the variance of physical competence and 2% to 28% of the variance of MVPA engagement within the intervention group. Similarly the model explained 40% to 95% and 23% to 67% of the variances of physical competence and MVPA within the control group students.
Discussion
The present paper examined the effects of a school-based program on students’ self-reported MVPA and physical competence, and associated links to body mass index and PE assessments. The aims of the study were 1) to investigate the relationships of MVPA and physical competence in both an intervention group and a control group, 2) to investigate whether MVPA participation and physical competence would be different between the intervention and control groups, and 3) to explore whether there are differences in MVPA
participation and physical competence and how these characteristics are influenced by correlates such as gender, grade, BMI, and PE assessment.
The present study was the first to include a follow-up data collection assessing MVPA across a school-based program at the middle school level.7 In line with the hypothesis, the results confirmed that physical competence was linked to MVPA in both groups at the baseline and after one year of program. This was expected, as students with higher positive perceptions of physical competence in PE have been shown to be more physically active than students with lower physical competence.6 Strong associations between initial self-evaluation of physical competence and MVPA (T0) and current self-evaluation of physical competence and MVPA (T1) for both intervention and control groups support the ideology of the Finnish national PE curriculum,24 that reinforces positive early perceptions of physical competence and engagement in physical activity facilitate higher perceived competence and MVPA in later years. On this basis, one of the most important goals of PE should be on providing positive learning experiences, and thus, increasing perceptions of physical competence and opportunities for MVPA during school days, and further out-of-school.
The findings showed that the present school-based program was an effective in order to increase student’s perceptions of physical competence across one school year. Specifically, the intervention group’s physical competence increased, whereas the control group’s physical competence remained stable across the program. These results were supportive of the hypothesis, as it was expected that physical competence would increase through the intervention, and aligned with the studies of Theeboom, DeKnop, and Weiss47 and Valentini and Rudisill,17 that focused on the feedback allocated to effort, self development, co-operation, and learning. The present program provided physical competence support in PE classes and additional MVPA opportunities during school days. Although, the activities were supervised by the teachers, students were responsible for setting up the equipment during the extended and
regular breaks. Hence, the intervention can be considered more student-centered than teacher-led intervention. Alderman, Beighle, and Pangrazi concluded that students were more likely to feel competent, if they were allowed to make choices of different levels in the particular activities.48 Based on the present findings, physical competence support in PE classes and the structural changes, including a range of practices offered with different skill requirements during PE classes and a daily extended break of 30 minutes in addition to the lunch break and regular breaks, were effective strategies to implement across the school year. Additionally, these structural changes were inexpensive to implement. In many countries, schools decide to allow students to have access to sport facilities during breaks, since these facilities may be unoccupied for much of break or recess time, when more effective use is highly recommended.49 Additionally, activities with a range of skill requirements in PE classes could motivate and support students to apply greater physical effort, especially those with low perceptions of physical competence.6
Although it was assumed that students’ MVPA engagement would increase across the program, MVPA remained stable in both groups. Previous school-based interventions have been shown to be successful in increasing physical activity engagement.19,26-30 Research findings presented by Metcalf, Henley, and Wilkin supported the current results by demonstrating that physical activity interventions have had only a small effect, approximately four minutes more walking or running per day, on children’s overall objectively measured activity levels.50 Tammelin, Laine, and Turpeinen noted that as an outcome of participation in school-based interventions, students’ total MVPA may decrease because of a reduction in their after school activity.30 Based on this, it is possible that for the current cohort of intervention students’ total MVPA remained constant because out-of-school activity declined while in-school MVPA increased. It must be recognized that the current MVPA measures determined total self-reported MVPA including both in-school and out-of-school activity. For example,
Brooke et al.51 and Gråstén52 reported MVPA using the segments of before-school, PE classes,
recess, and after-school activities. Perhaps, a positive increase in MVPA participation, at least
in PE classes and recess breaks could have materialized, if MVPA had measured using more accurate objective measures. Furthermore, one year was a relatively short period to expect significant changes in total MVPA behavior, since the initial MVPA scores of both intervention and control group were already relatively high. All efforts to promote MVPA in youth at this age are a great of value, as MVPA levels of school-aged children are globally decreasing within Western, African2 and Asian3 societies. It remains clear that schools alone cannot provide young people with all the MVPA they need25 and attention should remain focused on out-of-school activities, especially on weekends, because children spend only limited time of their waking hours at the school.52
The present study was designed to examine the interrelationships of BMI, perceived physical competence, and MVPA using a longitudinal study design. Results highlighted a significant difference between intervention and control groups with the intervention group showing higher BMI scores. The findings also showed that BMI was negatively associated with physical competence and MVPA within the intervention group at T1 and physical competence within the control group students at the baseline. This was in line with previous findings that reported students with high BMI had lower perceptions of physical competence23 and physical activity.32 It must also be recognized that most of students in the current study reported to have normal weight. Thus, a time period of one school year was too limited time to decrease the average BMI scores, however, all efforts to make contributions in order to prevent overweight and obesity in youth are valuable. No previous studies were found that investigated the relationships between MVPA behavior, physical competence, and BMI scores across a school-based program. Therefore, the present analysis provided important insights into a set of
relevant pedagogical and practical associations that should be considered in future school-based interventions.
PE assessment results were only linked to the baseline scores of physical competence within the intervention group. In contrast, assessments related to physical competence and MVPA at both baseline and follow-up measurement points within control group students. The results indicated that intervention students did not find assessments as relevant in terms of physical competence or MVPA when competence and physical activity were supported. This finding was in line with the objectives of national PE curriculum,24 as it addresses that the main goal of PE should be to have a positive impact on the students’ physical and psychological well-being. Therefore, these results provided some perspectives to discussion about the need of formal assessment. According to the Finnish national curriculum, PE is evaluated among other school subjects using graded assessments.24 Perhaps, students’ physical competence and MVPA were not related to the assessments, when evaluation emphasized individual improvement and experiences of learning more than normative comparisons. In that sense, the current program seemed to be successful. Taken together, the assessments for PE were not related to MVPA or physical competence, when physical competence was supported (i.e. activating teaching practices, physical competence and belief support, personal skill improvements, and positive feedback and encouragement) and additional activities (i.e. extended breaks, access to the fitness hall, supervised ballgames, and equipment) were provided to all students. From this perspective, the present results can be considered as encouraging.
Finally, it was not expected that gender difference in relation to perceived physical competence20-22 and MVPA33,34 would only be found within intervention group after one year of program, with boys scoring higher than girls in physical competence. A possible reason can be that the particular data was collected in relatively small towns, where walking, biking, and
other outdoor sports (i.e. skiing, hiking) are more common, and local community facilities, including sport and exercise settings, parks, trails, and pathways may promote both girls and boys to be more physically active.53 Similarly, Grade 7 students of control group scored higher than Grade 8 students only in MVPA at the second measurement phase. All participants were either Grade 7 or 8 students, and the maximum one-year age difference may have been too small to allow for the demonstration of an age related decrease in physical competence or MVPA.33,34 However, without any additional information, clear conclusions based on these statistical results are difficult to draw.
A strength of the study was the longitudinal design, as the program was implemented across one school year and the follow-up data of physical competence was included so that the long-term impacts could be properly determined. As an authentic school-based program, however, limitations must be considered when interpreting the current findings. Although the study comprised both intervention and control group, the study was not a randomized-control trial. Therefore, the results should not be linearly interpreted as cause-effect relationships. Second, the study would have benefitted from having detailed information about participation rates during implemented physical activity breaks or changes in PE teachers’ teaching practices. Furthermore, the key variables were evaluated using subjective scales. The truthfulness and accuracy of self-reported measures may be compromised because some health and well-being behaviors such as MVPA are difficult to recall and may also be so sensitive that respondents are reluctant to provide exact details.54 Future studies are needed to implement a broader range of MVPA and behavioral assessment protocols. For example, specific studies incorporating long-term objective MVPA measurements and psychological assessment instruments (e.g. exercise motivation) would be highly warranted. In addition, samples of single gender and mixed gender student groups could also be recruited in order to further examine gender related MVPA contrasts within PE programs.
Conclusions
The school-based Physical Activity as Civil Skill Program8 was shown to be effective in increasing student’s perceptions of physical competence across one school year. Although MVPA engagement remained at the same level within both intervention and control groups, schools still have a great potential to influence students’ perceptions of physical competence and exercise motivation towards physical activity both in-school and out-of-school. On this basis, all efforts to promote MVPA in youth are of great value, as MVPA levels of school-aged children are decreasing internationally. Furthermore, an increase in students’ perceptions of physical competence represents an important step in supporting the implementation of school-based interventions that incorporate the collection of follow-up psychological outcome data, as a strategy to ascertain the long-term impacts of these interventions. This study was the first to examine the links between physical competence, MVPA, PE assessments, and BMI. In line with previous findings, students with high BMI had lower perceptions of physical competence and physical activity. In contrast, graded assessments of PE performance were not related to MVPA or physical competence, when physical competence was supported and additional activities were provided to all students. Therefore, school PE programs should endeavor to provide positive learning experiences, and thus, increase perceptions of physical competence, because current school education systems do not have sufficient curriculum space to substantial increase opportunities for school PE or time spent in recess physical activities.
Funding source
This study was funded by the Emil Aaltonen Foundation (Grant no. 160029).
References
1. Coulter M, Woods C. An exploration of children's perceptions and enjoyment of school-based physical activity and physical education. J Phys Act Health. 2011;8:645–654.
2. Tremblay M, Barnes J, González S, Katzmarzyk P, Onywera V, Reilly J, Tomkinson G, and the Global Matrix 2.0 Research Team. Global Matrix 2.0: Report card grades on the physical activity of children and youth comparing 38 countries. J Phys Act Health.
2016;13:343–366.
3. Müller A, Khoo S, Lambert R. Review of physical activity prevalence of Asian school-age children and adolescents. Asia Pac J Public Health. 2013;25:227–238.
4. Barrett J, Gortmaker S, Long M, Ward Z, Resch S, Moodie M et al. Cost effectiveness of an elementary school active physical education policy. Am J Prev Med. 2015;49:148– 159.
5. Choski D, Farley T. The cost-effectiveness of environmental approaches to disease prevention. N Engl J Med. 2012;367:295–297.
6. Weiss M. Back to the future: research trends in youth motivation and physical activity.
Pediatr Exerc Sci. 2013;25:561–572.
7. Dobbins M, Husson H, DeCorby K, LaRocca R. School-based physical activity programs for promoting physical activity and fitness in children and adolescents aged 6 to 18.
Hamilton: The Cochrane Collaboration; 2013.
8. Physical Activity as Civil Skill Program 2010–2014. Available at:
http://www.liikaha.fi/yhteystiedot/liikaha-hanke; [accessed 30.4.2016].
9. Ferrer-Caja E, Weiss M. Predictors of intrinsic motivation among adolescent students in physical education. Res Q Exerc Sport. 2000;71:267–279.
10. World Health Organization. Global recommendations on physical activity for health.
2010. Available at:
http://whqlibdoc.who.int/publications/2010/9789241599979_eng.pdf; [accessed 15.01.2015].
11. Nicholls J. The competitive ethos and democratic education. Cambridge, MA: Harvard
University Press; 1989.
12. Sallis J, Owen N. Physical Activity and Behavioral Medicine. Thousand Oaks, CA: Sage;
1999.
13. Gråstén A, Yli-Piipari S, Watt A, Jaakkola T, Liukkonen J. Effectiveness of school-initiated physical activity program on secondary school students’ physical activity participation. J Sch Health. 2015;85:125–134.
14. Ames C. Achievement goal, motivational climate, and motivational processes. In: Roberts G (ed) Motivation in Sport and Exercise. Champaign, IL: Human Kinetics; 1992:161–
176.
15. Gråstén A.Testing the model of motivational climate, goal orientations, expectancy beliefs, task values in school physical education, and associated links to light- to vigorous-intensity physical activity. Int J Sport Psychol. 2016;47.
16. Gråstén A, Jaakkola T, Liukkonen J, Watt A, Yli-Piipari S. Prediction of enjoyment in school physical education. J Sports Sci Med. 2012;11:260–269.
17. Valentini M, Rudisill M. Motivational climate, motor-skill development, and perceived competence: Two studies of developmentally delayed kindergarten children. J Teach Phys Educ. 2004;23:216–234.
18. Barkoukis V, Tsorbatzoudis H, Grouios G. Manipulation of motivational climate in physical education: Effects of a 7-month intervention. Eur Phys Educ Rev.
2008;4:376–387.
19. Digelidis N, Papaioannou A, Laparidis K, Christodoulidis T. A one-year intervention in 7th grade physical education classes aiming to change motivational climate and attitudes toward exercise. Psychol Sport Exerc. 2003;4:195–210.
20. Carroll B, Loumidis J. Children’s perceived competence and enjoyment in physical education and physical activity outside school. Eur Phys Educ Rev. 2001;7:24–43. 21. Fairclough S. Physical activity, perceived competence and enjoyment during secondary
school physical education. Eur J Phys Educ. 2003;8:5–18.
22. Kalaja S. Fundamental movement skills, physical activity, and motivation toward Finnish school physical education: A fundamental movement skills intervention. Jyväskylä: University of Jyväskylä; 2012 [Dissertation].
23. Craft L, Pfeiffer K, Pivarnik J. Predictors of physical competence in adolescent girls. J Youth Adolesc. 2003;32:431–438.
24. National Board of Education. National core curriculum for basic education 2004.
Vammala: Vammalan Kirjapaino Oy; 2005.
25. Gråstén A. Students’ perceived physical competence and physical activity engagement across one year of school-based program. Presented at the 1st Scientific Conference on Motor Skill Acquisition, Kisakallio, Finland, November; 2015.
26. Hill C, Abraham C, Wright D. Can theory-based messages in combination with cognitive prompts promote exercise in classroom settings? Sos Sci Med. 2007;65:1049–1058.
27. McKenzie T, Sallis J, Prochaska J, Conway T, Marshall S, Rosengard P. Evaluation of a two-year middle-school physical education intervention: M-SPAN. Med Sci Sports Exerc. 2004;36:1382–1388.
28. Schneider M, Dunton G, Cooper D. Physical activity and physical self-concept among sedentary adolescent females: An intervention study. Psychol Sport Exerc. 2008;9:1– 14.
29. Simon C, Wagner A, Platat C, Arveiler D, Schlienger J, Triby E. ICAPS: A multilevel program to improve physical activity in adolescents. Diabetes Metab. 2006;32:41–49.
30. Tammelin T, Laine K, Turpeinen S. Physical activity of school-aged children. Research Reports on Sport and Health 272. Jyväskylä: LIKES;2013.
31. Adamo K, Prince S, Tricco A, Connor-Gorber S, Tremblay M. A comparison of indirect versus direct measures for assessing physical activity in the pediatric population: A systematic review. Int J Pediatr Obesity. 2009;4:2–27.
32. Rauner A, Mess F, Woll A. The relationship between physical activity, physical fitness and overweight in adolescents: A systematic review of studies published in or after 2000. BMC Pediatr. 2013;1:13–19.
33. Currie C, Zanotti C, Morgan A, Currie D, de Looze M, Roberts C, et al. Social determinants of health and well-being among young people. Health behavior in school-aged children (HBSC) study: International report from the 2009/2010 survey.
Copenhagen: World Health Organization; 2012.
34. Nader P, Bradley R, Houts R, McRitchie S, O’Brien M. Moderate-to-vigorous physical activity from ages 9 to 15 years. JAMA. 2008;300:295–305.
35. Gråstén A. Students’ physical activity, physical education enjoyment, and motivational determinants through a three-year school-initiated program. Jyväskylä: University of Jyväskylä; 2014 [Dissertation].
36. Soini M, Liukkonen J, Jaakkola T, Leskinen E, Rantanen, P. Motivaatioilmasto ja viihtyminen koululiikunnassa [Motivational climate and enjoyment of physical education in school]. Liikunta & Tiede. 2007;44:45–51.
37. Cole T, Bellizzi M, Flegal K, Dietz W. Establishing a standard definition for child overweight and obesity worldwide: International survey. Br Med J. 2000;320:1240– 1243.
38. Currie C, Samdal O, Boyce W, Smith B. Health behavior in school-aged children: A WHO cross-national study. Research Protocol for the 2001-2002 Survey. Edinburgh: University of Edinburgh; 2002.
39. Prochaska J, Sallis J, Long B. A physical activity screening measure for the use with adolescents in primary care. Arch Pediatr Adolesc Med. 2001;155:554–559.
40. Virtanen P. Measurement of children´s physical activity. Development of Polar Active activity monitor. Presented at the International Congress on Enchancement of Physical Activity of Children and Youth,Vuokatti, Finland, November; 2011.
41. Fox K, Corbin C. The physical self-perception profile: development and preliminary validation. J Sport Exerc Psychol. 1989;11;408–430.
42. Tabachnick B, Fidell L. Using multivariate statistics. Boston, MD: Pearson; 2007.
43. Little R, Rubin D. Statistical analysis with missing data. New York, NY: Wiley; 2002.
44. Arbuckle J. Amos 18.0 User’s Guide. Chicago, IL: Amos Development Corporation; 2007.
45. Browne M, Cudeck R. Alternative ways of assessing model fit. In: Bollen KA, Long JS, editors. Testing structural equation models. Newbury Park, CA: Sage; 1993. p.136– 62.
46. Kline R. Principles and practice of structural equation modeling. New York: Guilford
Press; 2005.
47. Theeboom M, De Knop P, Weiss M. Motivational climate, psychological responses, and motor skill development in children's sport: A Field-based intervention. J Sport Exerc Psychol. 1995;17:294–311.
48. Alderman B, Beighle A. Pangrazi R. Enhancing motivation in physical education. J Phys Educ Recreat Dance.2006; 77:41–45.
49. European Commission. Physical education and sport at school in Europe Eurydice report. Luxembourg: Publications Office of the European Union; 2013.
50. Metcalf B, Henley W, Wilkin T. Effectiveness of intervention on physical activity of children: systematic review and meta-analysis of controlled trials with objectively measured outcomes. BMJ. 2012;345.
51. Brooke H, Atkin A, Corder K, Ekelund U, van Sluijs E. Changes in time-segment specific physical activity between ages 10 and 14 years: a longitudinal observational study. J Sci Med Sport. 2016;19:29–34.
52. Gråstén A. Children's segment specific moderate to vigorous physical activity through a school-initiated physical activity program. Balt J Health Phys Act. 2015;7:19–32.
53. Sallis J, Cervero R, Ascher W, Henderson K, Kraft M, Kerr J. An ecological approach to creating active living communities. Annual Rev Public Health. 2006;27:297–322. 54. Brener N, Billy J, Grady W. Assessment of factors affecting the validity of self-reported
health-risk behavior among adolescents: evidence from the scientific literature. J Adolesc Health. 2003;33:436–457.
Figure 1: The theorized cross-lagged model of physical competence and MVPA.
Figure 2: The standardized results of the cross-lagged model for the intervention and control groups. All continuous paths are significant at p < .05 level, standard errors in parentheses. Significant mean differences between and within groups are presented using narrow lines.
[image:29.595.90.499.126.492.2]Table 1: Correlations, means, standard deviations, and Cronbach-alphas of the study variables. BMI Gender Grade Asst Physical
competence T0
Physical competence T1
MVPA T0
MVPA T1
M SD α
BMI - .14* -.12 -.08 .01 -.15 -.04 -.23 21.68 3.72 -
Gender .24** - .03 .19* .10 .13 .04 .12 - - -
Grade .05 -.09 - .07 -.01 -.03 -.05 -.04 - - -
Asst -.11 .22 .15* - .54*** .46 .04 .09 8.38 .73 -
Physical
competence T0 -.21 .27 .08 .60 - .78
*** .35*** .26** 3.35 .93 .89
Physical competence T1
-.11 .21 .10 .65** .90*** - .18* .31*** 3.51 .96 .92
MVPA T0
-.10 -.00* .02 .47 .61*** .62*** - .46*** 4.40 1.68 .89
MVPA T1
-.20 .17 -.17*** .56* .66*** .64*** .67*** - 4.31 1.91 .93
M 20.39 - - 8.25 3.54 3.44 4.13 4.03
SD 3.66 - - .76 .79 .83 1.94 1.80
α - - - - .89 .80 .94 .92
Note 1. Intercorrelations for the intervention group (n = 143) are presented above the diagonal and for the control group (n = 97) below the diagonal.
Note 2. Means, standard deviations, and Cronbach alphas for the intervention group are presented in vertical columns and means, standard deviations, and Cronbach alphas for the control group are presented in horizontal columns.
Note 3. ***p < .001, **p < .01, *p < .05. Asst = PE assessment.