Colour Constancy using von Kries
Transformations
Colour Constancy goes to the Lab
Guy K. Kloss Computer Science
Institute of Information & Mathematical Sciences Massey University at Albany, Auckland, New Zealand
Email: [email protected]
Colour constancy algorithms aim at correcting colour towards a correct perception within scenes. To achieve this goal they estimate a white point (the illuminant's colour), and correct the scene for its inuence. In contrast, colour management performs on input images colour transformations according to a pre-established input prole (ICC prole) for the given con-stellation of input device (camera) and conditions (illumination situation). The latter case presents a much more analytic approach (it is not based on an estimation), and is based on solid colour science and current industry best practises, but it is rather inexible towards cases with altered conditions or capturing devices. The idea as outlined in this paper is to take up the idea of working on visually linearised and device independent CIE colour spaces as used in colour management, and to try to apply them in the eld of colour constancy. For this purpose two of the most well known colour constancy algorithms White Patch Retinex and Grey World Assumption have been ported to also work on colours in the CIE LAB colour space. Barnard's popular benchmarking set of imagery was corrected with the original imple-mentations as a reference and the modied algorithms. The results appeared to be promising, but they also revealed strengths and weaknesses.
Keywords: colour constancy; colour spaces; white point estimation; von Kries transforma-tion; Bradford transformatransforma-tion; CIE LAB.
1 Introduction
Colour constancy refers to the everyday perception that the colours of objects remain unchanged across signicant changes in illumination colour and luminance level [1]. Colour constancy is served by the mechanisms of chromatic adaptation and memory colour. The study of colour appearance and the derivation of colour appearance models are aiming to quantify and predict colour constant perception. Such studies generally take place in the arena of computational colour constancy.
In digital imaging systems, colour management is the controlled conversion between the colour representations of various devices, such as image scanners, digital cameras, monitors, TV screens, lm printers, computer printers, oset presses, and corresponding media. The primary goal of colour management is to obtain a good match across colour devices; for example, a video which should appear the same colour on a computer LCD monitor, a plasma TV screen, and on a printed frame of video. Colour management helps to achieve the same appearance on all of these devices, provided the devices are capable of delivering the needed colour intensities [2].
primaries of this colour space. Dierences in colour are quantied in terms of Euclidean distances in these non-linear spaces. Therefore, they may not be optimal for quantitative colour compar-isons. Visually meaningful colour dierences are usually expressed as a ∆E value derived from
CIE LAB, and is considered to be current good practise [1] (based on theL∗,a∗andb∗coordinates
of the CIE LAB colour space). CIE LAB aspires to perceptual uniformity, and itsL∗ component
closely matches human perception of lightness. It can thus be used to make accurate colour balance corrections by modifying output curves in thea∗ and b∗ components, or to adjust the lightness
contrast using theL∗ component. It seems like a good idea to apply colour constancy algorithms
on a device independent and linearised colour space as CIE LAB for an exemplary evaluation. In colour management the adaptation from one illuminant to another is performed by von Kries type transformations. Commonly accepted now as being the best candidate for chromatic adaptation transformations (CATs) is the Bradford transformation [3,4]. Additionally to the direct transformation on theL∗a∗b∗ colour coordinates, we will be evaluating a Bradford CAT.
The comparison of algorithms in this paper does not aim to create a competitor for the Best Colour Constancy Algorithm Award. We are rather trying to evaluate the possibility of imple-menting variations of them in opponent colour spaces, particularly in the device independent, visually linearised CIE LAB colour space.
The next section of this paper will introduce colour constancy algorithms in general, as well as the ones used here for comparison. In Sect. 3 these algorithms are modied towards being useful in an opponent colour space (CIE LAB). Sect. 4 explains some details towards the implementation and evaluation, with nally Sect. 5 presenting comparative experimental results between the dierent implementations.
2 Colour Constancy Algorithms
The basic idea of colour constancy algorithms is two fold: Firstly, to determine an estimation of the white point in an image, which reects the illuminant's properties (its colouration); Secondly, to compensate for the colour cast introduced by the illuminant. As a result the image will be normalised towards a more neutral representation, in a way also our human visual apparatus performs a (more robust) colour constant perception. Usually the white point also inuences the brightness and contrast in the process of the compensation, yielding a better dynamic range of the image.
Due to the focus of the paper towards a general comparison towards the viability and an estimation of inuences on the working colour space, we have implemented only two classic member of the colour constancy family: The (White Patch) Retinex algorithm and the Grey World Assumption as outlined by Marc Ebner [5]. These algorithms have got their limitations, but they have been well known for a long time and should therefore serve as a good example. To ease comparability of the algorithm modications we are focusing on uniformly illuminated scenes only.
These colour constancy algorithms are based on the estimation of a white point by inspecting image characteristics. The white point is used to transform the image pixels' colour tuples to a corrected representation. For the transformation we are assuming a linear relationship between the response of the sensor and the value of a pixel's colour channel. As most RGB encoded images are encoded in the sRGB colour space (strictly speaking being R0G0B0), the colour tuples are
2.1 White Patch Retinex
The Retinex algorithm relies on having a bright patch somewhere in the image. The idea is, that this patch reects the maximum intensity of light possible for each band. Assuming that we are dealing with approximate Lambertian reection, this will be the colour of the illuminant. Once a bright patch has been located, its colour value can be used for an estimate of the white point.
Practically, instead of looking for a bright patch (or white patch) one determines the maximum of each band over all pixels. Problems arise with some noisy pixels, (single) white pixels, or clipped pixels (the colour channel value of a pixel exceeds the encoding maximum, and is therefore restricted to the maximum, e. g. 255). To increase robustness a cuto value is introduced, using the value at a certain cuto percentage o the top. The colour bands are re-scaled using this white point estimation.
2.2 Grey World Assumption
According to the Grey World Assumption most scenes are suciently complex regarding their colour distribution. Therefore, one can assume that, on average, the world is grey. An image, showing a suciently large number of dierent colours can be assumed as being grey as well.
The space average colour of the image therefore can be used to estimate the illuminant. The white point is determined by scaling the average colour with the maximum luminance. As with the White Patch Retinex implementation (Sect. 2.1), for the maximum determination also a cuto percentage is used for robustness reasons. All colour channels (RGB) will be scaled with the
corresponding channel value of the white point.
3 Algorithm Modications
The CIE LAB colour space is visually linear, and independent of characteristics of the (capturing) device. AnL∗a∗b∗colour space is a colour-opponent space with dimensionL∗for lightness and a∗
andb∗ for the colour-opponent dimensions, based on the non-linearly compressed CIE XYZ colour
space coordinates. The lightness is a perceptual scale of the brightness as a nonlinear function of the relative luminance Y (of CIE XYZ).
a∗ and b∗ capture the chromaticity of the colour. Therefore, these are de-coupled from any
intensity information. An estimation of a white point has to be dealt with dierently in this colour space. Additionally, the adaptation to the estimated white point has to be performed dierently. Scaling is applied to the L∗ channel only, and scaling on a∗ and b∗ introduces shifts in chroma
(saturation) of the colour tuples.
3.1 White Patch Retinex
As mentioned in Sect. 3 the only component inL∗a∗b∗related to intensity isL∗. Therefore, it is not
possible to determine maxima in the channels, and this step has to be limited to the lightness. The colour tuples of the whole image are sorted by theirL∗ component. The distribution of possible
colour values in theL∗a∗b∗ space converges to a tip towards both extreme points in lightness, at
the white point as well as at the black point. The values at the dened cuto point in the lightness channel (see Sect. 2.1) are co-located in a quite small space within thea∗b∗ plane. However, they
may introduce randomness of signicant scale into the white point determination. Fig. 1 shows the cuto plane, that bounds the lightest fraction of the image pixels. A pixel closest to that plane taken could by chance lie anywhere in the cross section of the plane with a hull surface of the pixel colours. To suppress this element of randomness theL∗a∗b∗values above the cuto point are
Figure 1: The locations in colour space of the pixels with the highest lightness are shown as spheres inL∗a∗b∗ space. The cuto plane is indicated in grey.
The listing in Fig. 2 outlines the basic steps in pseudo code taken to estimate the illuminant from the image's colour tuples. For simplicity it is limited to all pixels, including all clipped pixels. The resultingestimated_illuminantthen is used in the chromatic adaptation (see Sect. 3.3).
1 number_of_pixels = pixels in image
2 sorted_by_lightness = all colour tuples sorted by lightness
3 cutoff_index = (1.0 - PERCENTAGE) * number_of_pixels
4 max_lightness_pixels = sorted_by_lightness with (index >= cutoff_index)
5 estimated_illuminant = per channel mean value of max_lightness_pixels
Figure 2: Basic steps for the illuminant estimation of theL∗a∗b∗ modied White Patch Retinex
algorithm. PERCENTAGE= 0.04 as described by Ebner.
3.2 Grey World Assumption
The algorithm modications for the Grey World Assumptions are much easier to accomplish. The average colour can be determined by averaging over all channels ofL∗a∗b∗. TheL∗ component for
the white point does not require averaging beyond the cuto point, but can be used directly at the cuto point's index (see pseudo code listing in Fig. 3).
1 number_of_pixels = pixels in image
2 average_channels = per channel mean value of all colour tuples
3 sorted_lightnesses = sorted L value of all colour tuples
4 cutoff_index = (1.0 - PERCENTAGE) * number_of_pixels
5 max_value_L = sorted_lightnesses at cutoff_index
6 average_L = L value of average_channels
7 estimated_illuminant = average_channels * max_value_L / average_L
Figure 3: Basic steps for the illuminant estimation of theL∗a∗b∗modied Grey World Assumption
algorithm. PERCENTAGE= 0.02 as described by Ebner.
3.3 Chromatic Adaptation
The adaptation to the estimated white point does not require scaling in all channels of L∗a∗b∗
space as it is performed onRGBcolours. This adaptation to channel scaling is outlined in pseudo
code in the listing of Fig. 4. Scaling can only be performed on theL∗ channel. Values in thea∗b∗
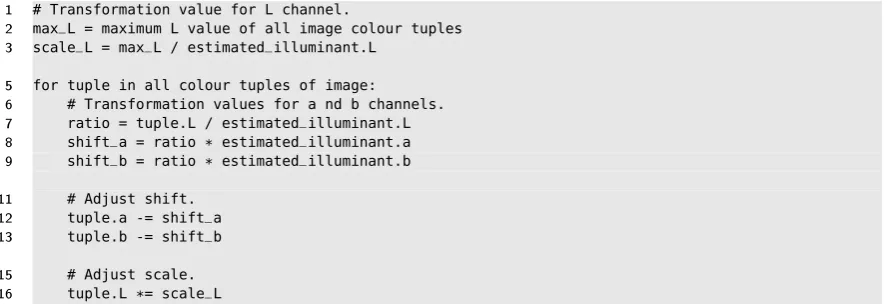
plane are shifted (lines 1113) by an amount linearly interpolated between the (ideal) black point and the white point (lines 69), depending on the value ofL∗(line 7).
1 # Transformation value for L channel.
2 max_L = maximum L value of all image colour tuples
3 scale_L = max_L / estimated_illuminant.L
5 for tuple in all colour tuples of image:
6 # Transformation values for a nd b channels.
7 ratio = tuple.L / estimated_illuminant.L
8 shift_a = ratio * estimated_illuminant.a
9 shift_b = ratio * estimated_illuminant.b
11 # Adjust shift.
12 tuple.a -= shift_a
13 tuple.b -= shift_b
15 # Adjust scale.
[image:5.595.84.528.336.488.2]16 tuple.L *= scale_L
Figure 4: Channel scaling transformation for the estimated illuminant of the L∗a∗b∗ modied
colour constancy algorithms.
Experiments with theL∗a∗b∗ based implementation of the two above mentioned algorithms in
general worked quite nicely. However, on strong dierences in the encountered illuminant exposed a very weak visual quality of the colour corrected images. Colours were often over compensated and colours were often strongly under saturation.
A reason for this is assumed to be found in the fact that the colour adaptation has been performed on channels of perceived colour, which are not related to intensity (luminance), but to visual lightness and chromaticity. As we are dealing with colour in visually based terms and colour spaces derived from these it is believed that a transformation in the cone response domain of the human eye yields best results. Colour scientists nowadays adapt to illuminants' colour inuences using von Kries transformations [1]. Common best practise for CATs is the Bradford transformation [3,4], which we have implemented to adapt to the new estimated white point. This Bradford transformation replaces the shifting/scaling based onL∗a∗b∗ colours only (as described
4 Implementation and Evaluation
The implementation has been accomplished completely using the Python programming language. It uses various packages and extensions that tie in native C libraries directly to yield good perfor-mances of the application while maintaining a very high speed of implementation due to its ease. Specically the Python Imaging Library (PIL) is used for image reading and writing and NumPy for fast and comfortable image and matrix processing. For colour management tasks (conversion between sRGB and CIE LAB, Bradford transformation) the new bindings PyLittleCMS [6] to the long standing and widely used LittleCMS [7] library have been used. PyLittleCMS was particularly developed and extended for this purpose [8].
Distortions are often introduced due to the fact that real world images are often exposed in a way that pixels are clipped. Clipping is, when one or more of the colour bands in the images are set to an extreme value (e. g. in RGB encoding usually 0 or 255). This happens mostly when the particular colour value exceeds the dynamic range of the encoding, as it often happens in very bright specular reections. The colour tuple of these clipped pixels therefore usually does not reect the true shade of the colour as it is restricted.
The results and quality of colour constancy algorithms can be quite hard to judge, as it is often not easy to obtain a true canonical image for direct comparison. A common test for its eectivity however is to use colour indexing [5,9] as rst stated by Swain and Ballard [10]. The task in colour indexing is to identify an object in an image by its colour distribution. The colour distribution obtained through histograms of the colour tuples in the image are compared to the histograms of a model database through histogram intersection [10]. For the sake of best comparability the imple-mentation did not follow any of the (improved) later modications, but used the basic originally described scheme (with a minor modication as described in Sect. 4.2).
4.1 Implementation of Colour Constancy
As already mentioned in Sect. 2, the colour constancy algorithms have been implemented according to Ebner's pseudo code in [5]. For this purpose the RGB colour space was converted to oating point values between 0.0 and 1.0, and the channels were linearised (removal of the gamma correction). TheL∗a∗b∗space was expressed in oating point values, with the lightness componentL∗ranging
between 0.0 and a maximum of 100.0, whereas the chromaticity componentsa∗ andb∗are ranging
between -128.0 and 128.0.
The colour constancy algorithm descriptions directly do not mention the aspect of handling of clipped pixels. The implementation of these algorithms therefore provides handling of all image pixels as well as selectively operating only on the un-clipped pixels to avoid any bias in determin-ing of the white point. Applications discarddetermin-ing the clipped pixels should yield better and more reproducible results. For comparison, all computations in Sect. 6.2 have been performed using both methods: including and excluding clipped pixels. The visual evaluation in Sect. 6.1 features computations on un-clipped pixels only.
None of the parameters for the cuto points have been adapted or tuned towards optimal colour constancy performance. For the sake of keeping the implementations as straight and com-parable as possible they have remained at the values as described by Ebner [5].
4.2 Implementation of Colour Indexing
on chromaticity values only. It is frequently used for comparison, and we have used Barnard's image set for qualitative and quantitative evaluation means in this research as well.
For colour indexing on RGB based colour constancy algorithms, commonly rg chromaticity
values are used. These are obtained by dividing the red and green channels by the sum of all three colour channels [9]. ForL∗a∗b∗ based processing this is even easier, as just omitting theL∗
component already gives us a suitable chromaticity space, thea∗b∗ plane. The two dimensional
chromaticity plane of the colour space coverage is regularly sampled into16×16histogram bins. The lower and upper limits of the histogramming range have been set to cover the full possible range of values as provided by the image and the given library implementations (0.0 1.0 for RGB and -128.0 128.0 forL∗a∗b∗).
These histograms are directly used for the histogram intersection as in Swain and Ballard's original publication [10]. All images for colour indexing are of the same size, the individual objects appear roughly in the same size within the dierent images under the dierent illuminants, and they are taken in front of a black/neutral background. Therefore, for the evaluation runs no image alignment, scaling or other normalisation operation was necessary.
5 Experiments
For evaluation purposes we have run Barnard's complete image set [9] against the two colour constancy algorithms. Each algorithm was employed in four dierent variations: Each in an RGB and CIE LAB based algorithm, with the following chromatic adaptation based on the white point estimation performed in a channel scaling as well as a Bradford transformation. To prevent excessive pixel clipping Barnard has strongly underexposed the images, and encoded them in a 16 bit high dynamic range format. An alternative 8 bit format is also available, which we chose for our evaluation. This set is equally underexposed, and pixel clipping does occur, although only in very small quantities. The image set has been obtained by illuminating the scenes purely with eleven dierent illuminants. Some of these illuminants were quite extreme due to a blue lter used in together with some illuminants.
Another set of images has undergone the same set of colour correction means. This set consists of normal appearance images under various conditions. These were all exposed to suit a human viewer for on-screen viewing. The images range from old scanned photographs, over some colourful sample scenes (properly exposed and white balanced by the camera) to images taken under water with a stronger bluegreen cast.
For a quantitative evaluation through colour indexing Barnard provides an image set of 20 objects [9] taken under the same mentioned eleven illuminants. As in a typical colour indexing sample set, for each illuminant the pictured object has been shifted slightly or rotated within the scene. Again the before mentioned eight dierent methods for colour correction have been applied to each image before obtaining their histograms in the respective colour's chromaticity spaces. For reference colour indexing has been applied to un-corrected images as well, and the pure 1in20 random chance to choose the correct image from the set of objects has been calculated.
6 Results
The results have been evaluated both visually and quantitatively according to the experiments conducted (see Sect. 5). Additionally to colour indexing, a chromaticity gamut evaluation has been performed for the quantitiative analysis.
6.1 Visual Evaluation Results
and CIE LAB based processing on the one hand, as well as the chromatic adaptation strategy on the other hand.
First of all we have visually evaluated images of natural appearance that could be part of most people's photo collection. (Almost) already properly white balanced images did not show any signicant changes beyond the characteristics of the particular colour constancy algorithm that are worth discussing. Therefore, we are not going to present or discuss them in this paper any further. However, images with a visible and distracting colour cast do provide some potential for comparison. For this purpose we have used a 1950's photo of Wernher von Braun (Fig. 5) and an underwater picture (Fig. 6).
Figure 5: (left) Original 1950's picture of Wernher von Braun. (top row) Colour corrected according to Grey World Assumption. (bottom row) Colour corrected according to White Patch Retinex algorithm. Chromatic transformations (left to right): RGB channel scaling, RGB with Bradford transformation,L∗a∗b∗ with channel scaling,L∗a∗b∗ with Bradford transformation.
Both algorithms handle the removal of the yellowish vintage cast in Fig. 5 quite well. It is quite clearly visible, that a Bradford transformation applied with the RGB based estimation of the white point absolutely fails badly (second photo in the two rows). Both channel scaling as well as a Bradford transformation inL∗a∗b∗ work quite well and yield quite similar results.
Using an underwater scene from Fig. 6 with a strong bluegreen cast from the dominant light underwater reveals some stronger dierences. Colour constancy using the Grey World Assumption (top row) shows partially extreme colour shifts in the dominant colour of the water while processing on RGB colours (left two images in the row). With both colour constancy algorithms on RGB colours (left two images in both rows) a strong unnatural over saturation of skin colour can be observed, which is not obvious in the L∗a∗b∗ based processing. The human visual system has
evolved to be able to perceive certain colour dierences on a much more nely grained scale than others. We are able to determine the state of health of humans partly through noticing changes in skin colour. Additionally subtle changes in less saturated colours are much more obvious to the human eye. The CIE LAB colour model has been designed to reect the linearity of human colour perception. Therefore it is much more capable of accommodating transformations suitable for subtle changes in important colours, such as neutral greys and pale colours (as skin colour), which are important to humans' every day living conditions and survival.
[image:8.595.102.529.227.438.2]Figure 6: (left) Original under water photograph. (top row) Colour corrected according to Grey World Assumption. (bottom row) Colour corrected according to White Patch Retinex algorithm. Chromatic transformations (left to right): RGB channel scaling, RGB with Bradford transforma-tion,L∗a∗b∗with channel scaling,L∗a∗b∗ with Bradford transformation.
in the high intensity areas of the images. For the purpose of this publication we have increased the lightness of the original image (on the very left of Fig. 7 and Fig. 8). The images after the application of the colour constancy algorithms have not been altered, and have been up-scaled by the chromatic adaptation. Barnard has also used some quite extremely coloured illuminants for the scenes that provide a real challenge for the colour constancy implementations.
The ball in Fig. 7 has been exposed with an illuminant that is close to daylight, whereas the camera's white point is set towards accommodating an incandescent light source, resulting in a slight bluish cast.
Both implementations (Gray World Assumption and White Point Retinex) yield reasonably good results when using channel scaling for RGB (on the left of each row) as well as the Bradford transformation for L∗a∗b∗(on the right of each row). This is not very surprising, as von Kries
type transformation are prescribed for white point adaptations in the CIE based colour system. Comparing the non-neutral colours of these two with each other, one can see that the colours in
L∗a∗b∗ based transformations are not as saturated as in RGB based processing. The von Kries
type transformations preserve colour information relative to each other without trying to introduce colour space distortions. They preserve the saturation of the underexposed and therefore very undersaturated original image. Increasing the lightness of the original image for the publication was performed in an image manipulation tool, which operates by scaling on RGB channels, and therefore increases colour saturation as well.
It is quite obvious that the Bradford transformation applied to RGB based processing does not yield any reasonable results. As well as the simple channel scaling inL∗a∗b∗ colour space seems
to overcompensate on neutral colours (such as white), and under-compensate on more saturated colours (red, blue).
[image:9.595.104.528.110.336.2]Figure 7: (left) Ball under Solux 4700 illuminant (lightness increased for displaying, cropped images). (top row) Colour corrected according to Grey World Assumption. (bottom row) Colour corrected according to White Patch Retinex algorithm. Chromatic transformations (left to right): RGB channel scaling, RGB with Bradford transformation, L∗a∗b∗ with channel scaling, L∗a∗b∗
with Bradford transformation.
for. Again, the chromatic adaptations applied to their suitable colour spaces (channel scaling for RGB and von Kries transformation forL∗a∗b∗) perform well, and again the colours of theL∗a∗b∗
compensated space are slightly undersaturated. Some illuminants in the Barnard image set are very far away from natural daylight or other common and more neutral illuminants. The results are all comparably weaker on these extremes. But von Kries type CATs are known to work best on small changes, and their quality degrades with the magnitude of dierence. The other two compensations work noticeably worse and are not capable of compensating for the underexposed image (Bradford transformation on RGB), and for the strongly shifted white point (channel scaling onL∗a∗b∗). It is obvious that this eect is more strongly visible in this image set than in the one
from Fig. 7.
The question that arises now is this: Is it justiable, that the colour constancy algorithms are boosting colour saturation? One may argue that the colour corrected images look better (Figs. 8 and 7) compared with the expected outcome. But the colour constancy algorithms introduce a designated target saturation which is not to be found in the source images. In contrast, the
L∗a∗b∗ based colour constancy algorithms preserve better the subtle relationships of the colours,
particularly in the less saturated colour ranges (see Fig. 6). The whole basic idea in chromatic adaptation transformation following the von Kries concept is to adapt to dierent white points without introducing any signicant colour space distortions. This seems to work quite well when processing on CIE colour spaces such as CIE LAB. After all, the CIE prescribes the use of von Kries type CATs. Ocially, scaling is performed on CIE XYZ, but mostly accepted best practise is to use the Bradford transformation. Furthermore, it seems like single dominating colours (see Fig. 6) have much less of a strong negative eect on colour constancy algorithms applied to images in theL∗a∗b∗ colour space.
[image:10.595.101.529.109.302.2]Figure 8: (left) GretagMacbeth ColorChecker under Sylvana 50MR16Q light with Roscolux 3202 blue lter (lightness increased for displaying). (top row) Colour corrected according to Grey World Assumption. (bottom row) Colour corrected according to White Patch Retinex algorithm. Chro-matic transformations (left to right): RGB channel scaling, RGB with Bradford transformation,
L∗a∗b∗ with channel scaling,L∗a∗b∗ with Bradford transformation.
chromaticity. Von Kries type CATs have long been proven to be reliable on the CIE based colour spaces, and therefore should be applied on these as well.
6.2 Quantitative Evaluation
To achieve a better quantiable evaluation we have applied the dierent variations of colour con-stancy algorithms to the problem of colour indexing. The methodology follows closely the one as performed by Barnard [9], also using his image set of objects for this purpose (20 objects under eleven dierent illuminants). We have used this image set to perform colour corrections on the model database (a set of all objects under one illuminant), then perform the same colour con-stancy algorithm on an image under an arbitrary illuminant. Colour indexing then tries to identify it within the model database.
Some initially unexpected results in the behaviour of L∗a∗b∗ based colour indexing were
dis-covered. To analyse and explain this, we have determined the chromaticity gamuts (Sect. 6.2.2) for the dierent colour spaces.
6.2.1 Colour Indexing
[image:11.595.102.526.109.342.2]every one case of 11 (when illuminant of the object and of the model database are the same) an ideal match can be found (due to identical colour constancy treatment).
For comparison reasons the 1 in 20 random chance has been added to the table, along with no colour constancy algorithm to be applied (None). The table's values indicate a sucient quantitative indication that channel scaling is in comparison to the proper method not suitable forL∗a∗b∗ based processing, as well as the Bradford transformation is not suitable for RGB based
processing. It seems striking thatL∗a∗b∗ based colour indexing scores signicantly worse than the
[image:12.595.112.515.258.406.2]one based on RGB colours (its scores are comparable to no colour correction at all). Particularly as the visual evaluation of the processed image sets seemed quite promising. Reasons for this phenomenon will be given later in Sect. 6.2.2.
Table 1: Colour correction on un-clipped pixels only, colour indexing applied to all pixels.
Algorithm Score (1) Score (2) Score (3)
1 in 20 random chance 0.05 0.08 0.09
None, RGB 0.39 0.45 0.48
None,L∗a∗b∗ 0.25 0.31 0.33
White Patch Retinex, RGB, channel scaling 0.62 0.68 0.70
White Patch Retinex, RGB, Bradford transform 0.33 0.39 0.42
White Patch Retinex,L∗a∗b∗, channel scaling 0.24 0.30 0.33
White Patch Retinex,L∗a∗b∗, Bradford transform 0.38 0.45 0.48
Grey World, RGB, channel scaling 0.60 0.66 0.68
Grey World, RGB, Bradford transform 0.32 0.39 0.41
Grey World,L∗a∗b∗, channel scaling 0.27 0.32 0.35
Grey World,L∗a∗b∗, Bradford transform 0.38 0.45 0.47
Scores in Table 2 have been computed with colour indexing applied to un-clipped pixels only, just as the colour constancy algorithms discards clipped pixels. In comparison with Table 1 it is obvious that pixel clipping causes a strong negative inuence on image characterisation through colour indexing. Scores for both algorithm types when used with a combination of the proper chromatic adaptation for the used colour space consistently score much higher.
Table 2: Colour correction and colour indexing applied to un-clipped pixels only.
Algorithm Score (1) Score (2) Score (3)
1 in 20 random chance 0.05 0.08 0.09
None, RGB 0.35 0.39 0.41
None,L∗a∗b∗ 0.29 0.34 0.37
White Patch Retinex, RGB, channel scaling 0.80 0.85 0.86
White Patch Retinex, RGB, Bradford transform 0.23 0.27 0.29
White Patch Retinex,L∗a∗b∗, channel scaling 0.23 0.27 0.29
White Patch Retinex,L∗a∗b∗, Bradford transform 0.51 0.57 0.60
Grey World, RGB, channel scaling 0.80 0.83 0.85
Grey World, RGB, Bradford transform 0.25 0.29 0.31
Grey World,L∗a∗b∗, channel scaling 0.26 0.30 0.32
Grey World,L∗a∗b∗, Bradford transform 0.46 0.51 0.52
6.2.2 Chromaticity Gamuts
[image:12.595.113.515.506.654.2]cover the whole addressable space of the used colour encoding. As the sRGB colour space's is smaller and ts well inside the standard CIE LAB colour space, it seems logical, that the histogram bin utilisation in L∗a∗b∗ was worse than in RGB, yielding lower scores in colour indexing (see
Sect. 6.2.1).
To get an idea for the magnitude of this eect we have determined statistically the fraction of histogram bin usage. In average inrg chromaticity 25 % (std. dev. 6 %) for all, and 13 % (std.
dev. 5 %) for un-clipped pixels, of the available histogram bins were used. Ina∗b∗ chromaticity
however only 9 % (std. dev. 4%) and respectively 8 % (std. dev. 4%), were used. That means that only about 1/2 to 1/3 of all histogram the histogram bins were used for CIE LAB based colour indexing in comparison to the RGB based one. This seems to be the obvious reason for the decline in colour indexing scores when moving fromrg chromaticity toa∗b∗ chromaticity.
To analyse the chromaticity gamut more directly we have computed average histograms over all colour constancy adapted images of the set. The chromaticity gamut can be understood as a foot print or projection of all chromaticities occurring in the scenes.The histograms in Fig. 9 are averaged from 880 image histograms (20 objects under 11 illuminants colour corrected with four variants of colour constancy algorithms).
Fig. 9 highlights these gamuts in black on the chromaticity plane, discretised by the histogram bins. In colour above every one of these bins a column indicating the relative frequency of occur-rence is depicted. The sum over all images indicates only a small increase of therggamut (bottom
row) over the a∗b∗ gamut (top row). However, the colour distribution within the footprint is
much more narrowly condensed over the neutral centre in comparison to the rg chromaticities,
yielding only small eective information content usable for discrimination in colour indexing. Also therg chromaticity space suers of only being capable of utilising maximally1/2 of the available histogram space due to its triangular shape.
It is interesting to see that eect of pixel clipping in this gure. Most clipped pixels are quite close to neutral in their chromaticity leading to a dramatic increase in the centre columns ofa∗b∗
chromaticity, suppressing more subtle dierences in more saturated colours which carry important information for colour indexing. The same eect can be identied for rg chromaticities. But
beyond that, many of the clipped pixels (with less than three clipped channels), form strongly distinguishable peaks on the usually only very little populated perimeter of the rg chromaticity
space. Particularly these peaks in the extreme boundaries degrade colour indexing quality the most in practical applications.
7 Conclusion
The goal of this paper was to provide insights into the possibility of using the CIE basedL∗a∗b∗
colour space, as frequently used analytically and in industrial quality sensitive environments, for the domain of colour constancy. For this purpose two well known colour constancy algorithms, the White Patch Retinex and the Grey World Assumption algorithm have been implemented to work on an L∗a∗b∗ colour space. The implementation attempted to build on a 1:1 preservation
of the founding ideas of these algorithms without introducing any distorting improvements for a comparison. These algorithms are based on an implicit white point estimation, which is used to correct the colour space. We have analysed which methods of chromatic adaptation transformations work for theL∗a∗b∗colour spaces. The CIE prescribed von Kries type transformations specically
the Bradford transformation yielded good results. We showed results for successfully applied
L∗a∗b∗based colour constancy on several image sets, as well as validated the potential for usability
ofL∗a∗b∗ based colour constancy for the purpose of object recognition through colour indexing.
Finally we have discussed current weaknesses of the current implementation with indications on how to overcome them. Furthermore details for an implementation regarding the selection of histogram ranges as well as discarding clipped pixels have been highlighted.
0 0.25 0.5 0.75 1 r 0 0.25 0.5 0.75 1 g 0 0.25 0.5 0.75 1 r 0 0.25 0.5 0.75 1 g -128 -64 0 64 128 a* -128 -64 0 64 128 b* -128 -64 0 64 128 a* -128 -64 0 64 128 b*
Figure 9: Chromaticity gamuts and colour distribution averaged over all images. The top row depicts histograms in a∗b∗ chromaticity, with the same inrg chromaticity below. The diagrams
on the left show histogramming applied to un-clipped pixels only, whereas the right includes all clipped pixel values.
were not as underexposed, or more normally exposed to conrm the theory that the Bradford transformation preserves the saturation of underexposed imagery. Furthermore, the behaviour of the colour constancy algorithms with respect to used parameter sets (for dierent colour spaces) needs to be analysed to improve the eectiveness of the implementation. Lastly, it should be possible to signicantly improve the colour indexing performance by selecting histogramming ranges to t more tightly to the encountered chromaticity gamut.
Acknowledgements
Many thanks to my supervisor Dr. Napoleon Reyes for advice, helpful discussions and valuable input on various topics of colour science, and this research in particular.
References
[1] M. D. Fairchild, Color Appearance Models, 2nd ed. Chichester, UK: Wiley-IS&T, 2005. [2] Wikipedia, Colour Management, http://en.wikipedia.org/wiki/Colour_management, last
accessed January 2009.
[4] S. Süsstrunk, J. Holm, and G. D. Finlayson, Chromatic adaptation performance of dierent RGB sensors, IS&T/SPIE Electronic Imaging 2001: Color Imaging, vol. 4300, pp. 172183, January 2001.
[5] M. Ebner, Color Constancy, ser. Imaging Science and Technology, M. A. Kriss, Ed. West Sussex, England: Wiley-IS&T, 2007.
[6] G. K. Kloss, PyLittleCMS project, http://launchpad.net/pylittlecms, last accessed January 2009.
[7] M. Maria, LittleCMS project, http://littlecms.com/, last accessed January 2009.
[8] G. K. Kloss, Automatic C Library Wrapping Ctypes from the Trenches, The Python Papers, vol. 3, no. 3, pp. , December 2008, [Online available] http://ojs.pythonpapers.org/ index.php/tpp/issue/view/10.
[9] K. Barnard, Practical Colour Constancy, Ph.D. dissertation, Simon Fraser University, School of Computing, 1999. [Online]. Available: http://kobus.ca/research/publications/PHD-99/ [10] M. J. Swain and D. H. Ballard, Colour Indexing, International Journal of Computer Vision,