DESIGN AND DEVELOPMENT OF MATERIAL
CHARACTERIZATION SYSTEM USING MICROWAVE SIGNAL
KAVINA NISHANTHINI BALAN
DESIGN AND DEVELOPMENT OF MATERIAL
CHARACTERIZATION USING MCIROWAVE SIGNAL
KA VINA NISHANTHINI BALAN
This report is submitted in partial fulfilment of the requirements
for the degree of Bachelor of Electronic Engineering with Honours
Faculty of Electronic and Computer Engineering
Universiti Teknikal Malaysia Melaka
Tajuk Projek
Sesi Pengajian
UNIVERSITI TEKNIKAL MALAYSIA MELAKA FAKULTI KEJUTERAAN ELEKTRONIK DAN KEJURUTERAAN KOMPUTER
BORANG PENGESAHAN STATUS LAPORAN PROJEK SARJANA MUDA II
P.~~!gn
________
~n.g______
_
_
P~Y.~l~mm~nt__
_____
Qf _
_
_____
M~t~ri-~J_~h~rn~t~D.?.~tig_n_~Y~!~m
.
.V.~!ng_M!~rn~~~~-~-izr;~J. JQJ~/.7.QJ.2Saya
KAYINb
..
NJ.s.HANIBJNLA~P...
~A.J~AN mengaku membenarkan laporan Projek Sarjana Muda ini disimpan di Perpustakaan dengan syarat-syarat kegunaan seperti berikut:1- Laporan adalah hakmilik Universiti Teknikal Malaysia Melaka_
2. Perpustakaan dibenarkan membuat salinan untuk tujuan pengajian sahaja. 3. Perpustakaan dibenarkan membuat salinan laporan ini sebagai bahan
pertukaran antara institusi pengajian tinggi. 4_ Sil a tandakan (vi'):
D
SULIT*D
TERHAD*[2]
TIDAK TERHAD(
T~~AN
PENULIS) Alamat Tetap: ~:-:9~:-~---~.Q_l)_Q_QTarikh :
.RMY.~!,
_
__
__
_
__
__
p_~~~_E_>[email protected]~-~---Jl!lJp_~[I_(_, -~9..i.O.O..KJ:'~m.P.~r
Q_iJ~mrnrLi.O.J.9.
(Mengandungi maklumat yang berdarjah keselamatan atau kepentingan Malaysia seperti yang tennaktub di dalam AK.TA RAHSIA RASMI 1972)
(Mengandungi maklumat terhad yang telah ditentukan oleh organisasi/badan di mana penyelidikan dijalankan.
Disahkan oleh:
(COP DAN TANDATANGAN P~~fr\3ln:\bd.
PrOf Maciya
or.
Mooamao i.0t00· profnor Madyo
E\lkt!Olllk din Ke)uruternn Kom
F•ltl Ke)uruteltl~~llcal Malay1la Melalta {UTeM Untvers •~"Y-1•
Hans Tuah
Jav-76100 {)url11n Tun~~I. Melaka
DECLARATION
I declare that this report entitled "Design and Development of Material
Characterization Using Microwave Signal" is the result of my own work except for
quotes as cited in the references .
Signature
...
.
~
... .Author
APPROVAL
I hereby declare that I have read this thesis and in my opinion this thesis is sufficient
in terms of scope and quality for the award of Bachelor of Electronic Engineering with
Honours.
Signature
Supervisor Name
Date
Prof. Madya Or. Mohamad Zoinol Abidln Bin i\bd. Aziz ························;,;:Madya
Fakultl Ktjurutel"lln El lit dtn Kejwuterun Komputtr
Untversltl ~tnlkal Malaysia Melaka (UTeM)
...
~/~
.
~/~/~.
···
~~~~-~~~Jayal
DEDICATION
Specially dedicated to my family:
Mr.Plendran Arjunan
Mr Balan
Mrs Rajeswary
Dr. Poovarasi
Mrs Premavathy
Mr Gobinathan Manickam
Who have encouraged, guided and inspired me throughout of my journey
Mr.Mathialagan Vengadeson
Ms.Narmatha Priya
Dr Sam Weng Yik
& supervisor
ABSTRACT
Material characterization system is needed to characterize the dielectric properties
of the materials. A free space transmission and reflection (T/R) material
characterization system is designed to study dielectric properties of wood, FR-4,
acrylic, polystyrene and cardboard box. The project started with designing the material
characterization system where material placed in between two antennas which are
connected to Vector Network Analyzer (VNA) through cables. For characterization
purpose, 2x2 microstrip antenna array designed at the resonant frequency 2.4GHz and
with gain of 6 dB and 100 MHz of bandwidth. Measurement process carried out in
each position of the material and measurement data obtained in reflection coefficient
(S 11) and transmission coefficient (S2 l) and analyzed using time-domain analysis.
The calculated permittivity of five materials for S 11 matches with reference value
taken from reliable source. Wood material's calculated permittivity for the distance of
5cm is 2.7 falls within reference range 1.4-2.9 whereas for S21 is 3.8 do not match
with it. On other hand, Radar Cross Section (RCS) analysis carried out using
MATLAB visually observe the characterization of each material at range of
frequencies. It can be concluded, the designed system can characterize material for
11
ABSTRAK
Sistem pencirian bahan diperlukan untuk mencirikan sifat-sifat dielektrik bahan.
Sistem penyaringan bahan ruang bebas ruang dan balikan (T/R) direka untuk mengkaji
sifat-sifat dielektrik kayu, FR-4, akrilik, polistirena dan kotak. Projek ini bermula
dengan membentuk sistem pencirian material di mana bahan ditempatkan di antara
dua antena yang disambungkan ke Vector Network Analyzer (VNA) melalui kabel.
Untuk tujuan ini, 2x2 mikrostrip antena array direka pada frekuensi resonan 2.4 GHz
dengan gandaan 6 dB serta 100 MHz jalur lebar. Proses pengukuran dilakukan pada
setiap kedudukan data bahan dan pengukuran yang diperolehi dalam koefisien
pantulan (SI l) dan koefisien transmisi (S2 l) dan dianalisis menggunakan analisis
domain waktu. Ketelusan yang dikira untuk lima bahan bagi S 11 sama dengan nilai
rujukan apabila dibandingkan. Ketelusan yang dikira untuk bahan kayu bagi jarak 5cm
ialah 2.7 termasuk dalam julat rujukan 1.4-2.9 manakala bagi S21 adalah 3.8 tidak
sepadan dengannya. Selain itu, analisis Radar Cross Section (RCS) yang dijalankan
menggunakan MATLAB visual mengamati pencirian setiap bahan pada kekerapan
frekuensi. Ia dapat disimpulkan, sistem yang direka bentuk boleh mencirikan bahan
111
ACKNOWLEDGEMENTS
A humble gratitude to God for blessing me with the opportunity and strengthening
to complete the work.
I would like to express my heartiest thanks to my worthy supervisor PM Dr Zoinol Abidin Bin Abdul Aziz whose encouragement, guidance and continuous support enabled me to carry out this project work. Indeed it is an honor for me to work with
him.
I also would like to thank Mr Sufian and Mr Imran for helping me out during
fabrication and measurement process. Without their help, I would not have completed
my measurement process successfully.
TABLE OF CONTENTS
Declaration
Approval
Dedication
Abstract
Abstrak
Acknowledgements
Table of Contents
List of Figures
List of Tables
List of Symbols and Abbreviations
List of Appendices
CHAPTER 1 INTRODUCTION
1.1 Project background
1.2 Problem Statement
1.3 Objective
1.4 Scope
IV
ii
iii
iv
vii
x
xii
xiii
1
2
4
1.5 Thesis outline
CHAPTER 2 BACKGROUND STUDY
2.1 Overview of Available Material Characterization Techniques
2.2 Microwave Characterization Techniques
2.3 Free-space Characterization Techniques
2.4 Microstrip Antenna Array
2.5 Summary
CHAPTER 3 METHODOLOGY
3.1 Flowchart of the Project
3.2 Microwave Characterization System
3.3 Hardware Development
v 5 6 6 13 21 27 31 32 33 35 39
3.3.1 2x2 Microstrip Antenna Array Design 41
3.3.1.1 2x2 Microstrip Antenna Array Design Process 42
3.3.1.2 Simulation Process 49
3.3.1.3 Fabrication Process 50
3.3. l .4 Measurement Process of 2x2 Microstrip Antenna Array 52
3 .4 Software development
3.4.1 MATLAB Coding for Time-Domain Analysis
3.4.2 MATLAB Coding for Radar Cross Section (RCS)
3.5 Material Characterization Measurement Process
55
55
56
3.6 Summary
CHAPTER 4 RESULTS AND DISCUSSION
4.1 2x2 Microstrip Array Antenna's Simulation Results
4.2 Material Characterization Result Analysis
4.3 Time-domain Analysis of Five Materials
4.3.1 Time-Domain Analysis of Wood
4.3.2 Time-domain Analysis of FR-4
4.3.3 Time-domain Analysis of Acrylic
4.3.4 Time-domain Analysis of Polystyrene
4.3.5 Time-domain Analysis of Cardboard box
4.4 Accuracy Level of Designed Characterization System
4.5 Radar Cross Sectioning (RCS)
4.6 Summary
CHAPTER 5 CONCLUSION AND FUTURE WORKS
5.1 Conclusion
5.2 Future Recommendations
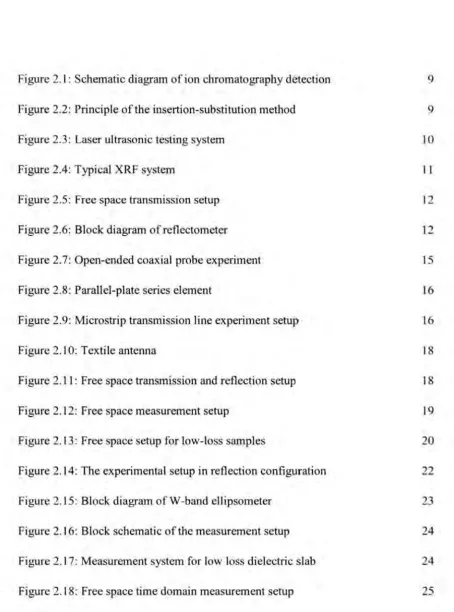
LIST OF FIGURES
Figure 2.1 : Schematic diagram of ion chromatography detection
Figure 2.2: Principle of the insertion-substitution method
Figure 2.3: Laser ultrasonic testing system
Figure 2.4: Typical XRF system
Figure 2.5: Free space transmission setup
Figure 2.6: Block diagram ofreflectometer
Figure 2.7: Open-ended coaxial probe experiment
Figure 2.8: Parallel-plate series element
Figure 2.9: Microstrip transmission line experiment setup
Figure 2.10: Textile antenna
Figure 2.11: Free space transmission and reflection setup
Figure 2.12: Free space measurement setup
Figure 2.13: Free space setup for low-loss samples
Figure 2.14: The experimental setup in reflection configuration
Figure 2.15: Block diagram of W-band ellipsometer
Figure 2.16: Block schematic of the measurement setup
Figure 2.17: Measurement system for low loss dielectric slab
Figure 2.18: Free space time domain measurement setup
Vil!
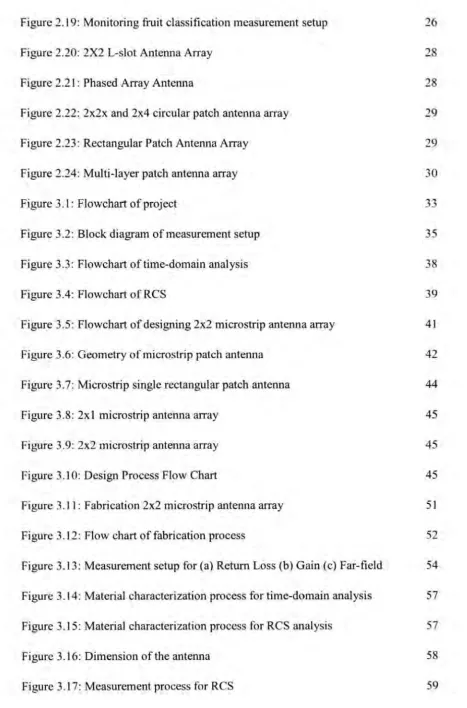
Figure 2.19: Monitoring fruit classification measurement setup 26
Figure 2.20: 2X2 L-slot Antenna Array 28
Figure 2.21: Phased Array Antenna 28
Figure 2.22: 2x2x and 2x4 circular patch antenna array 29
Figure 2.23: Rectangular Patch Antenna Array 29
Figure 2.24: Multi-layer patch antenna array 30
Figure 3.1: Flowchart of project 33
Figure 3.2: Block diagram of measurement setup 35
Figure 3.3: Flowchart of time-domain analysis 38
Figure 3.4: Flowchart of RCS 39
Figure 3.5: Flowchart of designing 2x2 microstrip antenna array 41
Figure 3.6: Geometry of microstrip patch antenna 42
Figure 3. 7: Microstrip single rectangular patch antenna 44
Figure 3.8: 2xl microstrip antenna array 45
Figure 3.9: 2x2 microstrip antenna array 45
Figure 3.10: Design Process Flow Chart 45
Figure 3.11: Fabrication 2x2 microstrip antenna array 51
Figure 3 .12: Flow chart of fabrication process 52
Figure 3.13: Measurement setup for (a) Return Loss (b) Gain (c) Far-field 54
Figure 3 .14: Material characterization process for time-domain analysis 57
Figure 3.15: Material characterization process for RCS analysis 57
Figure 3.16: Dimension of the antenna 58
IX
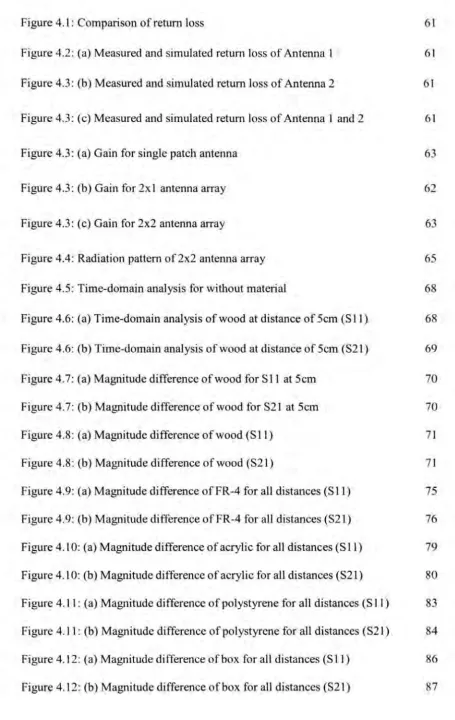
Figure 4.1 : Comparison of return loss 61
Figure 4.2: (a) Measured and simulated return loss of Antenna 1 61
Figure 4.3: (b) Measured and simulated return loss of Antenna 2 61
Figure 4.3: (c) Measured and simulated return loss of Antenna 1 and 2 61
Figure 4.3: (a) Gain for single patch antenna 63
Figure 4.3: (b) Gain for 2xl antenna array 62
Figure 4.3: ( c) Gain for 2x2 antenna array 63
Figure 4.4: Radiation pattern of2x2 antenna array 65
Figure 4.5: Time-domain analysis for without material 68
Figure 4.6: (a) Time-domain analysis of wood at distance of 5cm (SI 1) 68
Figure 4.6: (b) Time-domain analysis of wood at distance of 5cm (S21) 69
Figure 4.7: (a) Magnitude difference of wood for Sl 1 at 5cm 70
Figure 4.7: (b) Magnitude difference of wood for S21 at 5cm 70
Figure 4.8: (a) Magnitude difference of wood (SI 1) 71
Figure 4.8: (b) Magnitude difference of wood (S21) 71
Figure 4.9: (a) Magnitude difference of FR-4 for all distances (S 11) 75
Figure 4.9: (b) Magnitude difference ofFR-4 for all distances (S2 I) 76
Figure 4.10: (a) Magnitude difference of acrylic for all distances (S 11) 79
Figure 4.10: (b) Magnitude difference of acrylic for all distances (S2 I) 80
Figure 4.11: (a) Magnitude difference of polystyrene for all distances (S 11) 83
Figure 4.11: (b) Magnitude difference of polystyrene for all distances (S21) 84
Figure 4.12: (a) Magnitude difference of box for all distances (S 11) 86
x
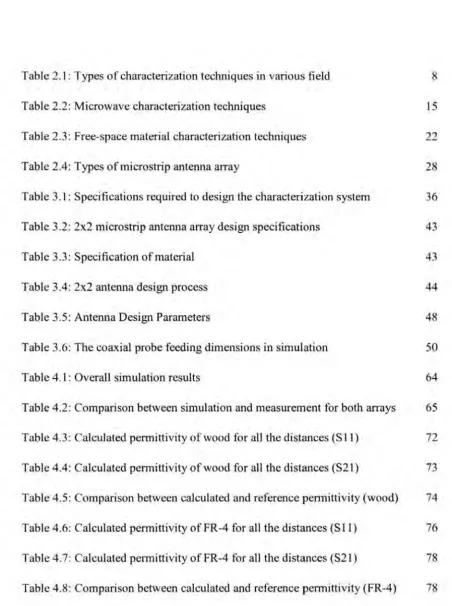
LIST OF TABLES
Table 2.1: Types of characterization techniques in various field 8
Table 2.2: Microwave characterization techniques 15
Table 2.3: Free-space material characterization techniques 22
Table 2.4: Types of microstrip antenna array 28
Table 3.1: Specifications required to design the characterization system 36 Table 3.2: 2x2 microstrip antenna array design specifications 43
Table 3 .3: Specification of material 43
Table 3.4: 2x2 antenna design process 44
Table 3.5: Antenna Design Parameters 48
Table 3.6: The coaxial probe feeding dimensions in simulation 50
Table 4.1: Overall simulation results 64
Table 4.2: Comparison between simulation and measurement for both arrays 65
Table 4.3: Calculated permittivity of wood for all the distances (S 11) 72
[image:16.600.70.522.155.761.2]XI
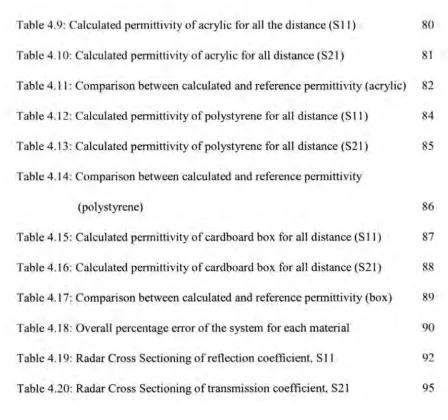
Table 4.9: Calculated permittivity of acrylic for all the distance (S 11) 80
Table 4.10: Calculated permittivity of acrylic for all distance (S2 l) 81 Table 4.11: Comparison between calculated and reference permittivity (acrylic) 82 Table 4.12: Calculated permittivity of polystyrene for all distance (S 11) 84 Table 4.13: Calculated permittivity of polystyrene for all distance (S21) 85 Table 4.14: Comparison between calculated and reference permittivity
(polystyrene) 86
Table 4.15: Calculated permittivity of cardboard box for all distance (S 11) 87
Table 4.16: Calculated permittivity of cardboard box for all distance (S21) 88
Table 4.17: Comparison between calculated and reference permittivity (box) 89 Table 4.18: Overall percentage error of the system for each material 90 Table 4.19: Radar Cross Sectioning of reflection coefficient, S 11 92
XII
LIST OF SYMBOLS AND ABBREVIATIONS
AUT Antenna Under Test MUT Material Under Test
s
11 Reflection CoefficientS21 Transmission Coefficient VNA Vector Network Analyzer
XRF X-ray Fluorescence d Distance
XIII
LIST OF
APPENDICES
CHAPTERl
INTRODUCTION
This chapter briefly discuss on the project background. This chapter also includes
problem statement, objective, scope of the project and the thesis outline
1.1 Project background
Material characterization is very essential nowadays since it is mainly focused in
numerous applications ranging from designing electronic circuit to satellite
applications. Material characterization is mainly about characterizing a material· s
properties in terms of chemical, mechanical and physical. As for instance, physical
characteristic of material incorporate color, dimension, texture and thickness that
defines the material physically. Properties that describes how a substance changes into
completely different substance are called chemical properties such as flammability,
2
those properties that involve a reaction to an applied load. The most common
mechanical properties are stiffness, ductility, impact resistance and fracture toughness.
The need of material characterization is for determining a particular material· s
properties to enhance its functionality or properties and also classify them in
applications it belongs to. Without characterizing material properly, classifying cannot
be performed accurately and this may leads to damage to the material and to the user
of the material. Thus, material characterization is important and there are numerous
techniques presented such as chemical analysis, ultrasonic characterization, x-ray
spectrometry characterization and microwave characterization.
Our main focus of this project is characterization involving free space
measurements of solid materials. When it comes to characterizing material in
microwave frequency region, the main attention is given to dielectric properties of
material. Dielectric properties plays important role in a material because it is providing
beneficial details about the storage and dissipation of electric and magnetic in materials
and also provides insight into the feasibility of using the material in potential
applications.
1.2 Problem Statement
Material characterization is the process of measuring and determining physical,
chemical, mechanical and microstructural properties of materials. Through
characterization process, able to extract fundamental properties of any type material.
It also determines the use of material along with its advantages and deficiency. Adding
to that characterization of materials helps to understand and quantify whether a
3
not properly characterized and used in an automotive, aerospace or biomedical product
can be very dangerous as it has the potential of putting user in danger.
ln general, materials can be classified into conductors, semiconductors and
insulators or dielectric materials. Hence, dielectric materials plays an important role in
our daily life especially every electronic circuit. In most cases, electronic circuits are
built using dielectric materials for high frequency operations and performance of the
operation is totally depends on the dielectric properties of the material that used to
build in. Consequently, there is need to have understanding of the properties of
dielectric materials at such operating frequency.
The measurement of dielectric properties at microwave frequency as well as in radio
frequency (RF) is very relevant especially in the analysis exploration, such as in
biomaterial science, telecommunication field and also microwave circuit design.
Ordinarily, the techniques used for the microwave characterization of dielectric
materials are classified into different groups which are transmission/ reflection line
method, open ended coaxial method, component design approach and free space
method.
Most of these techniques are widely used and each techniques has its own
constraints along with the frequency at which the measurements can be performed and
the type of material that can be measured. Component design approach and free space
measurement technique is our main focus in microwave characterization.
Component design approach is concerned to materials for designing such as antennas, absorber and sensor to enhance the performance in its own application.
4
materials takes a longer time. This is mainly because the material has to be characterized under different technical design parameters. Thus, it also cause a delay in simulation process.
Moreover, component design approach is not universal in where it is not applicable other than its own application because it may not function accurately due to the difference in structure and properties of material. Adding to that, component design approach is considered as the destructive technique that can damage the material. This is because due to characterizing the same material under different technical parameters repetitively.
The drawbacks of component design approach can be overcome with free space
transmission-reflection method known as non-destructive technique. In transmission-reflection method, object is the interface between transmitter and receiver. A simple setup is only needed that do not requires expensive equipment for characterizing purpose. Since, this method can be considered more pragmatic approach, we have considered to apply this technique to characterize the dielectric properties of solids.
1.3 Objective
• Design and develop material characterization system based on free space
transmission-reflection method to characterize dielectric properties of solids.
1.4 Scope
The scope of project are listed as below:
5
2. System integration deployment of free space transmission-reflection (T/R) measurement system.
3. Testing the developed free space transmission-reflection (T/R) measurement system to characterize dielectric properties of solids
1.5 Thesis outline
This thesis consists of five chapters which are categorized as below:
Chapter 1: Introduction-This chapter introduces and explains the purpose of this
project through problem statement, objective and scope of the project.
Chapter 2: Literature Survey- This chapter provides a detailed background of the
material characterization and methods used to characterize material properties.
Chapter 3: Methodology-This chapter describes the methods and procedures used
to design this project in details as well as flow charts, discussion on selection of method to be used in this project and further details to design the system.
Chapter 4: Result and discussion- This chapter illustrates and analyses the result
of this project and discusses the possible further improvements of the developed device.
Chapter 5: Conclusion and recommendation-This chapter presents the conclusion