Children Adopted from Care
in Northern Ireland
2017/18
Reader Information
Document purpose This bulletin details statistical information relating to children adopted from care in Northern Ireland during the year ending 31 March 2018.
Reporting period 1 April 2017 – 31 March 2018
Authors / statisticians Heidi Rodgers and Iain Waugh
Publication Date 27th September 2018
Issued by Community Information Branch
Information & Analysis Directorate Department of Health
Stormont Estate, Belfast, BT4 3SQ, Northern Ireland Tel (028) 90522580
Email cib@health-ni.gov.uk
www.health-ni.gov.uk/articles/children-adopted-care
Target Audience Directors of Children’s Services, Chief Executives of Boards and HSC Trusts in Northern Ireland, health care professionals, academics and social care stakeholders.
Copyright This publication is Crown copyright and may be reproduced free of charge in any format or medium. Any material used must be acknowledged, and the title of the publication specified.
Statistics and research for the Department of Health is provided by the Information and Analysis Directorate (IAD). IAD is responsible for compiling, processing, analysing, interpreting and disseminating a wide range of statistics covering health and social care.
The statisticians within IAD are out posted from the Northern Ireland Statistics & Research Agency (NISRA) and the statistics are produced in accordance with the principles and protocols set out in the Code of Practice for Official Statistics.
www.health-ni.gov.uk/topics/doh-statistics-and-research
IAD comprises four statistical sections: Hospital Information, Community Information, Public Health Information & Research and Project Support Analysis.
This publication is produced by Community Information Branch.
Our Vision and Values About Community Information Branch
Provide up-to-date, quality information on children and adult social services and community health;
to disseminate findings widely with a view to stimulating debate, promoting effective decision-making and improvement in service provision; and
be an expert voice on social care information.
The purpose of Community Information Branch (CIB) is to promote effective decision making in children and adult social services by providing quality information and analysis.
We collect, analyse, and publish a wide range of community information that is used to help monitor the delivery of personal social services policy. Information collected by CIB is used to assess HSC Trust performance, for corporate monitoring, policy evaluation, and to respond to parliamentary/assembly questions.
www.health-ni.gov.uk/topics/dhssps- statistics-and-research-social-services/social-care-statistics
Content
Reader Information ... 2
Content ... 4
Key findings ... 5
Introduction ... 7
Children Adopted from Care in Northern Ireland 2017/18 ... 8
Adoptions from care ... 8
The adopters ... 9
Children adopted from care... 10
Table 1 Looked after children adopted from care (year ending 31 March) ... 10
Timing of the adoption process ... 11
Table 2 Duration of final period of care (year ending 31 March) ... 11
Table 3 Average durations between different stages of the adoption process (year ending 30 March) 12 Table 4 Average ages of children at different stages of the adoption process (year ending 31 March) . 15 Table 5 Average duration between different stages of the adoption process by age at the start of the last period in care (year ending 31 March) ... 16
Adoption process by age group ... 17
Table 6 Average duration between Trust LAC best interest proposal and adoption by age, year ending 31 March 2018 ... 17
Type of adopters ... 18
Table 7 Type of adoptions / pathways to adoption, year ending 31 March 2018 ... 18
Table 8 Average durations between different stages of the adoption process by type of adopters (year ending 31 March 2018) ... 20
Table 9 Average ages of children at different stages of the adoption process by type of adopters (year ending 31 March 2018) ... 20
UK adoption statistics comparison ... 21
Table 10 Adoption statistics for Northern Ireland, England and Wales (year ending 31 March) ... 21
Appendix A – Technical Notes ... 22
Appendix B - Additional Tables ... 25
Table 11 Number of Children adopted from Care in Northern Ireland (year ending 31 March) ... 25 Table 12 Number of Children adopted from Care in Northern Ireland by HSC Trust (year ending 31
Key findings
This bulletin details statistical information relating to children adopted from care in Northern Ireland during the year ending 31 March 2018, including a range of information about these children and their adopters, and durations between different stages in the adoption process. The bulletin is based on the Department of Health’s statistical return AD1 2017/181, collected from
each of the Health and Social Care Trusts in Northern Ireland.
Eighty-four children were adopted from care in Northern Ireland during the year ending 31 March 2018;
The average age of children at the time of adoption was 4 years 2 months, three months younger compared to the previous year;
From the child’s last entry into care, the average length of time for a child to be adopted in 2017/18 was 3 years 2 months. This was two months longer than in the previous year;
For children adopted in 2017/18, the average duration from the HSC Trust proposal that adoption was in the best interest for the child (the LAC Best Interest Proposal) to the Adoption Order was 2 years 2 months, two months shorter than in 2016/17;
Children adopted by Concurrent Carers2 were substantially younger at the time of adoption (3
years 0 months compared with the national average of 4 years and 2 months). They also had a shorter last duration in care (2 years 3 months compared with 3 years 2 months).
1 Please see Appendix for details of the return.
Introduction
Adoption, unlike any other permanence option, involves the ending of a child’s legal relationship with their birth parents and family and the creation of a lifelong relationship with new parents. The facilities to be provided as part of the adoption service, including arrangements for assessing children and prospective adopters, placing children for adoption, and the particular procedures to be followed before and after a child is placed for adoption are all specified in legislation – the Adoption (Northern Ireland) Order 1987 and the Adoption Agencies Regulations (Northern Ireland) 1989.
This legal framework and the processes that Social Workers are expected to adhere to in carrying out their duties in relation to Adoption Services are further explained in the Adoption Regional Policy and Procedures (2017)3, 4.
As part of review of the adoptive child’s Care Plan, where it is decided that adoption is the preferred option for permanence, the Health and Social Care (HSC) Trust must follow statutory processes. This includes providing information and counselling to the child and parents, gathering information (including ascertaining the wishes and feelings of the child and parents) and referring a report to the Adoption Panel and the Adoption Agency Decision-maker for consideration of a Best Interests Decision (whether the child should be placed for adoption). Usually the HSC Trust will work to find a suitable match for the child with prospective adopters whilst Freeing Order proceedings are commenced. Following formal placement for adoption of the child with the prospective adopters, the adopters can apply to the Court for an Adoption Order to be made.
In respect of applications by prospective adopters, the Adoption Agency must follow prescribed processes in relation to the applicant, from the Initial Enquiry/ Counselling Interview through to the Preliminary Checks, Preparation Course, Pre-Assessment Checks, the Assessment Process and finally, a consideration by the Adoption Agency’s Adoption Panel as to the suitability of the applicant.
Work is currently underway to modernise adoption legislation through the introduction of a new Adoption and Children Bill. It is intended that the Bill will largely replace the 1987 Order, effecting most of the proposals outlined in the Department’s draft adoption strategy, Adopting the Future 2006. The Bill will also amend the Children (Northern Ireland) Order 1995, which is the primary law relating to the care and protection of children. As most children are adopted from the care system, the amendments are designed to improve planning and permanence for children in care.
Family and Children’s Policy Directorate Department of Health October 2018
3The Adoption Regional Policy and Procedures Dec 2010
Children Adopted from Care in
Northern Ireland 2017/18
Adoptions from care
During the year ending 31 March 2018, 84 children were adopted from care in Northern Ireland. This was a decrease of 30% on the previous year however similar to the four years prior to that (see Figure 1).
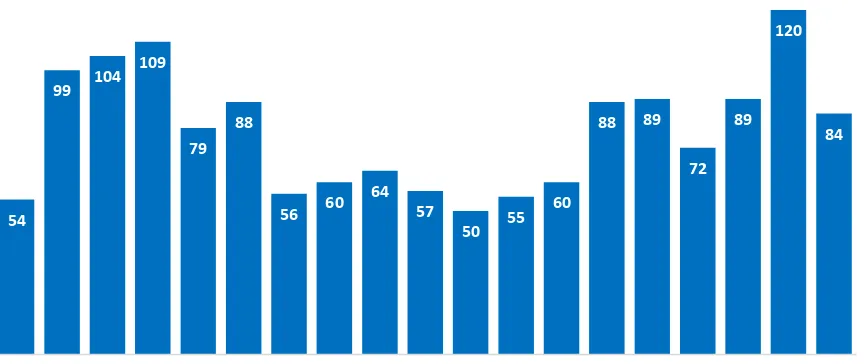
[image:8.595.92.525.497.679.2]Figure 1 sets out the yearly number of adoptions from care. It shows that adoption numbers were notably high between 2001 and 2003 – this is thought to be due to an emphasis by all Health and Social Care (HSC) Trusts on encouraging prospective adopters to register as foster carers, resulting in a placement for children at the earliest juncture with foster carers who would then go on to adopt the child5. Between 2005/06 and 2011/12, the numbers of adoptions were steady, however somewhat lower (between fifty and just over sixty children a year). The increase from 2013 could be linked with renewed focus on adoption and the timeliness of the adoption process, for example with the establishment of Adoption Regional Information System to help identify suitable parents for children in a timely fashion.
Figure 1 Number of children adopted from care in Northern Ireland (year ending 31 March)
Source for years 2000 and 2001: Adopting Best Care, Social Services Inspectorate, DHSSPS May 2002
Source from 2003: AD1 Surveys, DoH https://www.health-ni.gov.uk/articles/children-adoopted-care Note: Number of adoptions has been estimated for the years 2002, 2007, 2009 and 2011.
5 Adopting Best Care, Social Services Inspectorate, DHSSPS May 2002
54
99 104 109
79 88
56 60 64
57
50 55 60
88 89 72
89 120
84
Figure 2 Number of children adopted from care by HSC Trust year ending 31 March 2018 (percentage of all children adopted from care)
HSC Trust Number
% of all adopted children
Belfast 12 14%
Northern 15 18%
South Eastern 22 26%
Southern 16 19%
Western 19 23%
Northern Ireland 84 100%
© Crown copyright 2018
The South Eastern HSC Trust had the largest number of looked after children adopted from care in 2017/18 (22 children), followed by the Western HSC Trust where 19 looked after children were adopted. In the Southern, Northern and Belfast, 16, 15 and 12 looked after children were adopted respectively. As the number of children adopted in each HSC Trust is quite small, care must be taken when making year on year comparisons6.
The adopters
Some 85% of adopters were married couple adopters, with a further 11% unmarried different sex couples. The remaining adopters were either in civil partnership or single female adopters. Of all the adopters, 10% had previously adopted a child or children7, and 23% had dependent birth children in the household. The age of the adopters ranged from late twenties to late fifties, with the largest proportion of the adopters being in their forties at the time of the adoption (52%).
6 Please see Appendix for yearly figures.
Children adopted from care
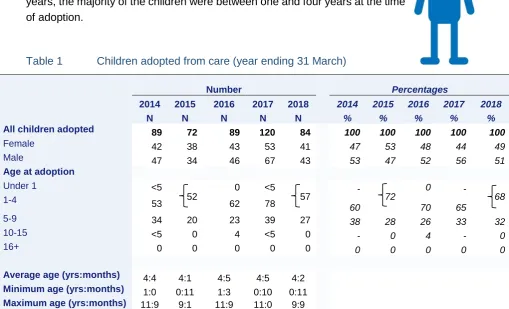
[image:10.595.52.562.148.457.2]Table 1 sets out the main characteristics of children adopted from care in Northern Ireland from 2013/14 to 2017/18. In 2017/18, the age of children adopted from care ranged from 11 months to 9 years 9 months. As in previous years, the majority of the children were between one and four years at the time of adoption.
Table 1 Children adopted from care (year ending 31 March)
Number Percentages
2014 2015 2016 2017 2018 2014 2015 2016 2017 2018
N N N N N % % % % %
All children adopted 89 72 89 120 84 100 100 100 100 100
Female 42 38 43 53 41 47 53 48 44 49
Male 47 34 46 67 43 53 47 52 56 51
Age at adoption
Under 1 <5
52
0 <5
57 - 72
0 -
68
1-4 53 62 78
60 70 65
5-9 34 20 23 39 27 38 28 26 33 32
10-15 <5 0 4 <5 0 - 0 4 - 0
16+ 0 0 0 0 0 0 0 0 0 0
Average age (yrs:months) 4:4 4:1 4:5 4:5 4:2
Minimum age (yrs:months) 1:0 0:11 1:3 0:10 0:11
Maximum age (yrs:months) 11:9 9:1 11:9 11:0 9:9
In order to avoid personal disclosure, some cells have been supressed or merged when the actual figure is less than 4.
'-' represents a percentage that has been supressed in order to prevent the actual figure from being calculated.
The majority of the children adopted from care were of white ethnic background (98%) with the remaining children being of mixed ethnicity. Some sixteen children (19%) had special needs or a disability. This included physical disabilities, sensory impairments, learning disabilities, autism and behavioural difficulties. In 2017/18, 57 of the children (68%) were adopted as a single child adoption whereas 32% were adopted as part of a sibling group.
32%
Timing of the adoption process
8The average length of time between the date the child’s last period of care started to the Adoption Order was made was 3 years 2 months in 2017/18. The average length has stayed around three years since 2013/14. Just over a fifth of the children (21%) were adopted within two years of entering the final period of care. Some six children (7%) had been in care for five years or longer at the time of adoption.
[image:11.595.83.301.153.335.2]For some children who enter care, adoption is the preferred means to secure permanency and stability and the agreed care plan would be identified at an early juncture. For other children, adoption may not be considered until the child has spent some time in care, for example after changes to the child’s family situation which makes it unlikely that the child can return home to birth parents. This will in some cases explain the above variation in durations, where the shortest time from entering care to adoption was 11 months and the longest time was 9 years 6 months.
Table 2 Duration of final period of care (year ending 31 March)
Duration of final period of care
Year Year
2014 2015 2016 2017 2018 2014 2015 2016 2017 2018
N N N N N % % % % %
Under 2 years 20 14 17 27 18 22 19 19 23 21
2 years to under 3 years 34 20 31 40 24 38 28 35 33 29 3 years to under 5 years 33 32 36 45 36 37 44 40 38 43
5 years and over 2 6 5 8 6 2 8 6 7 7
All 89 72 89 120 84 100 100 100 100 100
Average duration (yrs:months) 2:11 3:1 2:11 3:0 3:2
Minimum duration (yrs:months) 0:5 0:9 0:7 0:10 0:11
Maximum duration (yrs:months) 10:7 7:11 6:5 7:5 9:6
There are a number of factors however that may cause delays to the duration of the adoption process. Although every child’s situation is unique, with regards to the children adopted during 2017/18, it has been highlighted that some delays were influenced by delays within the court
8 Please note that there has been a slight change to methodology which has caused minor revisions to some historic figures.
system, additional assessments of family members had to be carried out; appeals within the Courts delayed the adoption process; and for some children there were delays to allow siblings to be adopted together.
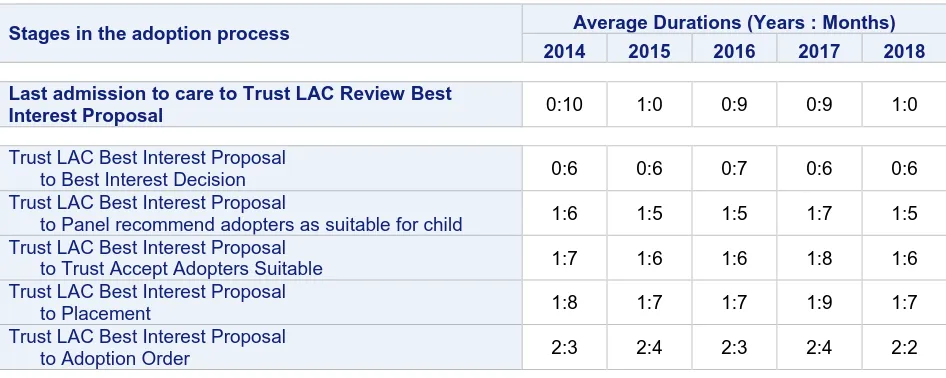
Table 3 sets out the duration between different stages of the adoption process. The average duration from last admission into care to Trust LAC Best Interest Proposal for children adopted in 2017/18 was 1 year, three months longer than in 2016/17. The Trust LAC Best Interest Proposal is the child’s LAC Review where it is agreed to pursue adoption as an option and refer the child’s circumstances to the Adoption Panel for recommendation. In general it took 6 months from the Trust LAC Best Interest Proposal to when the Trust accepted the Adoption Panel’s recommendation that adoption was in the best interest of the child (Best Interest Decision); this period ranged from 1 month to 2 years 5 months for the children adopted. Furthermore, the average duration from LAC Best Interest Proposal to the date the Trust accepted the Panel’s recommendation that adopters were suitable for the particular child was 1 year 5 months.
[image:12.595.65.538.422.611.2]For children adopted in 2017/18, the average duration from the Trust LAC Best Interest Proposal to adoption was 2 years 2 months, similar to that of recent years. In 2017/18, this ranged from 9 months to 4 years 4 months.
Table 3 Average durations between different stages of the adoption process (year ending 30 March)
Stages in the adoption process Average Durations (Years : Months)
2014 2015 2016 2017 2018
Last admission to care to Trust LAC Review Best
Interest Proposal 0:10 1:0 0:9 0:9 1:0
Trust LAC Best Interest Proposal
to Best Interest Decision 0:6 0:6 0:7 0:6 0:6 Trust LAC Best Interest Proposal
to Panel recommend adopters as suitable for child 1:6 1:5 1:5 1:7 1:5 Trust LAC Best Interest Proposal
to Trust Accept Adopters Suitable 1:7 1:6 1:6 1:8 1:6 Trust LAC Best Interest Proposal
to Placement 1:8 1:7 1:7 1:9 1:7
Trust LAC Best Interest Proposal
to Adoption Order 2:3 2:4 2:3 2:4 2:2
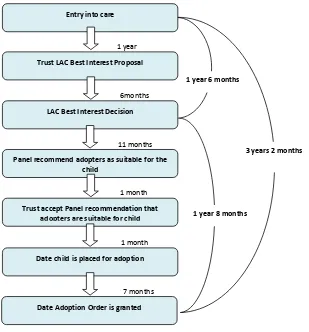
Figure 3 Average durations between different stages of the adoption process (year ending 31 March 2018)
Note: The time between different stages of the adoption process may not add to the total time as a small number of cases have been excluded from some of the interim calculations due to missing values or dates.
3 years 2 months 1 year 6 months
1 year 8 months 6months
11 months
1 month 1 month
7 months 1 year
Trust LAC Best Interest Proposal
LAC Best Interest Decision
Panel recommend adopters as suitable for the child
Trust accept Panel recommendation that adopters are suitable for child
Date child is placed for adoption
The Health and Social Care Commission Plan and Indicators of Performance Direction (Northern Ireland) 2018
Percentage of children who are adopted within three years of last entering care
Adoption is not the best option for every child who is in care; however for those children where adoption would be in their best interest, it is important that this is identified early to ensure that the child can be placed in a stable family setting.
Ensuring the timeliness of the adoption process is a priority for the Department of Health. This is reflected in its Commissioning Plan Direction9 which includes a target and an indicator relating to the timing of the adoption process.
The target sets out that 90% of all adoptions from care should be completed within three years of last entering care.
Percentage of children adopted within three years of last entering care
Please note that some of the cohorts above are based on low number of children.
The timing of the adoption relates to many factors and is unique for each individual child. Two factors that may influence the adoption journey are the child’s age when entering care and if the child has a disability.
The type of adopters that the child can suitably be placed with is a reflection of the child’s care history and its personal circumstances.
As can be seen, a higher proportion of younger children, those without disabilities and those who were placed with concurrent carers were adopted within three years.
Length of time for Best Interest Decision to be reached in the adoption process.
Years: Months
2013/14 1:3
2014/15 1:5
2015/16 1:4
2016/17 1:3
2017/18 1:6
The overall adoption process involves court activity which may contribute to delays in the adoption process. The time up to the Best Interest Decision however reflects the part of the process that is mainly down to the HSC Trusts. As set out in the table, the time from the start of the final period in care to the Trust’s decision that adoption is in the best interest for the child was one year six months in 2017/18.
9https://www.health-ni.gov.uk/publications/ministerial-priorities 56% 41% 58% 57% 50% 0% 25% 50% 75% 100%
2013/14 2014/15 2015/16 2016/17 2017/18
Table 4 sets out the average age of the child at different points in the adoption process. In 2017/18, the average age of children at the time of their last admission into care was 1 year 1 month, ranging from the time of birth to 6 years 10 months.
Table 4 Average ages of children at different stages of the adoption process (year ending 31 March)
Stages in the adoption process Age (year:month)
2014 2015 2016 2017 2018
Age at last admission into care 1:6 1:0 1:6 1:6 1:1
Age at Best Interest Proposal 2:3 2:1 2:3 2:2 2:1
Age at Best Interest Decision 2:7 2:4 2:9 2:8 2:6
Age Panel recommended adopters as suitable for child 3:7 3:3 3:7 3:8 3:5 Age Trust accept recommendation that adopters are suitable for
child 3:7 3:4 3:8 3:9 3:6
Age placed for adoption 3:8 3:5 3:9 3:10 3:7
Age at Adoption Order 4:4 4:1 4:5 4:5 4:2
Note: Some children may be excluded from calculations due to missing values or dates.
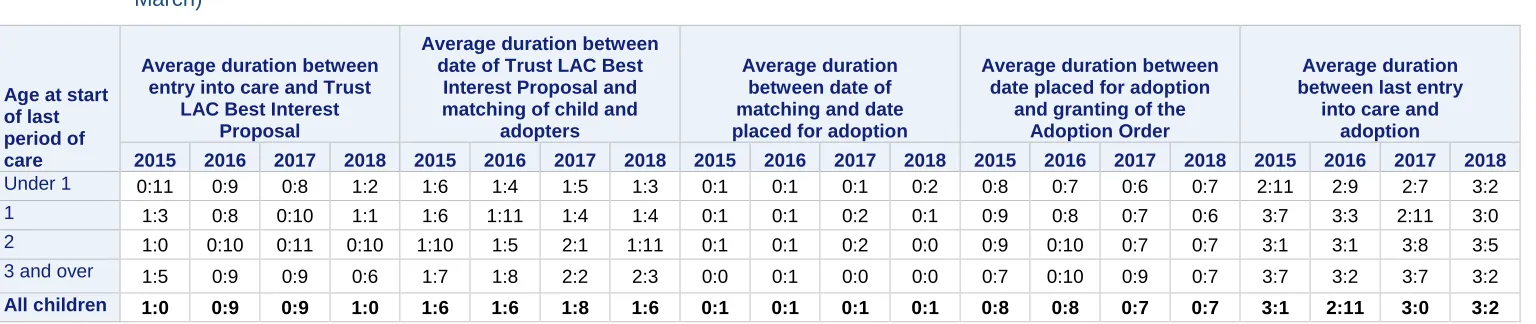
Table 5 Average duration between different stages of the adoption process by age at the start of the last period in care (year ending 31 March)
Age at start of last period of care
Average duration between entry into care and Trust
LAC Best Interest Proposal
Average duration between date of Trust LAC Best
Interest Proposal and matching of child and
adopters
Average duration between date of matching and date placed for adoption
Average duration between date placed for adoption
and granting of the Adoption Order
Average duration between last entry
into care and adoption
2015 2016 2017 2018 2015 2016 2017 2018 2015 2016 2017 2018 2015 2016 2017 2018 2015 2016 2017 2018
Under 1 0:11 0:9 0:8 1:2 1:6 1:4 1:5 1:3 0:1 0:1 0:1 0:2 0:8 0:7 0:6 0:7 2:11 2:9 2:7 3:2
1 1:3 0:8 0:10 1:1 1:6 1:11 1:4 1:4 0:1 0:1 0:2 0:1 0:9 0:8 0:7 0:6 3:7 3:3 2:11 3:0
2 1:0 0:10 0:11 0:10 1:10 1:5 2:1 1:11 0:1 0:1 0:2 0:0 0:9 0:10 0:7 0:7 3:1 3:1 3:8 3:5
3 and over 1:5 0:9 0:9 0:6 1:7 1:8 2:2 2:3 0:0 0:1 0:0 0:0 0:7 0:10 0:9 0:7 3:7 3:2 3:7 3:2
All children 1:0 0:9 0:9 1:0 1:6 1:6 1:8 1:6 0:1 0:1 0:1 0:1 0:8 0:8 0:7 0:7 3:1 2:11 3:0 3:2
The time between different stages of the adoption process may not add to the total time as some cases may be excluded from the in-between calculations.
0:0 is less than 1 month.
Adoption process by age group
Of the children adopted in 2017/18, almost seven tenths (69%) had entered their final period of care when they were under one year of age. A tenth (11%) entered the final period of care when they were aged 1, seven percent when aged two and thirteen percent were aged 3 or over. Table 5 (above) sets out the adoption process broken down by the age of the child at the time of entering the last period of care.
There was a variance of up to five months for the different age groups of the time between last entry to care and the Adoption Order in 2017/18. As in 2016/17, there was some difference between the duration from LAC Best Interest Proposal and matching of child and adopters. For those under one year when entering care, this took just over a year. For those aged three and over, this process took over two years. It is however worth noting that the numbers involved are small and care must be taken when making year on year comparisons.
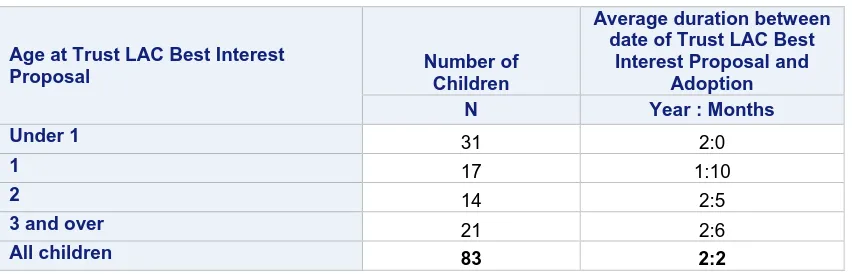
[image:17.595.79.505.434.571.2]The average duration from the Trust LAC Best Interest Proposal to adoption is set out in Table 6 below by the age of the child at the time of the LAC Best Interest Proposal. This shows that duration for a child aged one year or under at the time of the LAC Best Interest Proposal is generally shorter than those aged two years and older.
Table 6 Average duration between Trust LAC best interest proposal and adoption by age, year ending 31 March 2018
Age at Trust LAC Best Interest
Proposal Number of Children
Average duration between date of Trust LAC Best
Interest Proposal and Adoption
N Year : Months
Under 1 31 2:0
1 17 1:10
2 14 2:5
3 and over 21 2:6
All children 83 2:2
Type of adopters
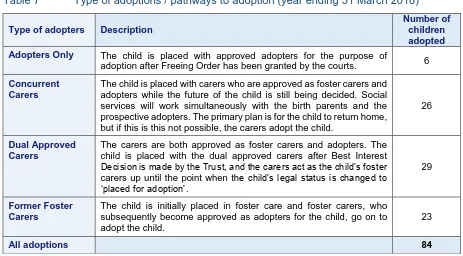
Recent years have seen a change in the way adoptions are processed prior to the Adoption Order is granted. In general, there are four pathways that can be followed, from the traditional route where a child is placed with approved adopters for the purpose of adoption, to being placed with concurrent carers while the future of the child is being decided10. In the latter case, social services will work with birth parents to assess if the child can return to their care, and if the child cannot return safely to their birth family’s care (and pending the approval of the courts) then the child goes on to be adopted by the concurrent carers.
Like concurrent carers, dual approved carers are also approved as both foster carers and adopters. Dual approved carers take the placement of a child after the Trust has agreed that the care plan for the child is adoption but prior to the court’s decision whether to free the child for adoption. So in this instance the child is also initially placed on a fostering basis. Both the options above reduces the time it will take to reach the Adoption Order and as such, permanency and stability for the child will potentially be achieved at an earlier stage.
[image:18.595.75.538.424.680.2]Finally, children who are adopted from care can be placed on a fostering basis with foster carers or kinship foster carers. When the child’s care plan changes to adoption, the foster carers, at that point, seek to become approved adopters to enable them to provide permanence for that specific child.
Table 7 Type of adoptions / pathways to adoption (year ending 31 March 2018)
Type of adopters Description
Number of children adopted Adopters Only The child is placed with approved adopters for the purpose of
adoption after Freeing Order has been granted by the courts. 6
Concurrent Carers
The child is placed with carers who are approved as foster carers and adopters while the future of the child is still being decided. Social services will work simultaneously with the birth parents and the prospective adopters. The primary plan is for the child to return home, but if this is this not possible, the carers adopt the child.
26
Dual Approved Carers
The carers are both approved as foster carers and adopters. The child is placed with the dual approved carers after Best Interest Decision is made by the Trust, and the carers act as the child’s foster carers up until the point when the child’s legal status is changed to ‘placed for adoption’.
29
Former Foster Carers
The child is initially placed in foster care and foster carers, who subsequently become approved as adopters for the child, go on to adopt the child.
23
All adoptions 84
10 The distinction between these four types of carers/adoption pathways was included in this survey for the first time in 2016/17.
The choice of the kind of carers the child is placed with will depend on the child’s unique circumstances. For a child to be placed with concurrent carers, it must be identified that there is likelihood, based on past history that the child may not be able to safely return home to the care of birth family. However the birth parents are afforded an opportunity to engage with service to demonstrate their parenting capacity and have their child returned. Another child may be placed in foster care, however the pathway of adoption may not be relevant for the child until sometime down the line. Because of these differences, it is expected that the time from a child’s last entry into care to the Adoption Order will differ between the four adoption routes, though the emphasis must be on achieving permanence whether that is through a return home to birth family or adoption as early as possible.
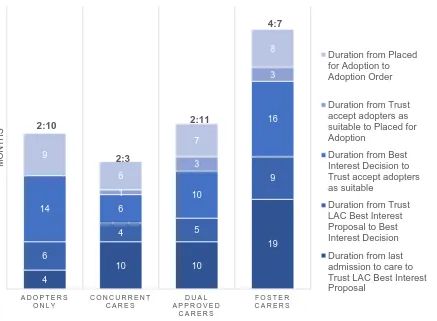
[image:19.595.93.530.377.698.2]As can be seen from Table 8 and Figure 4 below, average duration from entering care to Trust LAC Best Interest Proposal was considerably longer for those initially placed with Foster Carers. Furthermore, average duration from entering care to the granting of Adoption Order was considerably shorter for those placed with Concurrent Carers. The same general trend was observed in 2016/17.
Figure 4 Average durations between different stages of the adoption process by type of adopters, year ending 31 March 2018
Note: Some children may be excluded from calculations due to missing values or dates. Number above each column refers to year:month
4 10 10 19 6 4 5 9 14 6 10 16 1 3 3 9 6 7 8
A D O P T E R S O N L Y
C O N C U R R E N T C A R E S
D U A L A P P R O V E D
C A R E R S
F O S T E R C A R E R S
M
O
NT
HS
Duration from Placed for Adoption to Adoption Order Duration from Trust accept adopters as suitable to Placed for Adoption
Duration from Best Interest Decision to Trust accept adopters as suitable
Duration from Trust LAC Best Interest Proposal to Best Interest Decision Duration from last admission to care to Trust LAC Best Interest Proposal
2:10
2:3
2:11
Table 8 Average durations between different stages of the adoption process by type of adopters (year ending 31 March 2018)
Stages in the adoption process
Type of adopters
All adoptions Adopters Only Concurrent Carers Dual Approved Carers Foster Carers Duration from last admission to care to Trust LAC Best
Interest Proposal 0:4 0:10 0:10 1:7 1:0
Duration from Trust LAC Best Interest Proposal to
Best Interest Decision 0:6 0:4 0:5 0:9 0:6
Duration from Best Interest Decision to Panel
recommend adopters as suitable for this child 1:2 0:6 0:10 1:4 0:11
Duration from Panel recommend adopters as suitable
for this child to Trust accept adopters as suitable 0:0 0:1 0:1 0:1 0:1
Duration from Trust accept adopters as suitable to
Placed for Adoption 0:0 0:0 0:2 0:2 0:1
Duration from Placed for Adoption to Adoption Order 0:9 0:6 0:7 0:8 0:7
Last admission to care to Adoption Order 2:10 2:3 2:11 4:7 3:2
Note: Some children may be excluded from calculations due to missing values or dates.
It is expected that children in the four adoption routes may relate to somewhat different cohorts when looking at the age of the child at different stages of the adoption process. As can be seen in Table 9, children adopted by Concurrent Carers were on average considerably younger, at the time of the granting of the Adoption Order.
Table 9 Average ages of children at different stages of the adoption process by type of adopters (year ending 31 March 2018)
Type of adopters
All adoptions Adopters Only Concurrent Carers Dual Approved Carers Foster Carers
Age at last admission into care 0:10 0:9 1:3 1:2 1:1
Age at Best Interest Proposal 1:4 1:7 2:1 2:9 2:1
Age at Best Interest Decision 1:7 1:11 2:6 3:7 2:6
Age Panel recommended adopters as suitable for
child 2:9 2:4 3:4 4:10 3:5
Age Trust accept recommendation that adopters
are suitable for child 2:10 2:5 3:5 4:11 3:6
Age placed for adoption 2:10 2:6 3:7 5:1 3:7
Age at Adoption Order 3:7 3:0 4:2 5:9 4:2
UK adoption statistics comparison
[image:21.595.79.551.214.403.2]There is no common legislative framework operating across the United Kingdom relating to adoption, hence any statistics showing data for the four jurisdictions will not necessarily provide like-for-like comparisons. Bearing this in mind, Table 10, below, sets out some of the statistics published in Northern Ireland, England and Wales11.
Table 10 Adoption statistics for Northern Ireland, England and Wales (year ending 31 March)
Northern Ireland (2017/18)
England (2016/17)
Wales (2016/17)
All children adopted 84 4,350 312
Adoptions per 1,000 children in care at 31 March 28 60 52 Age at adoption
Under 1
68% 7% <1%
1-4 71% 82%
5-9 32% 21% 16%
10-15 - 1% <1%
16+ - - <1%
Average age at adoption (yrs:months) 4:2 3:4 3:4
Average duration of last period of care (yrs:months) 3:2 2:0 2:2
‘ – ‘ indicates that information is not available
Source: AD1 returns, Children adopted from care in Northern Ireland, DoH
Source: Children looked after in England (including adoption) year ending 31 March 2017 Source: Children looked after by local authorities in Wales 2016/17
Note: there is no common legislative framework operating across the United Kingdom relating to adoption, hence any statistics will not necessarily provide like-for-like comparisons.
In general, children adopted from care in Northern Ireland were on average older and had spent longer time in care than that of children adopted from care in England and Wales.
Around a quarter of children adopted from care in both England and Wales were aged five or over at the time of adoption. This compares with over a third of children in Northern Ireland. The average duration from last entry into care to the granting of the adoption order was two years in England and two years two months in Wales. In Northern Ireland the average duration was three years two months.
Appendix A – Technical Notes
Data Collection
The figures for “Children adopted from care in Northern Ireland 2017/18” are derived from the eleventh ‘AD1’ survey of children adopted from care in Northern Ireland. The AD1 survey return was provided by each of the five Health and Social Care Trusts in Northern Ireland to Community Information Branch (CIB) within the Department of Health (DoH).
The AD1 survey was introduced in 2004, and its primary aim is to monitor the numbers of children adopted from care and the timescales between different stages in the adoption process. It is an individual level survey, with one record for each young person fitting the parameters for the collection. Returns are completed online by nominated HSC Trust staff using a secure web-based application. Records are anonymised to protect the confidentiality of the young people whose details are included in the return.
Guidance notes and other documents associated with the completion of the AD1 survey are available to view or download from the DoH website.
Methodology
The adoption process is set out in stages, where one event, recommendation or decision would naturally follow the next. However, with the focus on improving the timing of the somewhat lengthy adoption process, the natural order of the events may not be followed. This may cause, when calculating duration between different stages of the adoption process, a 'negative' duration to be calculated. This mainly relates to the LAC Best Interest Proposal occurring prior to last entry into care.
Historically, within the AD1 calculations, these negative values have been excluded from analysis (eg the value has been treated as 'missing'). However, as the negative value may be a reflection of efficiency and improved service, it may be considered unfair not to include them in overall performance evaluations. The methodology was therefore revised.
As a result, negative values are treated as the value '0' and are included in calculations. This means that, for the example above, where the Best Interest Proposal was agreed prior to the last entry to care, is in the calculations interpreted as if no time passed between the child entered its last period of care and the LAC Best Interest Proposal was in place (time = 0 months).
All time series included in this publication have been revised using this methodology.
Format of historic figures
Any historic figure including ’12 months’ has been changed to the format of ‘1 year’. For example ‘0:12’ is now displayed as ‘1:0’ and ‘2:12’ is displayed as ‘3:0’.
Missing dates and Rounding
different result when the same duration is calculated directly without using intervening dates. These differences may be further compounded through rounding errors.
Data Quality
All information submitted by HSC Trusts was validated at the point of entry, where Trust staff correct or amend data as required, and provide appropriate explanations if information is missing. AD1 returns are checked and quality assured by HSC Trust managers before being submitted to CIB within the DoH. CIB perform further checks, using historical data to monitor annual variations and emerging trends.
A detailed quality report for the AD1 survey statistics is available on the DoH website https://www.health-ni.gov.uk/publications/children-adopted-care-return-and-quality-report .
Main Uses of Data
The main uses of these data are to monitor the delivery of social care services to children, to help assess Trust performance, corporate monitoring, to inform and monitor related policy, and to respond to parliamentary/assembly questions. The bulletin is also used by academics/ researchers, the voluntary sector and those with an interest in children in care.
A National Statistics Publication
National Statistics status means that official statistics meet the highest standards of trustworthiness, quality and public value.
All official statistics should comply with all aspects of the Code of Practice for Official Statistics. They are awarded National Statistics status following an assessment by the Authority’s regulatory arm. The Authority considers whether the statistics meet the highest standards of Code compliance, including the value they add to public decisions and debate.
It is the Department of Health’s responsibility to maintain compliance with the standards expected of National Statistics. If we become concerned about whether these statistics are still meeting the appropriate standards, we will discuss any concerns with the Authority promptly. National Statistics status can be removed at any point when the highest standards are not maintained, and reinstated when standards are restored.
If you have any comments on this publication, please contact Community Information Branch on Email:
cib@health-ni.gov.uk or Tel: 028 90522580
Related Publications
Statistics on all children adopted in Northern Ireland (from care and not from care) can be sourced from the Northern Ireland Guardian Ad Litem Agency annual reports.
http://www.nigala.hscni.net/publications.htm
England
Statistics on ‘Children looked after in England’ (including adoption and care leavers) are produced annually by the Department for Education. Figures for the year ending 31 March 2017 are available at:
https://www.gov.uk/government/statistics/children-looked-after-in-england-including-adoption-2016-to-2017
Wales
Statistics on Children Looked After by Local Authorities are produced annually by the Welsh Assembly Government. Figures for the year ending 31 March 2017 are available through the link below:
https://gov.wales/statistics-and-research/children-looked-after-local-authorities/?lang=en
Scotland
‘Children’s Social Work Statistics Scotland’ is published on an annual basis by the Scottish Government, with the latest published figures relating to year ending 31 July 2017. Figures relating to adoption can be found in the additional tables at the following link:
Appendix B - Additional Tables
Table 11 Number of Children adopted from Care in Northern Ireland (year ending 31 March)
Year Number of children
adopted from care
2000 54
2001 99
2002 104
2003 109
2004 79
2005 88
2006 56
2007 60
2008 64
2009 57
2010 50
2011 55
2012 60
2013 88
2014 89
2015 72
2016 89
2017 120
2018 84
Table 12 Number of Children adopted from Care in Northern Ireland by HSC Trust (year ending 31 March)
HSC Trust 2014 2015 2016 2017 2018
N N N N N
Belfast 18 19 13 23 12
Northern 23 12 31 40 15
South Eastern 25 13 10 17 22
Southern 16 20 19 15 16
Western 7 8 16 25 19
This statistical bulletin
and other statistical bulletins published by Community Information Branch (CIB) are available to download from the internet at:https://www.health-ni.gov.uk/topics/dhssps-statistics-and-research-social-services/social-care-statistics
For further information
on children adopted from care in Northern Ireland please contact:Community Information Branch Department of Health
Annexe 2 Castle Buildings Stormont, Belfast BT4 3SQ
Email: cib@health-ni.gov.uk