DATA REPRESENTATIONS IN A STEM CONTEXT: THE PERFORMANCE OF CATAPULTS
Noleine Fitzallen, Jane Watson, Suzie Wright, and Bruce Duncan University of Tasmania, Hobart, TAS, Australia
STEM activities have the potential to embed statistics education in meaningful contexts in the elementary years of schooling. This paper reports on part of an extended activity where Grade 4 students were involved in learning about catapults, studying their behavior, and later attempting to improve their performance. After initially collecting data from launching ping pong balls with the catapults, students were given complete freedom to generate representations that could be used to analyze their data to report on the distance the balls travelled and the consistency over a number of trials. The results illustrate the breadth of graph-types students can create when given the opportunity to represent the data in ways most meaningful to them.
BACKGROUND
The increasing use of Science, Technology, Engineering, and Mathematics (STEM) contexts in learning experiences in schools is a reflection of a national priority of the Australian government to expand the country’s capacity to build “A Better Australia” (Office of the Chief Scientist, 2012). This national priority is reinforced by the “National STEM School Education Strategy 2016-2026,” which states that “A renewed national focus on STEM in school education is critical to ensuring that all young Australians are equipped with the necessary STEM skills and knowledge that they will need to succeed” (Education Council, 2015, p. 3). Within the area of supporting STEM education opportunities within school systems, the strategy calls for,
Improving the integration of statistical concepts, data analysis and problem solving skills into school programs, consistent with the Australian curriculum and in recognition of the impact of technology and big data on the types of STEM literacy today’s students require. (p. 9)
A similar concern about STEM opportunities exists in other countries as shown, for example, with the US National Research Council document, “STEM integration K-12 Education” (2014).
Although the fundamental importance of mathematics within STEM contexts is acknowledged widely (e.g., Fitzallen, 2015; Shaughnessy, 2013), specific references to data and statistics within STEM activities for the classroom are not as common. Hefty (2015) described an engineering design process for Grade 5 students, constructing a vehicle using rubber band energy, which included data collection and interpretation along with other mathematics. Similarly, in an engineering context, English and Mousoulides (2015) reported on Grade 6 students using data on different types of bridges to choose one to replace a collapsed bridge in Minnesota. Indeed, many interesting classroom activities are suggested involving data that do not, but could, refer to STEM (e.g., Groth, 2015; Hendrickson, 2015).
In response to school curricula, students are taught to create particular graph types to represent data. Dominant in the early years of schooling is the use of column graphs or bar charts (Australian Curriculum, Assessment and Reporting Authority [ACARA], 2016; Franklin et al., 2007; Watson & Fitzallen, 2010). These are selected because of their simplicity and ability to displayeither a frequency or a measure value for a data case. Konold, Higgins, Russell, and Khalil (2015) suggest that the second type of display, the “case-value” plot, is commonly used not only by young students but also by newspapers, where bars are ordered alphabetically by case name (p. 312). Traditionally, the teaching of bar charts and column graphs focuses on the construction of the scale and insertion of labels to describe the data represented. The assumption is made that teaching particular graph types provides structures that organize the data in such a way that students can interpret the data to make informal inferences and answer questions (Watson & Fitzallen, 2010).
communicate the meaning in the data. An example of transnumeration includes constructing stem-and-leaf plots, which require the raw data to be grouped and ordered. Further instances of transnumeration occur when the stem-and-leaf plots are used to construct box plots (e.g., Duncan & Fitzallen, 2013). In this study, where students are beginning their journeys in analyzing data, of interest are the initial, intuitive steps they take in transnumeration when creating representations to display the data they have collected.
In the literature, students’ early creation of representations of data are not considered within STEM contexts but rather more widely as part of modelling activities (e.g., English, 2010; Mulligan, 2015) or in relation to the development of mathematical ideas, such as counting, measuring, and categorizing (Leavy, 2008; Mulligan, 2015; Russell, 1991). Within science education, representations created by students may include data or may display other aspects of the context of an investigation (e.g., Prain & Tytler, 2012). Specific consideration of data representations within wider STEM contexts does not appear to have been reported to this time. Therefore, this research seeks to answer:
In what ways do students represent data to display the variation in data collected within a STEM investigation?
THE STUDY
The aim of the large 4-year project, of which this paper reports a very small part, is to introduce students to statistical problem solving using STEM contexts. The goal is for students to understand concepts and develop skills in statistics, using them to further their understanding of topics related to STEM. Within the context of the overall project, this paper reports on one aspect of a larger activity introducing 10-year-old students to statistical problem solving embedded in a STEM context centered on the launching of ping pong balls with catapults.
The activity introduced the students to the catapults, which they trialed, attempted to “improve,” and trialed again. They then compared the results from the second trial to the original. As part of their analysis of the original trial, students were asked to create representations to show how far their ping pong balls had traveled and how consistent they were. It was of interest to analyze what type of representations they would use in this context as their previous experience with graphing in the project was based on conventional frequency plots and time series graphs. For example, one of the previous activities in the project involving insulation and heat transfer had given students a graphical framework in which to record data collected over time (Fitzallen, Watson, & Wright, 2017). No explicit instructions were given on the types of graphical representations to construct for the catapult activity. The aim was to provide the students with the opportunity to be creative, unconstrained by instructions, to use particular graph types, as according to Russell (1991), “students learn about data collection and analysis when they construct their own categories, create their own representations, and talk about their own interpretations” (p. 164).
METHOD Sample
As part of the larger project, 58 students across two Year 4 classes at an urban independent co-educational catholic school participated in a STEM-based activity to determine the typical distance a ball travelled when launched from a catapult. Of these, consent to use their data in the study was provided for 56 students, consisting of 34 boys and 22 girls, with an average age of 10 years 2 months.
Classroom procedure and data collection
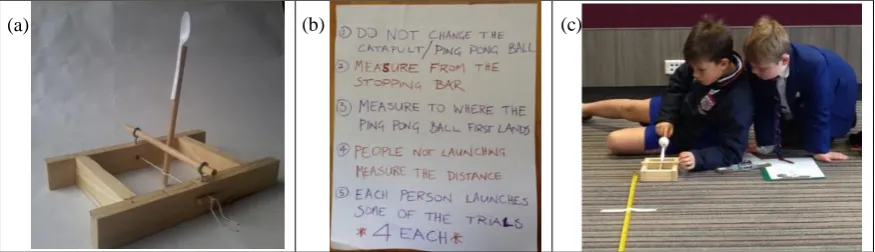
with centimetres and metres.” They also considered fair test conditions, and proposed ways of recording the data. Further class discussion ensued and standardized testing conditions were agreed. These were written on butcher’s paper and displayed for future reference (Figure 1b).
[image:3.595.86.524.223.349.2]Working in groups (Figure 1c), the students trialed their catapults, launching a ping pong ball 12 times, and recording the distance travelled and the name of the person launching the ball for each trial in a table provided on their data collection worksheets. They were then provided with a data representation worksheet with one line that could be used as a horizontal or vertical axis, or part of any frame they chose, with instructions to represent their data in a way most meaningful to them. Using their representations, the students answered three questions in workbooks on the consistency of the data, variation in the data, and reasons for the variation seen. For the purposes of this paper, only the students’ hand drawn graphical representations are analyzed.
Figure 1. A catapult, rules for a fair test, and students collecting data.
Analysis
The data were analyzed independently by two experienced research assistants, using a coding scheme specifically developed by the research team. The data representations were coded categorically according to the type of representation drawn: (a) idiosyncratic representation; (b) table, tally, list, or pictograph; (c) case-value plots showing sequential numbering for distance travelled on the y-axis; (d) case-value plots showing sequential numbering for distance travelled on the x-axis; (e) case-value plots showing ordered distance on the y-axis; and (f) frequency bar charts. The inter-coder reliability for the data representations was 96%. Discrepancies were discussed and agreement reached. The representations were then analyzed to determine the initial steps in transnumeration that were made when creating the representations.
RESULTS
Of the 56 students in the study, nine (16%) either did not complete their representations, and therefore they could not be categorized, or did not draw a representation at all. The remaining 47 students presented their data as summarized in Table 1. The categories in the table increase in the degree of transnumeration, from (a) to (f). Although there is no intention to suggest the progression from (a) to (f) is developmental, the categories assist in distinguishing the extent to which transnumeration of the raw data occurred in the creation of the representations.
Table 1. Year 4 students’ data representations (n=47).
Description Example n %
(a) Idiosyncratic representations. 5 11%
(b) Tables, tallies, lists of data, or pictographs.
7 15%
(c) Case-value plots showing sequential numbering for distance travelled on the y-axis.
19 40%
(d) Case-value plots showing sequential numbering for distance travelled on the x-axis.
7 15%
(e) Case-value plots showing ordered distance on the y-axis.
3 6%
(f) Frequency bar charts. 6 13%
The graphical representations created by the students were diverse. The majority were case-value plots but the extent to which transnumeration occurred varied across the categories. At the idiosyncratic level, the representations analyzed either focused on individual values or were peculiar because they did not appear to display the data collected. Example (a) shows the highest and lowest values at the top of two columns that at first glance, appear to represent the data collected for each of the students. Close scrutiny reveals that the columns are lists of numbers not related to the data or the distances of the throws from the catapult.
data. They are displayed in order of the sequence of launches—in the groups the students took turns in launching the ping pong balls. Transnumeration also occurred when the raw data were transformed into symbols and tally strokes to display the distances travelled. The key developed uses a symbol to represent 10cm and a tally stroke to represent 1cm, therefore, twelve hearts and 4 tally stokes is equivalent to 124cm. The hearts and other symbols used are also specific to an individual member of the group.
The display of data according to the sequence of events is also evident in examples (c) and (d). These examples of case-value plots are similar but have the distance travelled on different axes. The transnumeration of the data in these examples involved ordering the data according to the sequence of data collection in (c), and grouping the data according to the group member in (d). In both (c) and (d) an appropriate numerical scale is used and the values of the cases align with the scale appropriately. Example (e) is also a case-value plot. It differs from (c) and (d) in that the data are displayed in descending order according to the distance the ping pong ball travelled. Although it may be considered a more sophisticated approach than ordering the data according to the sequence of data collection, transnumeration has only been applied to one aspect of the data. The y-axis in (e) is not to scale and the variation between the cases is not a realistic representation of the variation in the data. The most sophisticated graphical representations created were frequency bar charts displayed in example (f). In these graphical representations the data were both ordered according to the scale on the x-axis and grouped according to the distance travelled to show frequency on the y-axis.
DISCUSSION AND CONCLUSION
The freedom to create the graphical representation that was most meaningful for the students revealed a broad range of representations, some of which were conducive to answering the question posed for the students, “What is the typical distance a ping pong ball travels when launched from a catapult?” For the most part, the representations created would require further calculation, reorganization, or transformation to be able to be used directly by the students to answer the question posed at the onset of the investigation. Such actions would result in further transnumeration of the data.
The majority of the graphical representations created were case-value plots (Konold et al., 2015). As noted by Chick (2003), this type of representation does not obscure the data. It maintains the data values and the information about the data can be retrieved from the representation. For young students, these representations maintain meaningful links between the data and the situation within which the data were collected. They provide starting points to discuss with students the way in which graphical representations can convey further information and help determine features such as variation, clumps, gaps, and middles that will tell more about the story in the data (Konold et al., 2015; Chick et al., 2005).
Teachers need to be aware of the two types of bar graphs that can be created. Curriculum documents, such as ACARA (2016), do not distinguish the two. They have, however, different purposes in the transnumeration process. Over the primary years, change occurs, from early dealing with categorical data, where counts are represented in frequency bar charts, to encountering measurement data (such as distance), where case values can also be represented in bar charts. The message from this study is that there will be times when explicit instruction will be needed to help students transition from case-value plots to frequency plots for measurement data.
ACKNOWLEDGEMENT
This research is supported by a Discovery Grant (DP120100158) from the Australian Research Council in collaboration with Prof Lyn English, Queensland University of Technology.
REFERENCES
Australian Curriculum, Assessment and Reporting Authority. (2016). The Australian Curriculum: Mathematics (Version 8.3). www.australiancurriculum.edu.au/f-10-curriculum/mathematics/ Chick, H. (2003). Transnumeration and the art of data representation. In L. Bragg, C. Campbell, G.
opportunity (Proceedings of the 26th annual conference of the Mathematics Education Research Group of Australasia, Geelong, pp. 207-214). Sydney, NSW: MERGA.
Chick, H. L., Pfannkuch, M., & Watson, J. M. (2005). Transformative thinking: Finding and telling stories within data. Curriculum Matters, 1, 87-108. Wellington: NZCER.
Duncan, B., & Fitzallen, N. (2013). Developing box plots while navigating the maze of data representations. Australian Mathematics Teacher, 69(4), 8-14.
Education Council. (2015). National STEM school education strategy: A comprehensive plan for science, technology, engineering and mathematics education in Australia. Carlton South, VIC: Author.
English, L. D. (2010). Young children’s early modelling with data. Mathematics Education Research Journal, 22(2), 24-47.
English, L. D., & Mousoulides, N. G. (2015). Bridging STEM in a real-world problem. Mathematics Teaching in the Middle School, 20(9), 532-539.
Fitzallen, N. (2015). STEM education: What does mathematics have to offer? In M. Marshman, V. Geiger, & A. Bennison (Eds.), Mathematics education in the margins (Proceedings of the 38th annual conference of the Mathematics Education Research Group of Australasia, pp. 237-244). Sunshine Coast: MERGA.
Fitzallen, N., Watson, J., & Wright, S. (2017). The heat is on! Using a stylised graph to engender understanding. Australian Primary Mathematics Classroom, 22(2), 3-7.
Franklin, C., Kader, G., Mewborn, D., Moreno, J., Peck, R., Perry, M., & Scheaffer, R. (2007). Guidelines for assessment and instruction in statistics education (GAISE) report: A pre-K-12 curriculum framework. Alexandria, VA: American Statistical Association.
Groth, R. E. (2015). Royalty, racing, and rolling pigs. Teaching Children Mathematics, 22(4), 219-227.
Hefty, L. J. (2015). STEM gives meaning to mathematics. Teaching Children Mathematics, 21(7), 423-429.
Hendrickson, K. A. (2015). Fracking: Drilling into math and social justice. Mathematics Teaching in the Middle School, 20(6), 368-371.
Konold, C., Higgins, T., Russell S. J., & Khalil, K. (2015). Data seen through different lenses. Educational Studies in Mathematics,88(3), 305–332.
Leavy, A. (2008). Examination of the role of statistical investigation in supporting the development of young children’s statistical reasoning. In O. N. Saracho & B. Spodek (Eds.), Contemporary perspectives on mathematics early childhood (pp. 215-232). Charlotte, NC: Information Age Publishing.
National Academy of Engineering and National Research Council. (2014). STEM integration in K-12 education: Status, prospects, and an agenda for action. Washington, DC: The National Academies Press.
Mulligan, J. (2015). Moving beyond basic numeracy: Data modelling in the early years of schooling. ZDM Mathematics Education, 47, 653-663.
Office of the Chief Scientist. (2012). Mathematics, engineering & science in the national interest. Canberra: Australian Government.
Pfannkuch, M., & Wild, C. (2004). Towards an understanding of statistical thinking. In D. Ben-Zvi, & J. Garfield, (Eds.), The challenge of developing statistical literacy, reasoning, and thinking (pp. 17-46). Dordrecht, Netherlands: Kluwer Academic Publishers.
Prain, V., & Tytler, R. (2012). Learning through constructing representations in science: A framework of representational construction affordances. International Journal of Science Education, 34(17), 2751-2773.
Russell, S. J. (1991). Counting noses and scary things: Children construct their ideas about data. In D. Vere-Jones (Ed.), Proceedings of the Third International Conference on Teaching Statistics, Dunedin, New Zealand (pp. 158-164). Voorburg, The Netherlands: International Statistical Institute.
Shaughnessy, M. (2013). Mathematics in a STEM context. Mathematics Teaching in the Middle School, 18(6), 324.