Rochester Institute of Technology
RIT Scholar Works
Theses
Thesis/Dissertation Collections
1997
The Justification of a packaging line based on
capacity issues
Chin Ho
Follow this and additional works at:
http://scholarworks.rit.edu/theses
This Thesis is brought to you for free and open access by the Thesis/Dissertation Collections at RIT Scholar Works. It has been accepted for inclusion
in Theses by an authorized administrator of RIT Scholar Works. For more information, please contact
.
Recommended Citation
THE
JUSTIFICATION
OF A PACKAGING LINE
BASED
ON
CAPACITY
ISSUES
By
Chin
Siong
Ho
A
Thesis
Submitted
to
the
Department
of
Packaging
Science
College
of
Applied Science
and
Technology
in
partial
fulfillment
of
the
requirements
for
the
degree
of
MASTER
OF
SCIENCE
Rochester Institute
of
Technology
Department of Packaging Science
College of Applied Science and Technology
Rochester Institute of Technology
Rochester, New York
Certificate of Approval
M.S. DEGREE THESIS
The M.S. Degree thesis of Chin Siong Ho
has been examined and approved
by the thesis committee as satisfactory
for the thesis requirements for the
Master of Science Degree
[Names Illegible]
JULY 1997
Thesis Release Permission
ROCHESTER INSISTUTE OF TECHNOLOGY
COLLEGE OF APPLIED SCIENCE AND TECHNOLOGY
Title of Thesis:
THE JUSTIFICATION OF A PACKAGING LINE BASED ON
CAPACITY ISSUES
L
Chin Siong Ho, hereby deny permission to the Wallance Memorial Library of the
Rochester Institute of Technology to reproduce my thesis,
in
whole or
in
part.
JULY 1997
ACKNOWLEDGEMENTS
I
wish
to
acknowledge several
people,
without whom
this
study
and
thesis
would
have
not
been
suceessful.
I
am
especially
grateful
to
John
Williams,
who
has
as much
to
do
with
this
project
as
I
have.
His
experience,
knowledge
and patience
(who
would
have
known)
has
allowed
this
study
to
make some
sense and
fun.
To
all
the
good
times
ahead!
I
am also
especially
thankful to
Fernando
Garcia,
who
has
left
us
for better
DEDICATION
This
thesis
is dedicated
to the
most
important
person
in
my
life;
my
wife,
Lilian.
Besides
being
the
'editor'of
the
text,
her
encouragement
and patience was
the
most
The
Justification
ofa
Packaging
Line Based
on
Capacity
Issues
By
Chin
Siong
Ho
1997
ABSTRACT
Due
to the
phenomenal
increase in
the
long
range
marketing
forecast for
the
products manufactured at
the
Garden
City
site ofDuPont Merck
Pharmaceuticals,
a
capacity
problemwas
identified.
This
paperevaluates
the
impact
of
the
increased
forecast
and
demands
onthe
packaging operations,
and also
the
justification
of a
packaging
line
to
support
the
expected
capacity
overload.
It
addresses
different
alternatives available
to
the
company
to
support
the
demand
and evaluate
these
options
based
on cash
flow
analysis.
In addition,
the
study
allows
the
general reader outside
the
company
to
understand
the
methodology
involved in
the
justification
of a
packaging
line
and
the tools to
evaluate such
a project.
Based
on
the
excellent
financial
results of
meeting
the
product
demand
TABLE OF
CONTENTS
Introduction
1
Chapter
1
Assumptions
3
Chapter 2
Current Situations
5
Current
Capacity
Calculations
5
Comparison
of
Current Demand
and
Capacity
6
Chapter 3
Immediate Improvement
Opportunities
8
Chapter
4
Other Alternatives
12
Contract
Packager
12
Direct Labor
Cost Calculations
14
Contract
Packaging
Cost Calculations
15
Incremental
Operating
Cost
17
Labor
Cost
Per
Unit Bottle
Calculations
20
Chapter 5
Packaging
Line
Investments
22
Calculations
of
Packaging
Line
Speed
and
Capacity
23
Proposal
A
-Alternative
24
Proposal
B
Alternative
25
Package Design
and
Configuration
28
Process
Description
of
Packaging
Line
29
Functional Description Document
33
Assessment
of
Packaging
Equipment
and
Services
33
Chapter
6
Facility
Expansion
38
Current Situation
38
Facility
Expansion Recommendation
39
Cost
of
Facility
Expansion
40
Chapter 7
Total
Cost
of
Packaging
Line
Investment
42
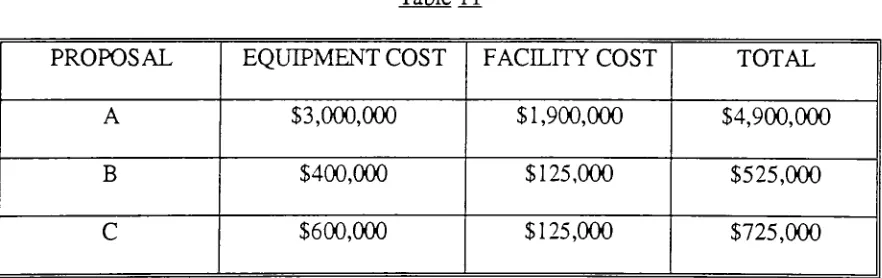
Cost
Breakdown
of
Each
Proposal
44
Timeline
45
Chapter
8
Justification
48
Appendixes
Appendix A
Line 6 Alternative
-Current
Capacity
Chart
56
Appendix B
CozaarBOM
58
Appendix
C
HyzaarBOM
60
Appendix D
Incremental
Operating
Cost Calculation
62
Appendix E
Line 6 Alternative
-Proposal A
Capacity
Chart
64
Appendix F
Line 6 Alternative
-Proposal
B
Capacity
Chart
66
Appendix
G
Line 6 Alternative
-Proposal
C
Capacity
Chart
68
Appendix H
Function
Description
of
Packaging
Line 6
70
Appendix I
Equipment
Cost
78
Appendix J
Line Layout
80
Appendix
K
Process
Flow
Chart
-Current
82
Appendix
L
Process Flow
Chart
-Proposal A
84
Appendix M
Process
Flow
Chart
-Proposal B
86
Appendix
N
Process
Flow
Chart
-Proposal
C
88
INTRODUCTION
The DuPont Merck Pharmaceutical
Company,
with
headquarters
in
Wilmington,
Delaware,
is
a
global manufacturer of oral solids and parental ethical
drug
products.
Manufacturing
facilities
for
oral
dosage
and parental
drugs
are
located in Garden
City,
New
York
and
Manati,
Puerto Rico. The company
also
has
a
Radiopharmaceutical
division.
A
new
drug
used
for
the treatment
of
Acquired Immune
Deficiency
Syndrome
(AIDs)
is currently
in
the
pipeline of
the
company.
Filing
of
the
New
Drug
Application
(NDA)
with
the
Food &
Drug
Administration
(FDA)
is
expected
by January
1998
and
approval
by
the
agency is
anticipated
in
the
second quarter of
1998.
Marketing
and
Sales
have
provided
a phenomenal
forecast
for
the
product
and expectations of
the
company
are
extremely
high.
Due
to
maximized
capacity in
the
Manati,
P.R.
site,
management
has
made
the
decision
to
manufacture and package
the
product
in
Garden
City,
New
York.
The New York
site
is currently supporting
all production
of
ENDO Laboratories
L.L.C.,
the
generic
subsidiary
of
DuPont
Merck
Pharmaceuticals,
and
two
major
Merck
products
Hyzaar
and
Cozaar
~drugs
for
the
treatment
of
hypertension
and
high-blood
pressure.
The
site
currently
operates
withtwo
shifts
for
the
packaging
operation.
With
the
current operational mode of
five packaging lines
(two
trade tablet/capsule
bottling
line,
one sample
tablet
line,
one
liquid
bottling
line
and
a
Hospital Unit
Dose
(HUD)
or
blister
packaging
line),
the
site
is
operating
at
close
to
75% capacity for
the
packaging
operation.
premium on
the
site.
The
local
county
zoning law
will
not
permit
further
site
expansion,
hence any
renovation or
facility
modifications
to
increase
manufacturing/packaging
capacity
will
have
to
be
within
the
current area.
With
the
anticipated
launch
of
the
AIDs
drug
in
1998
combined with
the
huge
demand
and
forecast
for
Hyzaar
and
Cozaar,
the
Garden
City
site
faces
a
packaging
capacity
and expansion
issue
which
requires
immediate
attention.
This
paper will
study
the
impact
on
the
site with
the
expected
increase in
manufacturing
and
packaging
production.
It
will
address
the
issues
of anticipated
maximization of
the
packaging
capacity,
investigate
alternatives
to
provide
for both
immediate
and
long
range solution
to
the
problem,
and
discuss
options related
to
CHAPTER
1
-ASSUMPTIONS
Due
to the
nature of
the study,
assumptions
have
to
be
made
along
with
results
gathered
from
other
studies
to
support
this
paper.
The
following
is
a
hst
of assumptions:
1)
There
are
400 operating
minutes per shift.
2)
Lines 2
and
3 have
a net rate of
50 bottles
per minute
(BPM)
and require a
total
of
seven operators and mechanics
for
each
line
to
operate and maintain
the
machinery.
3)
Line 2
is
dedicated
to
one
bottle
size.
However,
Line
2
will still require
line cleaning
and changeovers
for
different
product
strengths.
In
addition,
the
reliability
of
the
equipment
on
the
line,
due
to
an average
age of sixteen
years,
is
questionable.
Based
on
actual
studies completed over a
four- week
period, the
line is only
operating
at
60%
efficiency
on
the
first
and second shifts.
4)
Line 3 is
not
dedicated
to
a
bottle
size or product.
Changeovers
are much more
frequent,
resulting in
more
downtime
and
lower
efficiency.
Based
on actual studies
completed over a
four
weekperiod,
the
line is only
operating
at
40%
efficiency
on
the
first
and second shifts.
5)
Since
the
site
does
not
currently
operate with
a
third
shift, the
efficiency
of a
third
shift
on
the
lines
has
been
estimated
to
be 66%
of
the
actual
efficiency
on
the
first
and second
shifts
due
to
lack
of support
from
other
departments
(e.g.,
warehousing,
QA,
labeling
6)
It is
assumed
that there
are
200
shifts/year
with
a
one
shift/5
days
operating
environment,
or
a
maximum of
600
shifts/year
in
a
three
shifts/5
days
operating
environment.
This include
holidays,
weekends,
plant
shutdowns,
days
for training,
etc.
7)
The
site
will
operate
in
a
three
shifts/5
days
environment.
All
calculations of
capacity
will
carry
this
assumption.
8)
A
yearly
4%
inflation
rate
is
used
for
all
calculations.
9)
Packaging
Labor
rate
is
taken
as
$18/hr
with
benefits,
with
8 hr
./shift.10)
All
alternatives
investigated
assurries
that
manufacturing
can meet
the
demands
required
to the
year
2005.
Manufacturing
(granulation,
compression,
coating
CHAPTER
2
-CURRENT SITUATIONS
Cozaar
and
Hyzaar
trade
packages are
currently
packaged on
packaging
Line
2
with
Line 3 serving
as a
back-up.
The
two
products
cunently
have
a
total
of
four
different
strengths,
packaged
in
HDPE bottles
of
30,
90
and
100
counts.
The
two
products were
launched
in
1995
with
an original
forecast
that
has
increased
dramatically,
mainly
due
to
the
availability
of
the
Active
Drug
Substance
(ADS),
from
the
most recent
forecast
provided
by
the
customer.
In
addition
to the
unexpected
huge increase
in
demand
for
Cozaar
and
Hyzaar
by
the customers,
marketing has
also
recently
released
its
expected
sales
forecast for
the
AIDs drug.
Together,
the
three
drugs
have
a
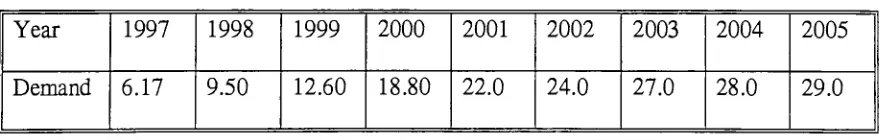
total
demand
forecast
[image:14.556.59.502.407.477.2](in
millions of
bottles)
shown
in
Table 1.
Table 1
Year
1997
1998
1999
2000
2001
2002
2003
2004
2005
Demand
6.17
9.50
12.60
18.80
22.0
24.0
27.0
28.0
29.0
CURRENT CAPACITY
CALCULATIONS
Based
on
the
assumptions made
in
Chapter
1,
the
following
is
the
capacity
calculation
for
each current
packaging line:
CURRENT LINE
2
CAPACITY
1st
and
2nd
shifts:
50 BPM
x
400
min./shift
x
2
shifts
x60%
=24,000 bottles
CURRENT LINE 3
CAPACITY:
1st
and
2nd
shifts:
50 BPM
x
400
min
./shiftx
2
shifts
x
40%
=16,000
bottles
3rd
shift:
50 BPM
x
400
min
./shiftx
1
shift y.
.30% =6,000 bottles
From
the
above
calculation,
it is determined
that
Lines 2
and
3
combined will
have
a production
capacity
of
54,000 bottles
per
day
in
a
three-shift
environment.
Hence,
with
the
assumption
that there
are
200
actual
working
days
in
the
Garden
City
site, the
total
maximum
capacity
for
Lines
2
and
3 is 10.8
million
bottles/year.
COMPARISON OF CURRENT
DEMAND
AND CAPACITY
Since
the
total
production
capacity
of
Lines 2
and
3
is
54,000 bottles
per
day,
the
number of
days
that
will
be
required
by
the
packaging
operations
to
meet
the
demands,
as
listed
on
Table
1,
can
be
calculated
by dividing
demands
of
the
respective year over
the
total
daily
capacity
of
the
lines. With
this
information,
the
number of shifts
that
will
be
required
to
meet
the
total
demands
can also
be
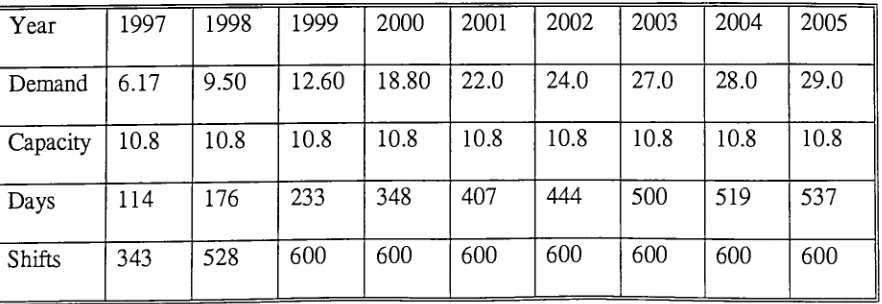
calculated.
Table 2
shows
the
above
[image:15.556.60.501.513.665.2]calculation
and summarizes
the
results
for
600
shifts:
Table 2
Year
1997
1998
1999
2000
2001
2002
2003
2004
2005
Demand
6.17
9.50
12.60
18.80
22.0
24.0
27.0
28.0
29.0
Capacity
10.8
10.8
10.8
10.8
10.8
10.8
10.8
10.8
10.8
Days
114
176
233
348
407
444
500
519
537
Given
the
above
details
and
results,
it
has been
shown
that the
packaging capacity
of
Garden
City
will
be
maximized
in
1999. The
following
sections
willaddress
possibleCHAPTER
3
-IMMEDIATE IMPROVEMENT
OPPORTUNITIES
In
any
operations management
text,
the
four
basic
principles of
manufacturing
are
the
four
M's
-Methods, Materials,
Machinery
and
Manpower.
A
successful
justification
of a
manufacturing
related
project
has
to
include
these
principles.
The idea
of
'immediate
improvement
opportunities'relates
to
improvements
in
current processes and also
the
four
M's.
In
a
packaging
or
manufacturing
operation, the
first
step
to
increasing
production
capacity is
to
study
the
current methods of production and
implement improvements
to
current operations.
These
improvements
could
be
as simple as
providing
proper
training
to
packaging
operators
and/or mechanics
to
increase
the
speed of
individual
equipment,
or
simply
"tweaking"
the
machines
to
optimum operation
levels. Other
effective
fixes
may
be:
Improving
packaging
components
that
are supplied
to the
equipment.
For
example,
in
the
cartoning
process,
the
dimensional
tolerances
of
the
cartons are
extremely important
to the
efficiency
of
the
cartoner.
In
addition
to
the
dimensions,
the types
of paperboard used or
the
storage
conditions of
the
cartons
may
also affect
the
behavior
of
the
cartoner.
Warping
of cartons
due
to
improper
storage conditions
is
a common
factor resulting in lower
equipment
efficiency.
All
packaging
components
bottles,
caps,
labels,
cartons,
inserts/outserts,
shippers,
and
films
-have
an effect on
the
speed of
the
Improving
existing
methods of
production suchas
the
packaging
operations,
the
morale of
the
operators,
the
delivery
of componentsto
the
packaging
line,
the ergonomics
of
the
equipment and
their
effect on
the
operators,
downtime
of
the
equipment
due
to the
priormanufacturing
step
(i.e.,
is
the
productready
to
be
packaged?),
properscheduling
and
planning,
and
the
maintenance program ofthe
packaging
equipment
canhelp
in
improving
efficiency
ofthe
production/packaging
site.The
use
of a
third
shift
if it has
notbeen
considered.
Going
to
a
three
shift operation
in any manufacturing
operation
is
always
anideal
solution
to
ashort
term
problem.However,
the
long
term
effects
ofthree
shiftoperations
mustbe
studiedcarefully if it is
not a commonpractice
by
the
company.
As
time
progresses
in
a
three-shift
environment,
productionefficiency
willtend to
be
affected as problems
with equipment
reliability
(breakdown)
become
more prevalent.
In
addition,
if
the third
shiftis
notstaffedappropriately
to
meetthe
packaging
and/ormanufacturing
operations, then
downtime increases.
For
example,
if
there
areless
warehousestaffduring
the
third
shift
andcomponents
unexpectedly
run outbefore
the
end of
the shift, then the
packaging
line efficiency
willbe
affecteddue
to
lack
of components.
Improving
and/orchanging existing line
equipment.
This
option
willlines
to
increase capacity
and
efficiency.
Normally,
improvements
are
made
to the
'bottleneck'equipment on
the
line (the
limiting
or slowest
equipment
of
the
line), thereby
increasing
the
net output of
the
line.
In
the
current
case,
all of
the
above
immediate improvement
opportunities
have
been
investigated,
and
some
have been implemented
already.
Packaging
components
have
improved
with
the
use of
better
alternate
suppliers,
and
in
some cases
by
working
withthe
vendors on
the
problems
to
improve
the
components.
In
recent
months,
re-training
on
most of
the
equipment
in
the
packaging
area was provided
to
all mechanics.
Beginning
in
August
1997,
Line 3
will undergo
a major
refurbishing
project
in
the
front
end of
the
packaging line. This
project
involves
the
installation
of a new
bottle
cleaner/unscrambler,
a refurbished
filler,
new conveyors and
controls
for
the
line.
The
expected outcome of
this
installation
is increased efficiency
of
the
line
by
a net output of
30
BPM
to
50
BPM. The
expected completion
date
of
this
project
is October
1997,
hence
providing for
the
required
capacity
as
forecasted
for
1998. Although
short-term
improvements
were
investigated
for Line
2,
the
feasibility
for
improving
the
line
was not
deemed
to
be
appropriate
for
several reasons:
Line 2
is
a
dedicated
line
used
in
the
packaging
of all
Cozaar
and
Hyzaar
(a
major
factor in
the
increase in
demand forecast). There
is
essentially
no
opportunity
to
bring
the
line
down
for
any installation
The
average age
of
the
equipment
on
this
line is
approximately
sixteen
years.
Except for
the
bundler
which was
installed in
1993,
all of
the
equipment
will need
to
be
replaced.
For
this
reason
the
reliability
of
Line
2 is
questionable
and
the
need
for
a new
line
at
the
site should
be
properly
investigated.
The
'rebuilding'of
Line 2
is
estimated
to
cost
approximately
$1.8
million.
However,
this
investment
will
not provide
for
the
capacity
that
is
required
to
meet
the
expected
demands due
to
speed
limitation
that
the
line
will
face
as a result of
limited floor
space
for
equipment
in
the
current area.
A
previous
investigation
by
the
Packaging
Engineering
group
on
the
improvements
of
Line
2
showed an
increase in
net output
of
the
line from 50 BPM
to
80
BPM. The increase in line
output
by
30
BPM is
still
insufficient
to
meet
the
demands
forecasted.
Having
previously
studied
the
opportunities
for
improvements
to
increase
the
current
capacity
of
the
lines thoroughly,
this
study
will
address
the
remaining
options
of
CHAPTER
4
-OTHER
ALTERNATIVES
CONTRACT PACKAGER
Contract
packagers provide
one of
the
most unique services
to
the
packaging
industry. Of
the
approximately 330
contract
packaging
companies
in
the
United
States,
less
than
10%
are
pharmaceutical contract
packagers.1
The
general concept of a contract
packager
is
to
provide
the
additional
capacity
a manufacturer would otherwise
be
required
to
invest,
including
labor,
material,
training
and
documentation. Although
pharmaceutical contract packagers and regular contract packagers provide
the
same
type
of service
to the
packaging
industry,
pharmaceutical contract packagers are considered
by
the
FDA
as pharmaceutical
packaging
companies.
Therefore,
the
same regulations which
apply
to
a pharmaceutical
company
will
also
apply
to
a
contract
packager,
including
rules
governed
by
the
Current Good
Manufacturing
Practices
(cGMP).
A
pharmaceutical
company may
approach
the
use of
a contract packager
for
some
of
the
following
purposes:
Research
&
Development
(R&D)
packaging
and
Clinical
Packaging
for
Clinical
Studies
during
the
development
of a new
drug.
Rework
or
repackaging
of a previous
batch due
to
quality
or
manufacturing
reasons.
For
example,
if
the
labeling
of a product
that
was
already
packaged
by
the
company
has
to
be
changed
due
to
regulatory
reasons,
most companies
willsend
the
whole
batch
to
a
contract
packagerto
be
reworked.The
operation
will
include
1
removing
the
product
from
the
package
and
repackaging
the
productinto
a new
package
with
the
new
required
labeling
information.
Seasonal
products such
as cold and cough season products or
allergy
products
which are
in high
demand
during
certain periods
in
the
year.
Hence,
a
company
that
faces
changes
in demands
due
to the
season
may decide
to
use contract packagers
instead
of
building
additional
capacity
to
meet
these
cyclically-inflated
demands.
Development packaging
or
testing
of new
packaging
materials
for
the
products
to
be
placed
in
stability
studies
to
determine
the
effects of
the
materials on
the
drug.
Providing
the
additional
capacity
to
meet
any
increase
in demand.
Similar
to
the
same problems
faced
by
the
Garden
City
site,
most
pharmaceutical
companies
have
begun
to
use contract
packagers
to
avoid
initial investment
of
in-house labor
and equipment
to
meet
the
increasing
demands
for
their
products.
Normally,
these
are
the
smaller
pharmaceutical,
generic,
or nutritional companies
that
may
not
have
the
initial
capital
expenditure
to
permit
huge
equipment and/or
facility
investments. Larger
pharmaceutical
companies
may
also require
the
use of contract packager
for
the
same reasons.
Although
contract
packagers are
usually
recommended
for
temporary
increases in
demand,
this
may
no
longer
be
true
due
to the
competitive nature of
the
DIRECT LABOR COST
CALCULATIONS
Continuing
with
the
capacity
calculations
of
the
Garden
City
site,
the
cost of
in-house
labor
(direct labor
relating
only
to
packaging)
versus
the
cost of contract
packaging
must
be
considered.
Using
Table
2
as
the
guide,
the
cost of
direct packaging
labor
in-house
to
meet
the
demands
can
be
calculated
by
multiplying
the
cost of
labor
per shift
by
the total
number of
shifts
to
meet
that
particular
demand for
the
year.
For
example,
using
the
current
Line
2
and
3 capacity
calculation
for
1997:
Cost
of
Labor
per
shift
=$18/hr
x
8
hr./day
x
14
operators
=
$2016/shift
Since 1997
would require
343
shifts
to
meet
the
demand
of
6.17
million
bottles,
the
cost
of
labor
to
meet
demand is
then
calculated
to
be approximately
$691,000.
However labor
costs will
have
to
be
adjusted
for yearly inflation
rate
that
we
assume
to
be
4%
for
the
following
years.
Also,
the
maximum number of shifts per year
is
assumed
to
be
600
shifts,
hence
no extra
direct
labor
can
be
incurred
beyond
the
600thshift.
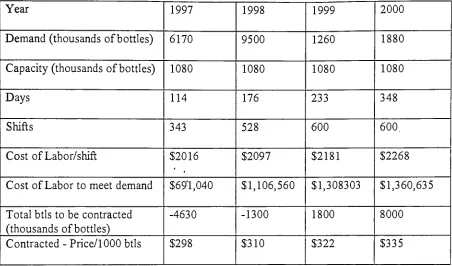
Table
3
reflects
the
calculations of
direct
labor in
the
current
capacity
situation
up
to
year
2000
Table 3
Year
1997
1998
1999
2000
Demand
(thousands
of
bottles)
6170
9500
1260
1880
Capacity
(thousands
of
bottles)
1080
1080
1080
1080
Days
114
176
233
348
Shifts
343
528
600
600.
Cost
of
Labor/shift
$2016
$2097
$2181
$2268
Cost
of
Labor
to
meet
demand
$691,040
$1,106,560
$1,308303
$1,360,635
Total
btls
to
be
contracted
(thousands
of
bottles)
-4630 -1300
1800
8000
Contracted
-Price/1000
btls
$298
$310
$322
$335
CONTRACT
PACKAGING COST CALCULATIONS
Contract
packagersthat
have
complied withDuPont Merck's
Quality
Assurance
Auditing
Program
and
have
been
approved
by
Quality
Assurance include
PACO
Contract
Services in New
Jersey
andPackaging
Coordinators Incorporated
(PCI)
in
Pennsylvania.
Quotes
were requestedfrom both
companies
to
providecontract
packaging
services
for
bottles
of
100
count,
75
cc
HDPE
bottle
with33
mm child-resistant closure.
The
finished
product shall resemble
the
currentCozaar
and
Hyzaar
finished
products packaged at
DuPont Merck (Refer
to
Appendix
B
andC
for
the
Bills
ofMaterialfor
Cozaar
and
Hyzaar
trade
packaging).The
quotefor
PCI
was morefavorable
than
PACO's
at
$298
per1000
bottles.
described
in
the
BOM. The
cost
does
not
include
all
packaging
components as
they
willbe
supplied
by
DuPont
Merck.
Hence,
the cost
provided
by
PCI
is
their
cost of
labor
to
produce
1000 bottles.
Referring
to
Table
3,
the
total
number
of
bottles
to
be
contractedis
gathered
by
the
subtraction
of
the total
demand
against
the total
current
capacity
of
Lines
2
and
3
which
is 10.8
million
bottles.
Hence,
in
1997,
a negative value
is
obtained since
the
capacity is
capable of
exceeding
the
demand,
whereas
in
1999,
contract
packaging
of
1.8
million
bottles
will
be
required.
Note
that
the
increase in
the
price of contract services
is
adjusted
by
a
yearly 4% inflation
rate.
Given
the
above
description,
the
yearly
total
cost
for
contract
packaging
can
be
calculated given
the
current
capacity
situation of
Lines
2
and
3
as shown
in
Table
4 (Refer
to
Appendix A
for
complete chart of calculations
through
year
2005):
Table 4
Year
1997
1998
1999
2000
Demand
(thousands
of
bottles)
6170
9500
1260
1880
Capacity
(thousands
of
bottles)
1080
1080
1080
1080
Days
114
176
233
348
Shifts
343
528
600
600
Cost
of
Labor/shift
$2016
$2097
$2181
$2268
Cost
of
Labor
to
meet
demand
$691,040
$1,106,560
$1,308303
$1,360,635
Total
btls
to
be
contracted(thousands
of
bottles)
-4630 -1300
1800
8000
Contracted
Price/1000
btls
$298
$310
$322
$335
From
the
results shown
above,
the
use of
contract
packaging
to
meet
the
demands
for
that
respective
year will
incur
a
yearly
cost
to the
Garden
City
site
from
1999
onwards.
With
the
increase
in
demand,
productivity
in
the
manufacturing
facility
must
be
raised
to
meet
the
demand,
or
the
operating
costs of
the
company
will
increase.
INCREMENTAL OPERATING
COST
Operating
cost of a
manufacturing
facility
includes
the
amount of
indirect
labor
required
to
meet
the
demands
(i.e.,
fixed
head-count),
and
the
operating
expense of
the
site.
Operating
expenses are expenses
that
a
company incurs
in
order
to
do business
and
they
include
such
things
as
office
supplies,
safety
glasses,
protective gear
for
the
operators,
maintenance of
equipment,
etc.
Another
operating
cost
that
has
to
be
investigated for
this
study is
the
utility
cost
that
is
required
to
provide
for
the
extra
third
shift
that the
site will require
since
the
calculations
for
the
capacity
studies are
based
on a
three-shift
working
environment.
The
operating
cost of
both
contract
packaging
and
in-house packaging
will
increase
as a result of an
increase in
product
demand.
For
example,
as
demand increases
every
year,
the
site will
have
to
hire
more
direct
labor
to
support
the
increased
activities.
More purchasing
personnelmay be
required
to
purchase
the
related
increase in
manufacturing
and
packaging
components,
or
to
work
on
the
contracts with
the
contract
packagers.
More
planners or schedulers
may
also
be
required as a result of
the
increase
in
activities,
and more
quality
assurance
personnelwill
be
needed
to
complete
the
auditing
of
costs and
expenses
to the
company
have
to
be
calculated
because
they
will
have
an
impact
on
the
decision between
the
cost
of
contract
packager and
packaging in-house.
Several
additional assumptions
were made
to
calculate
Incremental
Operating
Costs
(IOC).
They
are:
The
average
fixed
labor
cost
is
$60,000
with
benefits
included.
The operating
expenses
include
expenses
incurred
by
Packaging,
Warehousing
and
Building
Services. The budget
for
1998
has
been
decided
and
is
assumed
to
have
no
impact
on
the
total
operating
cost.
Current
utility
cost on
the
site
is
based
on
twenty
hours
of usage.
Inclusion
of a
third
shift will
only
result
in
a
$20,000
per year
increase
to
utilities.2
An inflation
rate of
4%
was used
to
calculate
the
anticipated
increase in
utilities.
With
the
above
assumptions,
all related
increases in
the
Incremental
Operating
Cost
for
the
current
capacity
situation are shown
in
Appendix D. Appendix D
also
represents all
incremental
costs
for
other proposals
.Referring
to
the
chart,
it
can
be
seen
that two
fixed headcount
will
be
required
to
be
added at
the
site
in
1998
and another
two
will
be
required
every
two
years.
The increase in
headcount is only
for
activities
related
to
packaging
(i.e.,
additionalteam
leader
for
packaging,
additional
packaging
operators,
quality
personnelin
packaging,
warehousing
personnel
to
support
packaging,
etc.).
Other
departmental
needs on
the
site
for headcount increases
are not
considered
in
this
study.
In
the
current
capacity
situation,
the
increase in
operating
expense
becomes
significant
starting from
the
year1999 because
the
packaging capacity
of
the
site
allows
it
to
support
the
additional
demand
for
a
portion
of
that
year
before
contract
packaging
is
required.
In
the
following
years, the
increase
in
operating
expense
is
insignificant
because
the
site
capacity is
at
its
maximum,
hence,
there
is
no need
for
additionaloperating
cost
to
meet
those
demand
as
they
will
be
absorbed
by
the
contract packager and
be
included in
the
Contract
price per
1000 bottles.
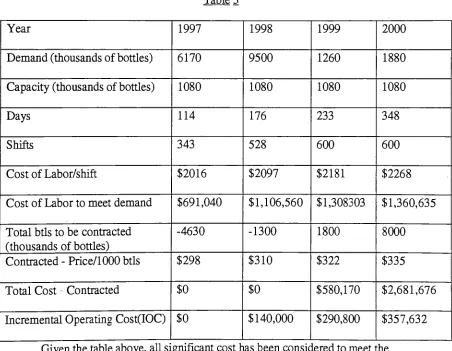
From
the
calculations
shown
in Appendix
D,
the
incremental operating
cost
is
added
to the table
as shown
below
in
Table 5 (Refer
to
Appendix A
for
complete chart of
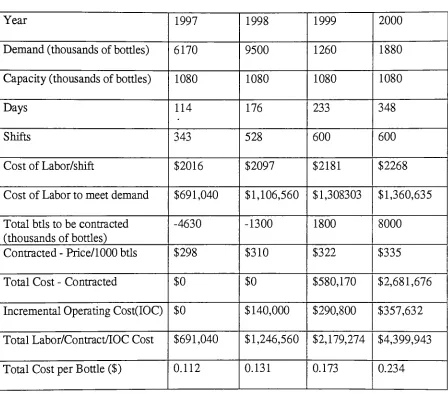
[image:28.556.53.505.281.632.2]calculations through
year
2005):
Table 5
Year
1997
1998
1999
2000
Demand (thousands
of
bottles)
6170
9500
1260
1880
Capacity
(thousands
of
bottles)
1080
1080
1080
1080
Days
114
176
233
348
Shifts
343
528
600
600
Cost
of
Labor/shift
$2016
$2097
$2181
$2268
Cost
of
Labor
to
meet
demand
$691,040
$1,106,560
$1,308303
$1,360,635
Total
btls
to
be
contracted
(thousands
of
bottles)
-4630 -1300
1800
8000
Contracted
-Price/1000
btls
$298
$310
$322
$335
Total
Cost
-Contracted
$0
$0
$580,170
$2,681,676
Incremental
Operating
Cost(IOC)
$0
$140,000
$290,800
$357,632
Given
the table above,
all significant
cost
has been
considered
to
meet
the
of
shipping bulk tablet/capsule drums
to the
contract
packager
.Although
these
costs will
add
to the
unit
cost
per
bottle,
only
the
major cost
factors
are
included
in
this
study.
For
example, the
number
of
tablets
in
a
drum may
vary for
the
AIDs
drug
since studies
have
not
been
completed
for
the
storage
and
handling
of
bulk
tablets.
Therefore,
it
would
be
helpful
to
keep
in
mind
that the
unit
cost per
bottle
will
most
likely
be
higher
when
contract
packagers
are used
to
fulfill
the
demands.
LABOR COST
PER UNIT
BOTTLE CALCULATIONS
From
the
above
calculations, the
labor
cost per unit
bottle
can
be
obtained
to
allow
the
evaluation and comparison of
the
cost
between
contract packagers and other
alternatives.
Since
the
study
assumes
that
all activities prior
to
packaging
(i.e.,
manufacturing)
have
been
accounted
for
and are capable of
meeting
the
demands;
and
that
all
packaging
component costs will still
be
required regardless of
the
alternatives
chosen,
the
most
logical
comparison
that
can
be
made
between
each
alternative,
is
the
use
of
labor
cost per unit
bottle.
The
total
cost
to
meet
the
demand
each year comprises of
the
cost of
labor
to
meet
the
demand for
each year
(i.e.,
the
direct packaging
labor),
the
total
cost
for
contract
packaging
each
year,
and
the
incremental
operating
cost
(IOC)
that
is incurred every
year.
This
is
the total
cost
to the
site
to
meet
the
demand for
the
respective years.
Hence,
the
division
of
the total
cost
by
the
demand
for
that
yearwill
result
in
the
labor
cost per unit
bottle.
Table 6 below
shows
the total
cost per unit
bottle
(Refer
to
Appendix A
for
complete
[image:30.556.56.504.119.513.2]chart
of
calculations
through to
year
2005):
Table 6
Year
1997
1998
1999
2000
Demand (thousands
of
bottles)
6170
9500
1260
1880
Capacity
(thousands
of
bottles)
1080
1080
1080
1080
Days
114
176
233
348
Shifts
343
528
600
600
Cost
of
Labor/shift
$2016
$2097
$2181
$2268
Cost
of
Labor
to
meet
demand
$691,040
$1,106,560
$1,308303
$1,360,635
Total
btls
to
be
contracted
(thousands
of
bottles)
-4630 -1300
1800
8000
Contracted
-Price/1000
btls
$298
$310
$322
$335
Total
Cost
-Contracted
$0
$0
$580,170
$2,681,676
Incremental
Operating
Cost(IOC)
$0
$140,000
$290,800
$357,632
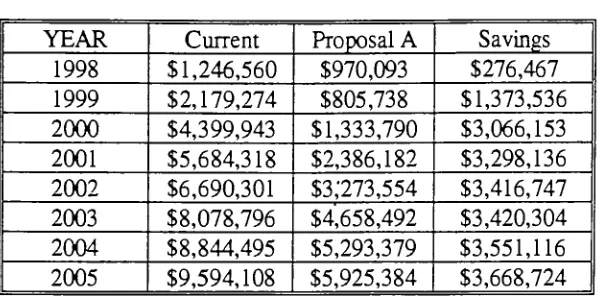
Total Labor/Contract/IOC
Cost
$691,040
$1,246,560
$2,179,274
$4,399,943
CHAPTER
5
-PACKAGING LINE INVESTMENTS
The
investment
of a
packaging line
is
a critical
decision
that
has
to
be
studied
thoroughly
by
a
project/packaging
engineer.
It is
important
that
the
person
overseeing
such a project
be
given
strong
support
from
management, production, maintenance,
and
vendors.3
Unlike
buying
a single piece of
equipment,
a
packaging line include
several pieces
of equipment
that
must work
effectively
together
as a
system;
communicating
and
controlling
the
speed of each other
to
provide
the
most efficient
way
of
completing
the
process.
There
are several
factors
and
decisions
that
have
to
be
made prior
to
scoping
out
the
cost of
the
packaging
line:
Net
production rate
or speed must
be
calculated
based
on
the
expected
efficiency
of
the
line
so
that
the
capacity
calculations can
be determined.
The
finished
product
must
be
presented.
Very
often, the
final
configuration of
the
product will
determine
the
success of
the
project or
line installation.
Marketing
involvement
must
be
constant and
any
changes
to the
design
of
the
final
package must
be
communicated
immediately.
Any
change or
delays
in
developing
the
final
package
design
will result
in
delaying
the
project and
increasing
project cost.
A functional description
of
the
process
involving
the
lines
must
be
written
so
that
all parties
involved
can work with the same
document.
This document is
important
because it
allows
multiplevendors
to
bid for
the
same equipment.Unlike
the
engineering
specification
(which is
a
much moredescriptive
document),
this
document
allows
the
vendorsto
provide
a goodquotation
for
the equipment that the
project
engineer willbe
investigating.
Another
important
factor,
especially in
the
case of
Garden
City,
is
space.
Where
do
you
install
this
packaging line? In
most pharmaceutical
companies,
space
is
a
limiting
factor in
the
packaging
area.
Hence,
the
line
must
be
constructed
withthe
space
issue constantly in
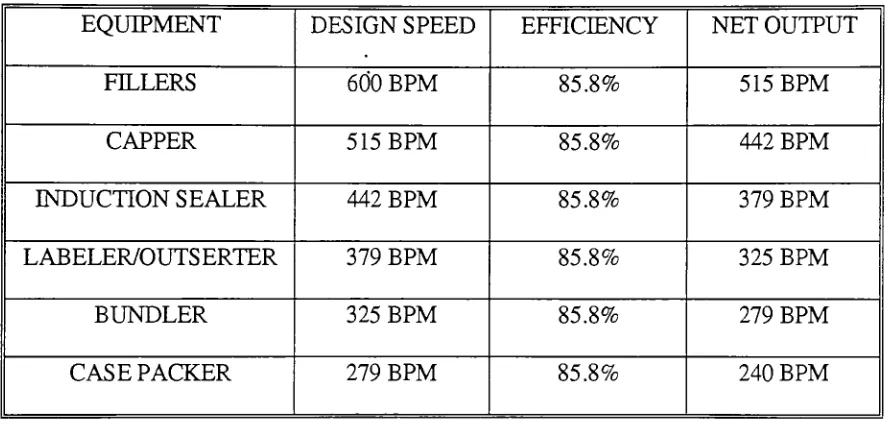
mind.CALCULATIONS
OF PACKAGING LINE SPEED AND CAPACITY
The
most critical machine on
the
packaging line is usually
the
slowest equipment.
In
the
pharmaceuticalpackaging
industiy,
the tablet/capsule
filler is generally
the
limiting
factor
or
equipmenton
the
line. In
the
industry,
the
fastest
tilling
equipmentis
aSlat Filler
that
is
madeby
several manufacturers suchas
DT Lakso
andMerrill-Stokes. The
maximum
design
speed
ofa
Slat Filler is approximately 400 BPM based
on a100
count
fill
with
20 bottles
per drop.4From
the
filler,
tire
process
ofthe
packaging line
willinclude
aCapper,
Induction
Sealer, Retorquer, Labeler,
Outserter
and aBundler.
Hence,
given an average
efficiency
of
85.8%
on
eachindividual
equipment, the
net output speed ofthe
line
canbe
calculatedby-5
4 Personal
Communications,
TechnicalServicesManager. DT Lakso, Bill
Lawion. Nov.'Net
Output
Speed
=400
BPM
x
(0.858)6
=
160 BPM.
From
the
formulas
and
assumptions
obtained
from
the
current
capacity
calculations
in
the
previous
section,
a net
output speed
of
160
BPM
will
give
the
following
capacity:
1st
and
2nd
shifts:
160 BPM
x
400
min./shift x
2
shifts x
60%
=76,800
bottles
3rd
shift:
160
BPM
x
400
min./shift x
1
shift x
40%
=25,600 bottles
From
the above,
if
the
line is
designed
witha net
output of
160
BPM,
it
will
have
a
daily
capacity
of
102,400 bottles
in
a
three-shift
working
environment.
Hence,
with
the
assumption
that
there
are
200
actual
working
days
in
the
Garden
City
site,
the total
maximum
capacity for
this
line is approximately
20.5
million
bottles/year.
Using
the
methods obtained
from
the previous sections
for calculating
the
cost of
direct
labor
to
meet
demand (Proposal A
willrequire
ten
operators
to
run
the
line,
refer
to
chapter
7),
the
cost
for
contract
packaging
services
and
the
incremental
operating
cost,
a
chart similar
to
Appendix
A
is
obtained
(Refer
to
Appendix E). This
scenario or
alternative will
be
known
as
PROPOSAL
A.
PROPOSAL
A
ALTERNATIVE
The
majordifference between
the
calculations
for Proposal A
and
the
Current
Capacity
besides
the
huge increase in
capacity,
is
the
Incremental
Operating
Cost. Since
bottles before
seeking
contract
packaging
assistance, the
operating
costof
the
site
willhave
to
reflect
the
increase
in
the
expected
productivity.Referring
to the
chart
in Appendix
E,
PROPOSAL
A,
the
packaging
line
withone
filler,
will allow
the
Garden
City
site
to
meetdemands
until
the
year2000
and
the
needfor
contract
packaging
will occur
only beyond 2001. Although Proposal A
provides
for
a
good
solution,
other alternatives
that
caterto
die demand
should
be investigated
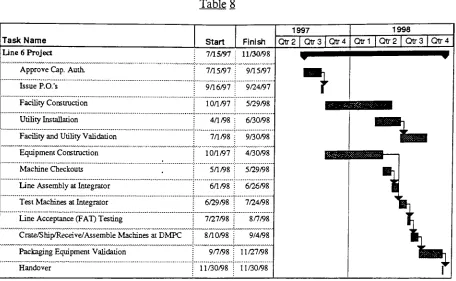
PROPOSAL B
-ALTERNATIVE
In Chapter
3,
Immediate Improvement
Opportunities,
the
investment
and projecton
Line
3
to
provide
for
the
additional
netspeed and
capacity
of
the
line
to
meetthe
demand for 1998
was
discussed. The
project willinvolve
the
replacementof a currentfiller
to
a
newerandfaster
filler. The
oldfiller
(which is
also a slattiller
but
much olderand
less
sophisticated)
willbe
writtenoff afterthe
completion ofLine
3 Project.
However,
if
the
filler
could
be
rebuiltto
providefor
the
extra
capacity,
a minimum of$300,000
could
be
saved
in
the
cost of a
newfiller.
This opportunity
prompted animmediate investigation. A
positiveoutcome
resulted after much work with several vendors
including
DT
Lakso,6
Universal
Machines,7and
Automated
Packaging
Systems8All
of
the
vendorsbelieved
that
the
old
filler
could
be
rebuiltto
providebetter
controls and
newerelectricaltechnology;
andimprovements
to
the
machine would resultin better
compliance withGood
Manufacturing
Practices
(GMP)
6 PersonalCommunications, Vice-President, Operations. DT Lakso. JimHills. Jan. 9,
regulations.
The
rebuilt machine
will
also
be
capable
of
providing
a maximum
design
speed
of
200 BPM.
With
a
filler
that
could
provide
for
a
maximum
design
speed
of
200
BPM,
the
net
output
rate
could
then
be
determined
as:
Net
Output
Speed
=200 BPM
x
(0.858)6
=
80
BPM.
Proposal
B
is
the
combination of
both
fillers,
the
new
high-speed
filler
with a
maximum
design
speed
of
400 BPM'and
the
rebuilt
filler
with a maximum
design
speed of
200 BPM.
Together,
both fillers
will
be
able
to
produce a net output of
240 BPM. In
addition,
having
a
second
filler
with
a separate
fillroom
on a
packaging line
will
improve
the
operating efficiency
since one
fillroom
could
be
cleaned and changeover while
the
other
finishes
the
run
for
that
particular
product.
Furthermore,
the
efficiency
of
the
machine will
improve
greatly
from
the
older
machines
on
Line 2
and
3.
Hence,
the
operating efficiency
of
the
line
on
Proposal
B
will
be
greater
than
the
60%
used
for
the
first
and second
shifts and
the
40%
for
the
third
shift.
This
study
assumes
that
two
separate
fillrooms
on
the
line
will
provide
a
minimumimprovement
of
10%
to
70%
operating
efficiency.
Given
this assumption, the
capacity
calculation
using
the
same
formulas
as
the
sections
above
will show
the
following:
1st
and
2nd
shifts:
240
BPM
x
400
min./shift x
2
shifts
x
70%
=134,400 bottles
Again,
from
the
above,
it
can
be
determined
that
if
the
line
is
designed
with
a net
output
of
240
BPM,
it
will
have
a
daily
capacity
of
179,136 bottles
in
a
three-shift
working
environment.
Hence,
based
on
the
assumption
that there
are
200
actual
working
days
in
the
Garden
City
site,
the total
maximum
capacity
for
Proposal B
is
approximately
35.8
million
bottles/year.
Given
the
maximum
capacity
of
Proposal B
and
based
on
the
methods obtained
from
the
previous sections
for
calculations
of
the
cost of
direct
labor
to
meet
the
demands
(Proposal
B
will also require
ten
operators
to
run
the
line,
refer
to
chapter
7),
the
cost
for
contract
packaging
services and
the
incremental
operating
cost,
we obtain
a chart shown
in Appendix
F,
which
is
similar
to
the
chart
in Appendix A.
From
the chart,
we
have
shown
that
a
capacity
of
35.8
millionwill
completely
remove
the
needs
for
contract
packaging
to
meet
the
additional
demands. In
addition,
comparing
Proposal
B
to
Proposal
A,
the
unit cost of
labor
decreases
by
approximately
50%
(e.g.,
from
$0.108/bottle
to
$0.059/bottle
in
the
year
2001).
There
are several
reasons
for
this
decrease:
With
a greater
daily
capacity
in Proposal
B,
there
is
no actual need of
the
packaging
operations
to
go
to
a
third
shift since
the
maximum
number
of shifts
to
meet
demand
in
year
2005
is
486
shifts.
This
means
that
packaging
would
only
need
another
86
shifts
to
meet
the
maximum,
whichwould
not
justify
a complete
third
shift
for
the
year.
Instead,
managementwould
be
better
off
using
10-
hour
shift whenever
The
additional
capacity
of
Proposal
B
also
mean
that the
productivity
per unit
labor
is
much
better
because
of
the
speed of
the
machines.
Without
the
need of a
full
third
shift, the
total
incremental
operating
cost
(fixed
labor,
operating
expense and
utilities)
will
also
decrease. As
a result of
the
decrease
in
IOC,
the total
cost of
the
bottles
decreases.
PACKAGE DESIGN AND
CONFIGURATION
During
the
determination
of
packaging
line
speed and
capacity
research,
one
has
to
begin pursuing
the
package
design
and configuration of
the
products
in
question.
Since
both Cozaar
and
Hyzaar
are
existing
products,
the
package configurations were
already
determined.
To determine
the
package configuration of
the
AIDs
drug,
the
project engineers
will
have
to
work with
both Research
and
Development
(R&D)
scientists and
Marketing
personnel.
This is
the
stage where all changes
have
to
be
communicated
to the
project
engineer
and
vice-versa.
For
example,
the
requirements
for
desiccant
on
the
AIDs
package
have
not
been determined.
Stability
studies are
held
concurrendy
and results
willnot
be known
until
a much
later
date. The
project engineers
willhave
to
consider
this
addition
to the
package
and
the
equipment
that
may be nec