RESEARCH ARTICLE
Systematic narrative review of decision
frameworks to select the appropriate modelling
approaches for health economic evaluations
B Tsoi
1,2*, D O’Reilly
1,2,3, J Jegathisawaran
1,2, J‑E Tarride
1, G Blackhouse
1,2and R Goeree
1,2,3Abstract
Background: In constructing or appraising a health economic model, an early consideration is whether the model‑ ling approach selected is appropriate for the given decision problem. Frameworks and taxonomies that distinguish between modelling approaches can help make this decision more systematic and this study aims to identify and compare the decision frameworks proposed to date on this topic area.
Methods: A systematic review was conducted to identify frameworks from peer‑reviewed and grey literature sources. The following databases were searched: OVID Medline and EMBASE; Wiley’s Cochrane Library and Health Economic Evaluation Database; PubMed; and ProQuest.
Results: Eight decision frameworks were identified, each focused on a different set of modelling approaches and employing a different collection of selection criterion. The selection criteria can be categorized as either: (i) structural features (i.e. technical elements that are factual in nature) or (ii) practical considerations (i.e. context‑dependent attrib‑ utes). The most commonly mentioned structural features were population resolution (i.e. aggregate vs. individual) and interactivity (i.e. static vs. dynamic). Furthermore, understanding the needs of the end‑users and stakeholders was frequently incorporated as a criterion within these frameworks.
Conclusions: There is presently no universally‑accepted framework for selecting an economic modelling approach. Rather, each highlights different criteria that may be of importance when determining whether a modelling approach is appropriate. Further discussion is thus necessary as the modelling approach selected will impact the validity of the underlying economic model and have downstream implications on its efficiency, transparency and relevance to decision‑makers.
Keywords: Decision analysis, Health economic evaluation, Systematic review, Decision trees, State‑transition models, Markov model, Microsimulation, Agent‑based models, System dynamics, Compartmental models
© 2015 Tsoi et al. This article is distributed under the terms of the Creative Commons Attribution 4.0 International License (http://
creativecommons.org/licenses/by/4.0/), which permits unrestricted use, distribution, and reproduction in any medium, provided
you give appropriate credit to the original author(s) and the source, provide a link to the Creative Commons license, and indicate if changes were made. The Creative Commons Public Domain Dedication waiver (http://creativecommons.org/publicdomain/
zero/1.0/) applies to the data made available in this article, unless otherwise stated.
Background
The use of decision-analytic modelling to estimate the cost-effectiveness of health care interventions is becom-ing widespread to inform health policy decision-makbecom-ing. A model, referred to in this article, is defined as the use of analytical methodology to quantitatively compare health technologies. Models may have a range of uses including extrapolating from primary data sources and transferring
results from one jurisdiction to another [1]. By incorpo-rating event probabilities, resource utilization, costs and patient outcomes, a model synthesizes the data to iden-tify the best option for decision-makers.
However, with the growing reliance on economic eval-uations to support decision-making, concerns have risen on the validity, reliability and comparability of the results generated from such models [1]. To respond to these crit-icisms, the research community has focused considerable efforts in setting best practice guidelines for the devel-opment and conduct of health economic models. This is evident from the guidelines published by respective
Open Access
*Correspondence: [email protected]
1 Department of Clinical Epidemiology and Biostatistics, McMaster
University, Hamilton, ON, Canada
health technology assessment (HTA) agencies (e.g. Canadian Agency for Drugs and Technologies in Health
(CADTH) [2]) and from non-profit research
organiza-tions (e.g. International Society For Pharmacoeconomics and Outcomes Research (ISPOR) [3–5]).
With the growing diversity of modelling approaches available (Table 1), a particular question is the relative merits of each approach in health economic modelling. Historically and still to date, decision trees and Markov cohort models are the most commonly used approaches in economic evaluation. However, due to their limita-tions, awareness has grown on alternative modelling approaches. Guidance documents recommend trans-parent reporting of a modeller’s rationale for selecting a model type, although it may not always be clear which approach would be most suitable for a given decision problem. This is an important issue since each approach can introduce constraints to a model’s development and its conceptualization in terms of what elements can be captured and the ease to which they can be incorporated into the model [6]. This may lead to a different focus on the decision problem and, thereby, generate conflicting results and diverging policy recommendations [7].
To provide guidance on how to select a particular mod-elling approach, frameworks have emerged that catego-rize and distinguish between them. However, no attempt has been made to compare and contrast these frame-works. The purpose of this paper is therefore to conduct a systematic literature review to identify and critically appraise these published frameworks.
Methods Search methods
A literature search was performed for articles published up to January 21, 2014 with the following bibliographic databases searched: OVID Medline (1946-present; In-Process & Other Non-Indexed Citations) and EMBASE (1996-present); Wiley’s Cochrane Library (Issue 1 of 12, Apr 2014) and Health Economic Evaluation Database; PubMed (for non-Medline records); and ProQuest Dis-sertations. Controlled vocabulary terms, such as the National Library of Medicine’s Medical Subject Headings (MeSH), and keywords were used to construct the search strategy (Additional file 1, Additional file 2). The elec-tronic search was supplemented by cross-checking the bibliographies of relevant publications and grey literature searches (e.g. working papers, commissioned reports, policy documents, websites).
Selection of relevant articles
Records were screened for inclusion based on the pre-defined criteria presented in Additional file 3. To be included, a paper had to describe, in whole or in part, a
decision framework (e.g. algorithm, taxonomy) on how to select between economic modelling approaches in the context of health care policy decision-making. Studies were limited to those published in English.
The titles and abstracts of the records identified from the bibliographic search were initially screened for rel-evance by one reviewer (B.T.) with a 50% random check conducted by a second independent reviewer (J.J.). If either reviewers identified a citation as being potentially relevant, its full-text was obtained. In the second phase of screening, one reviewer (B.T.) assessed the full-text ver-sion of all included articles, with a second independent reviewer (J.J.) completing a 50% random sample. Any dis-crepancies at this stage were resolved through discussion and consensus.
Data extraction
A standardized data abstraction form was developed to extract data from the relevant studies. The form captured: bibliographic information (e.g. author, year); framework type (e.g. flow-chart, table); framework description, includ-ing its selection criteria; and the main conclusions. Their evolution and history, if discussed, was further noted.
The selection criteria specific to each decision frame-work were identified. These had to be present within the framework; criteria that were simply mentioned in the paper but not explicitly incorporated into the framework were excluded. These criteria were separated into either structural features or practical considerations. Struc-tural features were defined as those relating to principles or theories behind a model. These are the technical ele-ments that lay bare the intricacies of modelling concepts and the nature of the decision problem will dictate the structural features desired within a model. Practical con-siderations are defined as elements that impact the effec-tiveness or feasibility of developing and constructing a model and are, to a degree, context-dependent.
Data analysis
Data were analyzed and synthesized with the intent to:
i. Understand the evolution of the frameworks; ii. Tabulate and identify the frequency to which
selec-tion criteria were discussed across these frameworks; iii. Evaluate the extent to which the frameworks agree
or disagree on the structural features specific to each modelling approach.
Results
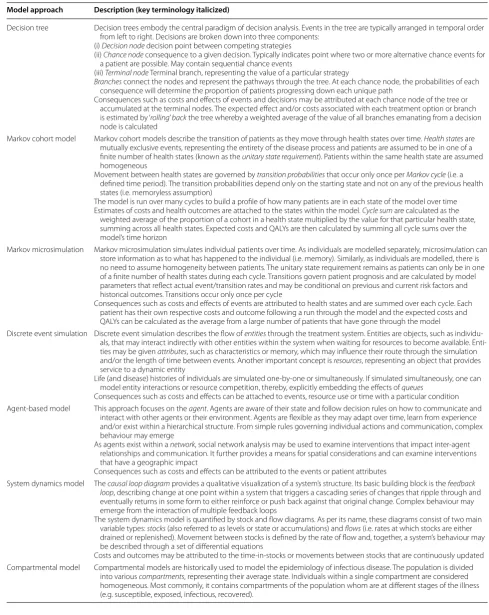
Table 1 Description of modelling approaches employed in health economic evaluation Model approach Description (key terminology italicized)
Decision tree Decision trees embody the central paradigm of decision analysis. Events in the tree are typically arranged in temporal order from left to right. Decisions are broken down into three components:
(i) Decision node decision point between competing strategies
(ii) Chance node consequence to a given decision. Typically indicates point where two or more alternative chance events for a patient are possible. May contain sequential chance events
(iii) Terminal node Terminal branch, representing the value of a particular strategy
Branches connect the nodes and represent the pathways through the tree. At each chance node, the probabilities of each consequence will determine the proportion of patients progressing down each unique path
Consequences such as costs and effects of events and decisions may be attributed at each chance node of the tree or accumulated at the terminal nodes. The expected effect and/or costs associated with each treatment option or branch is estimated by ‘rolling’ back the tree whereby a weighted average of the value of all branches emanating from a decision node is calculated
Markov cohort model Markov cohort models describe the transition of patients as they move through health states over time. Health states are mutually exclusive events, representing the entirety of the disease process and patients are assumed to be in one of a finite number of health states (known as the unitary state requirement). Patients within the same health state are assumed homogeneous
Movement between health states are governed by transition probabilities that occur only once per Markov cycle (i.e. a defined time period). The transition probabilities depend only on the starting state and not on any of the previous health states (i.e. memoryless assumption)
The model is run over many cycles to build a profile of how many patients are in each state of the model over time Estimates of costs and health outcomes are attached to the states within the model. Cycle sum are calculated as the
weighted average of the proportion of a cohort in a health state multiplied by the value for that particular health state, summing across all health states. Expected costs and QALYs are then calculated by summing all cycle sums over the model’s time horizon
Markov microsimulation Markov microsimulation simulates individual patients over time. As individuals are modelled separately, microsimulation can store information as to what has happened to the individual (i.e. memory). Similarly, as individuals are modelled, there is no need to assume homogeneity between patients. The unitary state requirement remains as patients can only be in one of a finite number of health states during each cycle. Transitions govern patient prognosis and are calculated by model parameters that reflect actual event/transition rates and may be conditional on previous and current risk factors and historical outcomes. Transitions occur only once per cycle
Consequences such as costs and effects of events are attributed to health states and are summed over each cycle. Each patient has their own respective costs and outcome following a run through the model and the expected costs and QALYs can be calculated as the average from a large number of patients that have gone through the model
Discrete event simulation Discrete event simulation describes the flow of entities through the treatment system. Entities are objects, such as individu‑ als, that may interact indirectly with other entities within the system when waiting for resources to become available. Enti‑ ties may be given attributes, such as characteristics or memory, which may influence their route through the simulation and/or the length of time between events. Another important concept is resources, representing an object that provides service to a dynamic entity
Life (and disease) histories of individuals are simulated one‑by‑one or simultaneously. If simulated simultaneously, one can model entity interactions or resource competition, thereby, explicitly embedding the effects of queues
Consequences such as costs and effects can be attached to events, resource use or time with a particular condition Agent‑based model This approach focuses on the agent. Agents are aware of their state and follow decision rules on how to communicate and
interact with other agents or their environment. Agents are flexible as they may adapt over time, learn from experience and/or exist within a hierarchical structure. From simple rules governing individual actions and communication, complex behaviour may emerge
As agents exist within a network, social network analysis may be used to examine interventions that impact inter‑agent relationships and communication. It further provides a means for spatial considerations and can examine interventions that have a geographic impact
Consequences such as costs and effects can be attributed to the events or patient attributes
System dynamics model The causal loop diagram provides a qualitative visualization of a system’s structure. Its basic building block is the feedback loop, describing change at one point within a system that triggers a cascading series of changes that ripple through and eventually returns in some form to either reinforce or push back against that original change. Complex behaviour may emerge from the interaction of multiple feedback loops
The system dynamics model is quantified by stock and flow diagrams. As per its name, these diagrams consist of two main variable types: stocks (also referred to as levels or state or accumulations) and flows (i.e. rates at which stocks are either drained or replenished). Movement between stocks is defined by the rate of flow and, together, a system’s behaviour may be described through a set of differential equations
Costs and outcomes may be attributed to the time‑in‑stocks or movements between stocks that are continuously updated Compartmental model Compartmental models are historically used to model the epidemiology of infectious disease. The population is divided
[image:3.595.50.540.101.717.2]it did not present a selection framework to guide the choice between modelling approaches. Overall, the agreement between independent reviewer for study inclusion was considered moderate (Cohen’s kappa 0.60).
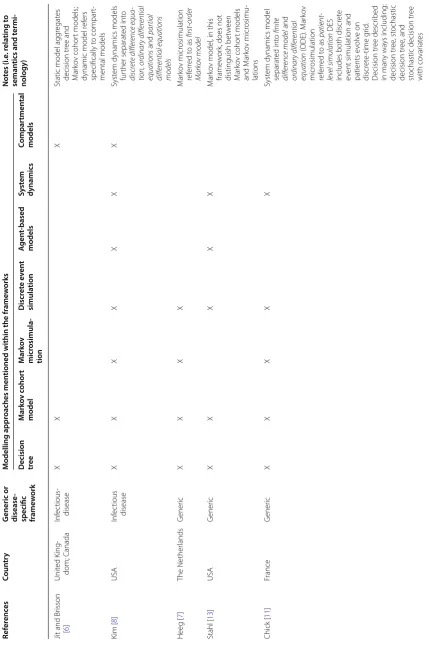
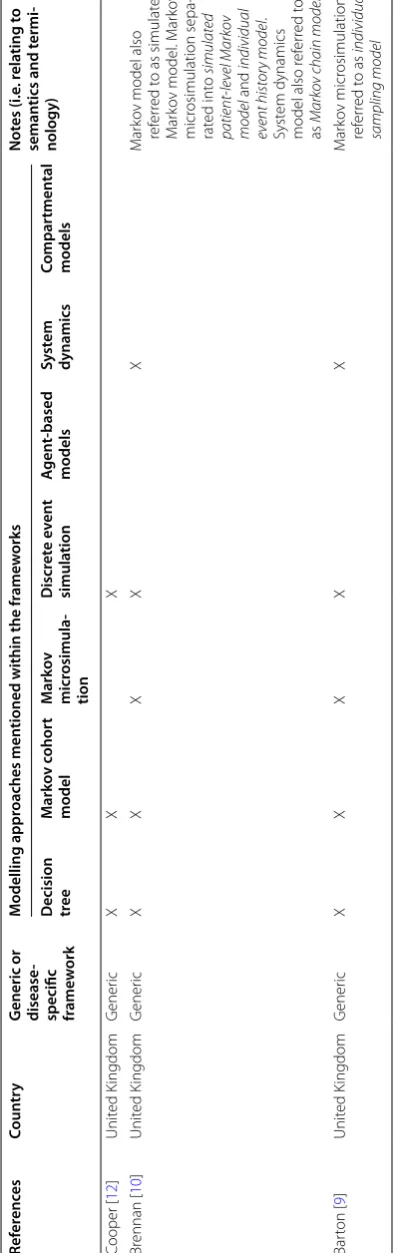
Table 2 provides an overview of the decision works in terms of the country of publication, the frame-work’s focus and the modelling approaches that were covered. All decision frameworks were published in the past 10 years with two specific to infectious diseases [6, 8] and the remainder being generic/non-disease specific [7, 9–13]. Each framework covered different model types, although all of them involved a decision between a tradi-tional modelling approach (i.e. decision tree and Markov cohort model) and one or more alternative approaches (e.g. discrete event simulation; agent-based model; sys-tem dynamics).
Decision frameworks were visually represented by flow charts [6, 9, 12, 13], radar graphs [7], or tables [8, 10, 11] and Table 3 further details the selection criteria
that were considered within each framework. The defi-nition of common structural features and practical consideration that were identified from this review of
frameworks are presented in Table 4. The structural
elements include: the resolution of the population; the capture of first-order uncertainty; the nature of the interactions; the handling of resource constraint; and the dimension of time. From Table 3, it was found that the most common structural features considered amongst these frameworks were interactivity (i.e. static vs. dynamic) and population resolution (i.e. aggregate or individual) (n = 6/8; 75%), followed by how time is han-dled (n = 4/8; 50%) (Table 3). Practical considerations (Table 4b) were explicitly included within most flow-charts and the most common practical consideration were the end-user requirements and simplicity (n = 3/8; 37.5%) (Table 3).
Below, a narrative summary of each framework is pre-sented. A copy of each decision framework can be further found in Additional file 4.
Records idenfied through database searching
(n =5529)
Screenin
g
Included
Eligibilit
y
Idenficaon
Records aer duplicates removed (n = 3342)
Records screened (n = 3342)
Records excluded (n = 3217)
Full-text arcles assessed for eligibility (n = 125)
Full-text arcles excluded, with reasons (117)
No menon of decision-analyc modelling (n=15) Does not present a framework (n=112) Studies reporng a
framework on how to select modelling approach
(n = 8)
Grey literature sources (n =2)
[image:4.595.59.539.88.438.2]Table
2
O
ver
vie
w of the decision fr
ame
w
or
k and the mo
delling appr
oaches c
ov
er
ed within the r
esp ec tiv e fr ame w or ks Ref er enc es Coun tr y G
eneric or disease
-specific frame
w
ork
M
odelling appr
oaches men
tioned within the fr
ame w orks Not es (i.e . r ela ting t o seman
tics and t
ermi
-nology)
Decision tree
M ark ov c ohor t model M ark ov micr osimula -tion D iscr et e e ven t simula tion A gen t-based models Sy st em dynamics Compar tmen tal models
Jit and Br
isson [ 6 ] Unit ed K ing ‑ dom; C anada Inf ec tious ‑ disease X X X
Static model agg
regat es decision tr ee and M ar ko v cohor t models;
dynamic model r
ef ers specifically t o compar t‑ mental models Kim [ 8 ] USA Inf ec tious disease X X X X X X X Syst
em dynamics models
fur ther separat ed int o discr ete differ enc e equa -tion, or dinar y differ ential equations and par tial differ ential equations models Heeg [ 7 ] The Nether lands G ener ic X X X X M ar ko v micr osimulation ref er red t o as first ‑ or der Mark ov model Stahl [ 13 ] USA G ener ic X X X X X M ar ko v model
, in this
frame
w
or
k, does not
distinguish bet w een M ar ko v cohor t models and M ar ko v micr osimu ‑ lations Chick [ 11 ] France G ener ic X X X X X Syst
em dynamics model
separat ed int o finite differ enc e model and or dinar y differ ential equation (ODE). M ar ko v micr osimulation ref er red t o as patient ‑ le vel simulation DES
includes both discr
et
e
ev
ent simulation and
patients e volv e on discr et e‑ time g rid . D ecision tr ee descr ibed in man y wa ys including: decision tr ee , st ochastic decision tr ee , and st
ochastic decision tr
ee
with co
var
iat
[image:5.595.72.504.86.735.2]Generic frameworks
The first paper within the health care field on this topic was by Barton et al. [9]. Based on the following four cri-teria, their flowchart assists in the selection between decision tree, Markov cohort model, Markov microsim-ulation, discrete event simulation and system dynamics: (i) interactivity—importance of capturing interaction between patients; (ii) population resolution—the neces-sity of individual-level modelling; (iii) validity—the ade-quacy of pathways represented by a decision tree; and (iv) simplicity—the number of states required in a Markov cohort model. The authors highlight the trade-off between simplicity and clinical validity. They recommend a more complex and computational-demanding model only if it provides a more accurate representation of the decision problem and leads to more valid results [9]. Sim-plification, according to the authors, may involve fixing one or more parameters in the model and two conditions may justify such a practice: when the results are robust to variation with that particular set of parameters or if the parameter is derived from good and accurate data.
Brennan et al. [10] have proposed a taxonomy
table describing the relationships between modelling approaches according to their structural features. The columns in their taxonomy highlight the assumptions of population resolution; expected value/memory and first-level uncertainty while the rows describes the interac-tion between individuals and the handling of time. Each cell in the table lists the modelling approach with those corresponding structural features. Some of the model structures described in this taxonomy can be consid-ered subclassification of specific modelling approaches. For instance, depending on the dimension of time and first-order uncertainty, system dynamics was separated into finite difference equation system dynamics, ordi-nary differential equation system dynamics, discrete time Markov chain model and continuous time Markov chain model. The authors state that the identification of health states and risk factors, and their underlying relationships should precede the selection of a modelling approach. If multiple approaches are suitable, the simplest model that accurately addresses the decision problem should be cho-sen with further consideration on practical factors such as software availability, implementation skills, time con-straints and end-user requirements [10].
Chick [11] simplifies Brennan’s proposed taxonomy by removing the rows specific to the dimension of interac-tivity; thereby, reducing the subclassification of certain modelling approaches seen in Brennan et al’s original taxonomy (i.e. microsimulation, system dynamics). How-ever, it remains unclear why, for one set of features (i.e. stochastic Markovian individual discrete time), the cell is empty in Chick’s framework and is not associated with
Table
2
c
on
tinued
Ref
er
enc
es
Coun
tr
y
G
eneric or disease
-specific frame
w
ork
M
odelling appr
oaches men
tioned within the fr
ame
w
orks
Not
es (i.e
. r
ela
ting t
o
seman
tics and t
ermi
-nology)
Decision tree
M
ark
ov c
ohor
t
model
M
ark
ov
micr
osimula
-tion
D
iscr
et
e e
ven
t
simula
tion
A
gen
t-based
models
Sy
st
em
dynamics
Compar
tmen
tal
models
Cooper [
12
]
Unit
ed K
ingdom
G
ener
ic
X
X
X
Br
ennan [
10
]
Unit
ed K
ingdom
G
ener
ic
X
X
X
X
X
M
ar
ko
v model also
ref
er
red t
o as simulat
ed
M
ar
ko
v model
. M
ar
ko
v
micr
osimulation sepa
‑
rat
ed int
o
simulated
patient
‑
le
vel Mark
ov
model
and
individual
ev
ent histor
y model
.
Syst
em dynamics
model also r
ef
er
red t
o
as
Mark
ov chain models
Bar
ton [
9
]
Unit
ed K
ingdom
G
ener
ic
X
X
X
X
X
M
ar
ko
v micr
osimulation
ref
er
red t
o as
individual
[image:6.595.69.272.97.725.2]Table
3
Summar
y of the decision crit
eria (i.e
. str
uc
tur
al f
ea
tur
es and pr
ac
tic
al c
onsider
ations) c
onsider
ed within each decision fr
ame
w
or
k
a I
nt
er
ac
tion, as defined in this fr
amew
or
k, includes both in
ter
ac
tion bet
w
een individuals or c
onstr
ain
ts in r
esour
ces tha
t aff
ec
t individuals
.
b A
gg
rega
tion of c
ohor
t r
ef
ers t
o whether a single or multiple c
ohor
t of pa
tien
ts ar
e modelled
. I
t is c
ommonly r
ef
er
red t
o whether the popula
tion is open (i.e
. new individuals can en
ter model) or closed (i.e
. no new addi
-tions ar
e made in the model).
Ref
er
enc
es
Type of frame
w
ork
Fr
ame
w
ork elemen
ts
Struc
tur
al f
ea
tur
es
Pr
ac
tical c
onsider
ations
Popula
tion
resolution
First or
der
unc
er
tain
ty
In
ter
ac
tivit
y
Resour
ce
constr
ain
ts
D
imension of Time
O
ther
Time
End-user requir
emen
t
Simplicit
y
Validit
y
O
ther
(a) G
ener
ic decision frame
w
or
ks
Heeg [
7
]
Radar g
raph
X
X
X
X
M
emor
y
X
X
Exper
ience
Stahl [
13
]
Flo
w diag
ram
X
X
X
X
A
gent aut
onom
y
Spatial consid
‑
eration
X
Chick [
11
]
Table
X
X
X
Expec
ted
value
C
ooper [
12
]
Flo
w diag
ram
X
a
X
a
M
odelled duration
Recur
rence
A
gg
regation
of cohor
t
b
X
X
X
X
M
odel er
ror
Br
ennan [
10
]
Table
X
X
X
a
X
a
X
Expec
ted
value
Bar
ton [
9
]
Flo
w diag
ram
X
X
a
X
a
X
X
(b) D
ecision frame
w
or
ks specific t
o inf
ec
tious disease modelling
Jit and Br
isson
[
6
]
Flo
w diag
ram
X
K
im [
8
]
Table
X
X
Table
4
N
omencla
tur
e and definition of c
ommonly
-men
tioned decision crit
erion f
or selec
ting a mo
delling appr oach (a) S truc tur al f ea tur es Q uestion t o diff er en tia te bet w een a ttribut es: Typical classifica tion Definition Population r esolution What le
vel is the model ar
ising?
A
gg
regat
e (ma
y also be
ref
er
red t
o as cohor
t)
The model is at a macr
o‑
le
vel with a population agg
regat
ed
and run thr
ough the model t
ogether . V ar iables r epr esent population a verages [ 8 ]. R
elies on a homogeneit
y assump
‑
tion that individuals within a par
ticular health stat
e ar e homogeneous [ 10 , 12 ]. To incor porat
e individual fac
tors
or memor
ies int
o the model
, separat
e health stat
es ar e requir ed [ 10 , 12 ]. I nt erac tions ar
e also modelled at an
agg
regat
e le
vel
Individual
The model is at a micr
o‑
le
vel with individuals going thr
ough
the model separat
ely [ 8 , 10 , 13 ].
This easily incor
porat
es
individual fac
tors and memor
y. P atient charac ter istics ma y be r
etained as continuous var
iables [
4
]
Per
mits exploration of first
‑or der uncer taint y First or der uncer taint y [ 14 ]
To what ex
tent is the model capable of incor
porating and
analysing patient
‑le
vel var
iabilit
y within its struc
tur e? D et er ministic No var iabilit
y in the out
comes bet
w
een identical patients
.
W
ithin a g
iv
en sample of patients
, individuals facing the
same pr
obabilities and out
comes will exper
ience the
eff
ec
ts of a disease or int
er vention identically St ochastic Per
mits random var
iabilit
y in out
comes bet
w
een identi
‑
cal patients as ther
e exists uncer
taint
y in patient
‑le
vel
out
comes that is entir
ely due t
o chance
. W
ithin a g
iv
en
sample of patients
, individuals facing the same pr
obabilities
and out
comes will exper
ience the eff
ec
ts of a disease or
int er vention diff er ently . T
his can be per
ceiv
ed as a f
or
m of
random er
ror and
, with incr
eased sample siz
e, the ex
tent of
this uncer
taint
y can be r
educed Int erac tivit y Ar e ac
tors in a model or the o
verall syst em independent? Static/independent No int erac tion pr esent bet w
een or within ac
tors as each
ac
tor is independent and no int
erac
tions at the syst
em le vel [ 9 ] D ynamic/dependent Int erac
tion exists bet
w
een or within ac
tors or at the le
vel of
the syst
em. F
eedback and int
er
dependencies ma
y exist
within the modelled syst
em [ 9 ] Resour ce constraint Ar
e constrained r
esour
ces or queuing impor
tant t o the decision pr oblem? Unlimit ed Ther
e exist no constraints in the syst
em
Constrained
Resour
ce constraints has impac
ts on f
eatur
es within the
model [
13
]
Dimension of time
Ho
w is time handled b
y the model?
Untimed
Time is not explicitly modelled
. Another t
er
m used t
o
descr
ibe this concept of time is
“agg
regat
e”
as changes in
time ar
e not consider
ed impor
tant t
o the model [
13 ] Discr et e Time separat ed int o discr et
e units with an e
vent occur
ring
dur
ing one of the discr
et
e time st
eps [ 8 , 13 ]. T o handle simultaneous e vents , r equir
es smaller fix
ed time int
er vals [ 10 ] Continuous
Time is continuous with an e
vent occur
ring at an
y point
in the continuum of time; ther
eb
y, per
mits modelling of
multiple simultaneous e
vents [
8
[image:8.595.65.524.73.728.2]Table 4 c on tinued (b ) P rac tical c onsider ation Definition Data a vailabilit y The a vailabilit
y of the necessar
y data t
o populat
e the economic model [
7 ] End ‑user R equir ement
This considers whether the model meets the need of its end
‑users and decision
‑mak
ers
. I
t is dependent on ho
w w ell the model struc tur e r eflec
ts and is able t
o captur
e all r
ele
vant aspec
ts of the under
lying r
ealit
y and the cor
responding uncer
‑
tainties that exist [
6
,
10
]. End user r
equir
ement ma
y captur
e whether the modelling appr
oach is consider
ed acceptable
and whether funding is pr
esent t
o suppor
t a par
ticular pr ojec t Exper ience The ex tent t
o which the modeller has accumulat
ed k
no
wledge and implementation sk
ills t
o construc
t the model [
7 ] M odel er ror The deg
ree of impr
ecision in the model that is deemed acceptable b
y either the modeller and/or its end
‑users [
12
]. M
odel
er
ror can either be syst
ematic or unsyst
ematic . Unsyst ematic er ror , synon ymous t o uncer taint
y, can be explor
ed thr
ough
the application of sensitivit
y analysis
. T
he f
easibilit
y of conduc
ting sensitivit
y analysis is dependent on the model struc
tur
e
and its under
lying paramet ers M odelling sof twar e a vailabilit y The accessibilit
y of the necessar
y sof
twar
e(s) t
o construc
t and e
valuat
e the model
. Diff er ent sof twar e ma y suppor t diff er ent modelling appr
oaches and ar
e associat
ed with licensing f
ees
. S
of
twar
es f
or health economic modelling include M
icr
osof
t
Ex
cel (f
or decision tr
ees and M
ar ko v cohor t models); Tr eeage (f
or decision tr
ee
, M
ar
ko
v cohor
t model and M
ar ko v micr o‑ simulation); Ar ena (f or discr et e‑ ev
ent simulation); An
y L og ic (f or discr et e‑ ev
ent simulation, agent
‑based model
, syst
em
‑
dynamics and compar
tmental models); and Ber
kele
y M
adonna (f
or syst
em
‑dynamics and compar
tmental models)
Simplicit
y
The deg
ree of complexit
y in a model
. T
his is essentially dependent on the siz
e of the model (
e.g
. the number of stat
es/
transitions in stat
e‑
transition models) and the number of paramet
ers pr
esent [
9
]. Simpler models ar
e mor
e lik
ely t
o be
underst
ood and accept
ed b y stak eholders [ 12 ] Time
This considers the speed of model de
velopment and captur
es se
veral aspec
ts including the time r
equir
ed t
o pr
og
ramme
the model (building time), the time r
equir
ed t
o collec
t the necessar
y data t
o fill the model (
data collec
tion) and the time
requir
ed t
o generat
e simulation r
esults (simulation time) [
7 ] Transpar enc y The deg ree t
o which the end
‑user of the model can r
evie
w the model struc
tur
e, equations
, paramet
er values and the
under
lying assumptions
. T
his is consider
ed impor
tant b
y modellers f
or t
w
o r
easons: (i) t
o pr
ovide non
‑quantitativ
e
descr
iption of the model t
o those int
er
est
ed in understanding ho
w a model w
or
ks; and (ii) t
o pr ovide t echnical inf or ma ‑ tion t
o those int
er
est
ed in e
valuating a model at the higher le
vel mathematical and pr
og
ramming detail
, possibly with
the int
er
est t
o r
eplicat
e the r
esults . T ranspar enc y pr omot
es an understanding on the model
’s accurac
y, limitation and
pot
ential application.
This is deemed impor
tant t
o build trust and confidence in a model t
o the appr
opr iat e decision ‑ mak ers [ 15 ] Validit y
The clinical r
epr
esentativ
eness of a model t
o the ac
tual decision pr
oblem [ 7 , 12 ]. This addr esses ho w adequat
ely a chosen
modelling appr
oach r
eflec
ts and captur
es all r
ele
vant aspec
ts of the under
lying r
ealit
y and the cor
responding uncer
tain
‑
[image:9.595.68.400.99.735.2]any particular modelling approach [11]. For this particular set of features, Brennan et al’s described the model struc-ture as: ‘discrete-time individual event history model’.
Similarly, Heeg et al. [7] adapts Brennan’s [10] frame-work. However, rather than using a taxonomy table, they displayed their framework as a radar diagram that ranks the relative ability of decision tree, Markov cohort model, discrete event simulation and Markov microsimulation in addressing a collection of selection criterion—includ-ing practical considerations. Each spoke on the radar diagram represents a particular selection criterion and modelling approaches that are better at addressing that criterion appear further away from the origin of the radar diagram. Their framework incorporates all of the techni-cal features proposed by Brennan although different ter-minologies are employed: ‘randomness’ is now referred to as ‘variability’ (i.e. first order uncertainty) while ‘expected value’ is referred to as ‘memory’ [7]. An additional tech-nical feature included is the interaction due to covariates and nonlinear associations between individual risk fac-tors and outcomes. The following practical considera-tions were also included in their framework: time (i.e. to collect data, build and simulate the model); experience and validity (i.e. clinical representativeness) (Table 3) [7].
An independent framework developed by Cooper et al. [12] similarly intertwined practical and structural con-siderations (Table 3) to help guide the decision between Markov cohort model, decision tree and discrete event simulation. The authors state that the nature and the complexity of the disease, and the health care interven-tion, may influence which structural features to con-sider (e.g. interaction between individuals; queuing and resource constraints) [12]. Rather than considering population resolution explicitly as a structural feature, this framework mentioned the impact of dimensional-ity in terms of the differences in time required to build and conduct simulations between aggregate-level and individual-level models. Outside of their framework, the modeller’s experience and data availability were addi-tional factors that, together, may impact the speed and the ease of model development. The authors recommend that the analysis should be built based on the simplest model that can adequately address the research ques-tion [12]. A unique trait in Cooper’s framework is that it recognizes that modelling may not always be possible, and further incorporates an ‘abandon’ scenario when it is futile to pursue modelling given the disconnect between practical constraints and the desired technical attributes (e.g. significant heterogeneity and/or when queuing or interaction between individuals is important). In such cases, when the practical elements and the structural fea-tures conflict, construction of a model should be stopped until such issues are resolved [12].
By moving through a series of decisions pertaining mainly to the desired structural features, Stahl’s [13] hierarchical flowchart filters the choice of modelling approaches down to one to two suitable ones. Similar to Cooper [12], Stahl also advocates that simplicity should be a guiding principle—referring to it as, ‘keep it simple stupid (KISS)’ with a model only as complex as necessary for the question(s) of interest [13].
Infectious disease specific frameworks
Brennan et al’s framework [10] was modified by another group of researchers for the evaluation of vaccines. Mod-els were categorized according to three structural fea-tures: population resolution; first-order uncertainty; and interactivity [8]. As the selection criteria are dichoto-mous, eight possible categories exist (n = 23) although only six categories were linked to modelling approach(es) as some combinations were deemed unrealistic. Kim et al. further recommend that model choice should be based on not only the nature of the decision problem (e.g. research question, natural history and features of the dis-ease) but on practical concerns such as data availability, an analyst’s experience and time [8].
The last framework, by Jit and Brisson [6], utilized a series of questions organized into a flowchart to highlight the key distinctions between static (referred to as cohort models) and dynamic models in the context of infectious disease modelling. According to the authors, infectious diseases have several complexities that make it unique compared to other illnesses: transmissibility (i.e. interac-tion between infected and susceptible individuals); natu-ral immunity; and the epidemiology of the illness (i.e. an infection proceeds through several stages, such as: sus-ceptibility, latency/incubation, infectious/symptomatic and recovery) [6]. These distinctions result in the need for dynamic modelling when the force of infection is not constant over time. Instances include if an interven-tion changes the profile of the infected individuals (e.g. increase pathogenicity or transmissibility by shifting the age profile of the disease) or induces selective evolution on a subset of the organisms (e.g. antibiotic resistance) [6].
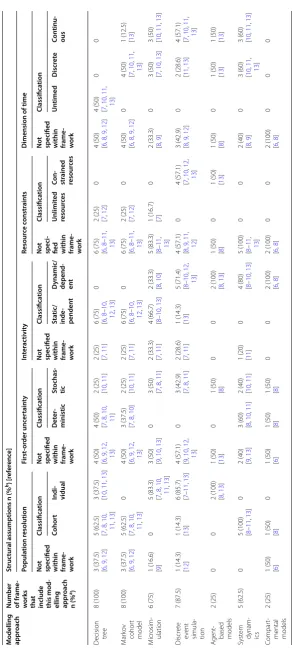
Consistency between decision frameworks
Table 5 presents the degree to which the decision frameworks are consistent in how they classify the struc-tural assumptions specific to each modelling approach. As only two frameworks included agent-based models, both agreed that it is an individual-level approach that can incorporate interactions. System dynamics was seen as an aggregate-level approach that could handle inter-actions. Amongst the frameworks that do discuss the mechanism of time, system dynamic was considered able to model at a discrete unit or continuously although their capacity for handling resource constraints has yet to be addressed. Markov microsimulations have been char-acterized by the majority of the frameworks as an indi-vidual-level approach with time handled discretely or continuously. Few frameworks have addressed first-order uncertainty and the capability of Markov microsimula-tions in handling resource constraints except for one that suggested that microsimulations can assume
unlim-ited resources [7]. Disagreement between frameworks
remained on whether it is capable of handling interaction. For discrete event simulation, of those that addressed resource constraints and first order uncertainty, they all agreed on its capacity to incorporate resource constraints and that it is stochastic. The majority considered discrete event simulation as being capable of handling interac-tions between patients. However, discrepancies lay on how to classify the resolution of such models. For com-partmental models, only the features of population reso-lution, first order uncertainty and interactivity have been discussed so far with the sole agreement being that this approach can incorporate interactions (Table 5).
For traditional modelling approaches, an even greater degree of disagreements was observed in how structural features were specified. Most frameworks did not dis-cuss the notion of resource constraints for decision trees. Of the frameworks that describe the dimension of time and interactivity, they were consistent in characterizing decision trees as static, fixed time horizon (i.e. untimed) models. However, for the remaining two structural fea-tures (i.e. population resolution, first-order uncertainty), less clarity emerged. For Markov cohort models, as per its name, the frameworks all agreed that this modelling approach is not an individual-level modelling approach but rather focused at the aggregate-level. Markov cohort models were considered not capable of handling interac-tion or resource constraints in most except in two of the frameworks (Table 5) [7, 12].
Discussion
Despite the prevalence in the use of traditional model-ling approaches to conduct health economic evaluations, these frameworks all highlight the need for alternative modelling approaches under certain circumstances.
For instance, discrete event simulation permits explicit incorporation of queuing theory and may be suit-able if the question partly involves resource constraints. Agent-based models, on the other hand, can integrate agent-to-agent interactions and are thus suitable when behavior is considered an important characteristic with the problem at hand (e.g. infectious disease modelling). Indeed, it may be safe to extend that there is no single modelling approach that is capable of answering all types of research questions. HTA agencies and other policy organizations that rely on economic modelling to guide reimbursement and resources allocation decision-mak-ing must therefore develop the capacity to construct and critically appraise models outside of what is considered the traditional modelling approaches.
Although several frameworks have been published to distinguish between modelling approaches, there is no clear over-arching or universally-accepted one. Each framework has, in fact, highlighted different selection criteria that may be of importance when choosing the most-suitable approach. A recurring theme that emerged across these frameworks is the necessity for the approach to reflect the underlying theory of the health condition and the characteristics of the health technologies being compared. The modelling approach selected should align with the purpose of the model and the level of detail desired with minimal complexity [4].
However, Table 5 highlighted a concerning
observa-tion: there is a general lack of agreement between the decision frameworks on how the structural features specific to each modelling approach are described. This suggests that, by using different frameworks, one may come to a different decision on what constitutes the most appropriate modelling approach. For instance, consider a model that is interested in exploring the cost-effective-ness of therapies for lowering blood pressure in patients with essential hypertension in terms of the prevention of cardiovascular and cerebrovascular events. The model aims to simulate a cohort of patients with heterogeneous characteristics and, given the existing understanding of hypertension, the model must capture the impact of dif-ferent risk factors on the development of clinical events as these risk factors evolve over time. Additional factors to consider for this decision problem is that resources will be assumed unlimited and that time will be handled discretely. Employing the six generic frameworks without consideration of the practical constraints, we find that four frameworks [7, 9–11] advise for a Markov
micro-simulation, one framework [13] recommends a Markov
Table
5
C
lassific
ation of str
uc tur al elemen ts , sp ecific t
o each mo
delling appr
oach, ac
cor
ding t
o the decision fr
ame
w
or
ks
a D
enomina
tor out of 8 (t
otal number of decision fr
amew
or
ks iden
tified).
b D
enomina
tor out of the number of fr
amew
or
ks tha
t ha
ve discussed tha
t specific modelling appr
oach (i.e . sec ond c olumn). M odelling appr oach
Number of fr
ame
-w
orks that include this mod
-elling appr
oach
n (%
a)
Struc
tur
al assumptions n (%
b) [r
ef er enc e] Popula tion r esolution First -or der unc er tain ty In ter ac tivit y Resour ce c onstr ain ts D
imension of time
Not specified within frame
-w
ork
Classifica
tion
Not specified within frame
-w
ork
Classifica
tion
Not specified within frame
-w
ork
Classifica
tion
Not speci
-fied within frame
-w
ork
Classifica
tion
Not specified within frame
-w ork Classifica tion Cohor t Indi -vidual Det er -ministic St ochas -tic Sta tic/ inde -penden t D ynamic/ depend -ent Unlimit ed resour ces Co n-str ained resour ces Un timed D iscr et e Con tinu -ous D
ecision tree
8 (100)
3 (37.5) [6, 9
,
12
]
5 (62.5) [7, 8
, 10 , 11 , 13 ]
3 (37.5) [10,
11
,
13
]
4 (50) [6, 9
,
12
,
13
]
4 (50) [7, 8
,
10
,
11
]
2 (25) [10
,
11
]
2 (25) [7, 11
]
6 (75) [6, 8
– 10 , 12 , 13 ] 0
6 (75) [6, 8
–
11
,
13
]
2 (25) [7, 12
]
0
4 (50) [6, 8
,
9
,
12
]
4 (50) [7, 10
, 11 , 13 ] 0 0 M ar ko v cohor t model 8 (100)
3 (37.5) [6, 9
,
12
]
5 (62.5) [7, 8
, 10 , 11 , 13 ] 0
4 (50) [6, 9
,
12
,
13
]
3 (37.5) [7, 8
,
10
]
2 (25) [10
,
11
]
2 (25) [7, 11
]
6 (75) [6, 8
– 10 , 12 , 13 ] 0
6 (75) [6, 8
–
11
,
13
]
2 (25) [7, 12
]
0
4 (50) [6, 8
, 9 , 12 ] 0
4 (50) [7, 10
,
11
,
13
]
1 (12.5) [13
] M icr osim ‑ ulation 6 (75)
1 (16.6) [9]
0
5 (83.3) [7, 8
, 10 , 11 , 13 ]
3 (50) [9, 10
,
13
]
0
3 (50) [7, 8
,
11
]
2 (33.3) [7, 11
]
4 (66.7) [8–
10
,
13
]
2 (33.3) [8, 10
]
5 (83.3) [8–
11
,
13
]
1 (16.7) [7]
0
2 (33.3) [8, 9
]
0
3 (50) [7, 10
,
13
]
3 (50) [10
, 11 , 13 ] Discr et e ev ent simula ‑ tion 7 (87.5)
1 (14.3) [12
]
1 (14.3) [13]
6 (85.7) [7–11
,
13
]
4 (57.1) [9, 10
, 12 , 13 ] 0
3 (42.9) [7, 8
,
11
]
2 (28.6) [7, 11
]
1 (14.3) [13
]
5 (71.4) [8–10
,
12
,
13
]
4 (57.1) [8, 9
, 11 , 12 ] 0
4 (57.1) [7, 10
,
12
,
13
]
3 (42.9) [8, 9
,
12
]
0
2 (28.6) [11,
13
]
4 (57.1) [7, 10
, 11 , 13 ] A gent ‑
based models
2 (25)
0
0
2 (100) [8, 13
]
1 (50) [13]
0
1 (50) [8]
0
0
2 (100) [8, 13
]
1 (50) [8]
0
1 (50) [13]
1 (50) [8]
0
1 (50) [13]
1 (50) [13
] Syst em dynam ‑ ics 5 (62.5) 0
5 (100) [8–11
,
13
]
0
2 (40) [9, 13
]
3 (60) [8, 10
,
11
]
2 (40) [10
,
11
]
1 (20) [11
]
0
4 (80) [8–10
,
13
]
5 (100) [8–
11 , 13 ] 0 0
2 (40) [8, 9
]
0
3 (60) [10,
11
,
13
]
3 (60) [10
, 11 , 13 ] Compar t‑
mental models
2 (25)
1 (50) [6] 1 (50) [8]
0
1 (50) [6]
1 (50) [8] 1 (50) [8]
0
0
2 (100) [6, 8
]
2 (100) [6, 8
]
0
0
2 (100) [6, 8
]
0
0
[image:12.595.133.429.79.729.2]cohort model [12]. Other cases exist of applying these frameworks to a decision problem and encountering dif-ferent recommendations in terms of which modelling approach would be recommended.
It may be that, in certain cases, these frameworks do not entirely represent what the authors would consider as best practice, but rather what is recommended and accepted practice in the jurisdiction in which they work (i.e. many countries now have national reimbursement bodies that provide guidelines on economic modelling and may influence the choices of how the researchers in those countries developed their framework). Indeed, dif-ferent frameworks were found to address difdif-ferent sets of modelling approaches (Table 2). It would be expected that frameworks would characterize the structural fea-tures specific to a particular modelling approach similarly although this was not observed (Table 5).
Despite this, another consistent recommendation emerged from these studies in that the decision of which modelling approach to select is dependent not only on the structural assumptions but often also on the practi-cal considerations. It is rarely possible to consider one without the other. Even amongst the frameworks that solely incorporated structural features [6, 8, 10, 11], half included a separate discussion on the practical considera-tions to modelling [8, 10]. The selection of the appropri-ate modelling approach is therefore iterative. The clinical research question (i.e. characteristics of the disease and its intervention) dictates which structural features are important. This filters down the range of suitable mod-elling approaches and subsequently, practical elements such as simplicity, computational efficiency, end-user requirements and transparency may impact the decision on the best-suited modelling approach.
One unresolved question remains: the trade-off between simplicity and internal validity. In most of the frameworks and in other broad economic evalua-tion guidelines, the majority support the noevalua-tion that the model structure should be kept as simple as possible [13,
16]. Barton and colleagues mention that more complex
models are only justifiable when the increased complex-ity leads to more valid results [9]. Another interpretation to the above recommendation is that, when selecting a simpler technique, a modeller should ensure that any error incurred from omitting certain aspects of the dis-ease and its intervention will not materially bias a study’s results [17]. But, how much simplification is possible without compromising a model’s validity? Unfortunately, this is not a straightforward issue as it is based on several factors including the nature of the decision problem (i.e. clinical condition and the treatment alternatives being modelled) and several practical considerations (e.g. avail-able data, time and budget) [18]. Greater research and
education is thus necessary for both modellers and deci-sion-makers to better characterize and understand the implications of such a trade-off.
The observed discrepancy observed between frame-works in the recommendations they provide on which modelling approach is appropriate leads to the question of whether selecting different modelling approaches do in fact impact the model’s results and conclusions? When does it truly matter which modelling approach is used? For instance, to what extent does patient heterogeneity have an impact such that a Markov microsimulation or a Markov cohort model would produce diverging results? Similarly, to what extent does queuing and constrained resources impact the cost-effectiveness of an intervention such that it warrants the need for a discrete event simula-tion? These frameworks were all found to lack a sufficient evidence-base as most were based on general heuris-tics. A means to answer the above questions empirically would be to assess a model’s validity. One approach, based on the concepts of cross-validation, would be to compare the results between highly-dependent mod-els that employ different modelling approaches to oth-erwise address the same research problem by using the same data parameters and sharing common assumptions. Such exercises may inform when it empirically matters whether a particular modelling approach is selected and some of the early pioneers in such activities include the Mount Hood Challenge for diabetes modellers [19].
A recent systematic review was published focused on cross-validation work in health economic models, eval-uating the impact of structural features on the choice of the modelling approach [20]. Population resolution was found to have minimal impact empirically as both aggregate- and individual-level models generated nearly identical results. Rather, consideration on this struc-tural feature was relevant in terms of a practical trade-off between validity and feasibility (e.g. individual-level models required fewer simplifying assumptions, thus increasing its face validity but at the expense of being more time- and data-intensive; and vice versa). In terms of the criterion of interactivity, infectious-disease models have consistently showed that, depending on the assump-tions regarding the probability of disease exposure, dynamic and static models will produce dissimilar results and lead to opposing policy recommendations [20]. Fur-ther research in this area is still required as it may pro-vide the epro-vidence that is necessary to better guide the development of evidence-based decision frameworks.
original framework by Brennan referred to it as “simu-lated Markov model” [13]. This was even more evident for Markov microsimulation as it was referred to by a wide range of terms including: “individual sampling model” [9, 10], “patients evolve on discrete time grid” [11],
“patient-level simulation” [11], “Monte Carlo Markov models”
[13], “Monte Carlo simulation/microsimulation” [8] and “First-order Markov model” [7]. This is concerning as continued use of unclear and inconsistent terminolo-gies can hamper communication between modellers and mislead understanding on these frameworks. It is possi-ble (and we acknowledge) that the differences observed between frameworks may not only lie with their recom-mendations but may also be partly due to differences in their semantics. Given the cross-disciplinary nature of this field, greater effort is necessary to standardize the terminology that is being used. Some excellent work has emerged from ISPOR-SMDM good research practice guidelines [3–5] although much remains to be done.
A limitation with this study is that it focused mainly on literature from the health care context. As previously mentioned, the modelling approaches used in health eco-nomic evaluations originated from the fields of math-ematics, operations research and industrial engineering. Consequently, a vast and rich source of literature is likely to exist within those fields that have not been included in this study. By not including studies from other disci-plines, this paper may not capture the decision frame-works outside of health care. We acknowledge that this is a limitation to this study although it was necessary to restrict the literature search within the field of health to capture the decision criteria that are specifically relevant to the health context.
Conclusions
To reiterate, the aim of this systematic review was not to propose a new framework that unifies the existing frameworks or to provide support towards a single one. Rather, this review was intended to identify and criti-cally appraise the collection of decision frameworks that are currently available to health economic modellers and their users. Although most were developed inde-pendently, at a minimum, all frameworks were found to involve a comparison of the structural features as a means to distinguish between the approaches. Nearly all frameworks considered the criteria of population reso-lution and interactivity; which may perhaps be indica-tive as the absolute minimum needed to be considered when selecting a modelling approach. Furthermore, most authors explicitly considered or discussed the practicali-ties to modelling as part of their framework. Emerging from this review, we find that the process of selecting an appropriate approach for health economic models
involves the consideration of multiple criteria. One must not only align the nature of a given decision problem with the structural features of a modelling approach; practical constraints that are context-dependent must further be examined.
Although decision frameworks are intended to provide a systematic and transparent approach in which to pur-sue the question of which modelling approach should be chosen, this review found a concerning lack of agreement between frameworks in terms of how structural elements are classified. Thus, by employing different frameworks, different recommendations may emerge. In this case, the use of decision frameworks may provide a false sense of confidence that the appropriate methods were employed for the conduct of an economic evaluation and blindly shut down any further debate on the process and the considerations for which a modelling approach was cho-sen. It is intended that this work will hopefully open dia-logue between researchers and policy-makers in terms of providing or requiring greater transparency on how a particular modelling approach is selected. Until better agreement exists amongst frameworks or more empiri-cal research is conducted, we strongly recommend that modellers properly and transparently justify why a par-ticular modelling approach was selected over the others. The choice of a modelling approach is an important and necessary step to any health economic modelling exercise with broad implications on the subsequent model devel-opment and evaluation. Given its potential impact on a model’s validity, the choice should be carefully consid-ered, debated and reported.
Authors’ contributions
BT and RG conceived of this study with all authors participating in its design. BT further conducted the search, performed both level I and II screenings, analyzed the data and drafted the manuscript. JJ performed the role of the second reviewer in conducting the 50% random screen at both level I and II. RG, DO, JET and GB assisted in the interpretation of the data. All authors read and approved the final manuscript.
Author details
1 Department of Clinical Epidemiology and Biostatistics, McMaster Univer‑
sity, Hamilton, ON, Canada. 2 PATH Research Institute, St. Joseph’s Healthcare
Hamilton, Hamilton, ON, Canada. 3 Centre for Evaluation of Medicines (CEM),
St. Joseph’s Healthcare Hamilton, Hamilton, ON, Canada. Acknowledgements
We would like to thank Kaitryn Campbell for her assistance in developing the search strategy for this systematic review.
Additional files
Additional file 1: Search strategy.
Additional file 2: PRISMA 2009 checklist
Additional file 3: Level I screening form.
Compliance with ethical guidelines
Competing interest
Bernice Tsoi is supported through an Award from the Father Sean O’Sullivan Research Centre, St. Joseph’s Healthcare Hamilton and Pfizer Graduate Student Award in Health Technology Assessment. The authors have no other potential relevant affiliations or financial involvement with any organization or entity with a financial interest in or financial conflict with the subject matter or materials discussed in the manuscript apart from those disclosed. No writing assistance was utilized in the production of this manuscript.
Received: 19 July 2014 Accepted: 20 May 2015
References
1. Buxton MJ, Drummond MF, Van Hout BA, Prince RL, Sheldon TA, Szucs T et al (1997) Modelling in economic evaluation: an unavoidable fact of life. Health Econ 6:217–227
2. Canadian Agency for Drugs and Technologies in Health (2006) Guidelines for the economic evaluation of health technologies, 3rd edn. Ottawa 3. Caro JJ, Briggs AH, Siebert U, Kuntz KM (2012) Modeling good research
practices–overview: a report of the ISPOR‑SMDM modeling good research practices task force‑1. Value Health 15:796–803
4. Roberts M, Russell LB, Paltiel AD, Chambers M, McEwan P, Krahn M (2012) Conceptualizing a model: a report of the ISPOR‑SMDM modeling good research practices task force‑2. Value Health 15:804–811
5. Siebert U, Alagoz O, Bayoumi AM, Jahn B, Owens DK, Cohen DJ et al (2012) State‑transition modeling: a report of the ISPOR‑SMDM modeling good research practices task force‑3. Value Health 15:812–820
6. Jit M, Brisson M (2011) Modelling the epidemiology of infectious diseases for decision analysis: a primer. Pharmacoeconomics 29:371–386 7. Heeg BM, Damen J, Buskens E, Caleo S, de CF, Van Hout BA (2008)
Modelling approaches: the case of schizophrenia. Pharmacoeconomics 26:633–648
8. Kim SY, Goldie SJ (2008) Cost‑effectiveness analyses of vaccination pro‑ grammes: a focused review of modelling approaches. Pharmacoeconom‑ ics 26:191–215
9. Barton P, Bryan S, Robinson S (2004) Modelling in the economic evalua‑ tion of health care: selecting the appropriate approach. J Health Serv Res Policy 9:110–118
10. Brennan A, Chick SE, Davies R (2006) A taxonomy of model structures for economic evaluation of health technologies. Health Econ 15:1295–1310 11. Chick SE (2007) Taxonomy of model structure for health economics.
http://www2.wmin.ac.uk/hscmg/qmmhealth2007/talks/Chick_S.‑ .IMAHealth2007.‑.Keynote.pdf. Accessed 20 Jan 2014
12. Cooper K, Brailsford SC, Davies R (2007) Choice of modelling technique for evaluating health care interventions. J Oper Res Soc 58:168–176 13. Stahl JE (2008) Modelling methods for pharmacoeconomics and health
technology assessment: an overview and guide. Pharmacoeconomics 26:131–148
14. Groot KB, Weinstein MC, Stijnen T, Heijenbrok‑Kal MH, Hunink MG (2010) Uncertainty and patient heterogeneity in medical decision models. Med Decis Mak 30:194–205
15. Eddy DM, Hollingworth W, Caro JJ, Tsevat J, McDonald KM, Wong JB (2012) Model transparency and validation: a report of the ISPOR‑SMDM modelling good practices task force. Med Decis Mak 32:733–743 16. Sculpher M, Fenwick E, Claxton K (2000) Assessing quality in decision
analytic cost‑effectiveness models. A suggested framework and example of application. Pharmacoeconomics 17:461–477
17. Karnon J, Brown J (1998) Selecting a decision model for economic evalu‑ ation: a case study and review. Health Care Manag Sci 1:133–140 18. Halpern MT, Luce BR, Brown RE, Geneste B (1998) Health and economic
outcomes modeling practices: a suggested framework. Value Health 1:131–147
19. Palmer AJ, Clarke P, Gray A, Leal J, Lloyd A, Grant D et al (2013) Computer modeling of diabetes and its complications: a report on the Fifth Mount Hood challenge meeting. Value Health 16:670–685
20. Tsoi B, Jegathisawaran J, Tarride J‑E, Blackhouse G, O’Reilly D (2015) Do different decision‑analytic modelling approaches produce different cost‑effectiveness results? Insights from a systematic review of existing cross‑validation studies. Expert Rev Pharmacoecon Outcomes Res 15(3):451–463
Submit your next manuscript to BioMed Central and take full advantage of:
• Convenient online submission
• Thorough peer review
• No space constraints or color figure charges
• Immediate publication on acceptance
• Inclusion in PubMed, CAS, Scopus and Google Scholar
• Research which is freely available for redistribution