RESEARCH ARTICLE
Effects of freezing storage on the
DNA extraction and microbial evaluation
from anaerobic digested sludges
Valeria Romanazzi
1*, Deborah Traversi
1, Eugenio Lorenzi
2and Giorgio Gilli
1Abstract
Background: The anaerobic digestion is one of the most spread renewable energy technology. The input biomasses included various environmental problematic wastes such as sludge coming from wastewater treatment plant (WWTP) and organic fraction of municipal solid waste (OFMSW). As biomolecular procedures have become important tools for the microbial characterisation of anaerobic samples coming from the reactors, it is crucial sampling and extracting properly DNA in order to employ such types of techniques. The current study is aimed to evaluate how freezing tem-perature and length of storage at −20 °C influence both the extracted DNA yield and microbial community quantifi-cations from digested sludge samples collected at full-scale plants.
Results: From WWTP sludge samples, we observed a reduction of DNA concentration comparing fresh and stored samples for 10 days at −20 °C (ANOVA test p < 0.0001), with an estimated DNA loss of approximately 65 % for such types of samples, however the methanogen communities can be assessed respecting the fresh conditions. From OFMSW sludge samples, we observed a reduction in extracted DNA (−90 %), after 120 frozen days, while microbial communities are determined respecting the fresh conditions within 2 months of frozen storage.
Conclusions: The remarkable effect of frozen storage on sludge samples suggests as the better procedure to per-form the DNA extraction from fresh sample. On the other hand it is not generally possible, so approximately 2 months of storage at −20 °C appears to be suitable time at which DNA concentrations remain sufficient to perform coherent microbial characterization through quantitative qRT-PCR.
Keywords: Sludge, Wastewater treatment, Biotechnology, DNA extraction, PCR (polymerase chain reaction)
© 2015 Romanazzi et al. This article is distributed under the terms of the Creative Commons Attribution 4.0 International License (http://creativecommons.org/licenses/by/4.0/), which permits unrestricted use, distribution, and reproduction in any medium, provided you give appropriate credit to the original author(s) and the source, provide a link to the Creative Commons license, and indicate if changes were made. The Creative Commons Public Domain Dedication waiver (http://creativecommons.org/ publicdomain/zero/1.0/) applies to the data made available in this article, unless otherwise stated.
Background
Solid organic waste removal has become an ecologi-cal problem that is increasingly being recognized as the result of an increase in public health concerns and envi-ronmental awareness. The organic fraction of solid waste has been acknowledged as a valuable resource that can be converted into useful products through microbial transformations [1]: in this frame the anaerobic treat-ment seems to be one of the most promising approaches [2–5]. Understanding microbial population develop-ment in landfills over a length of time is challenging due
to the complexity of waste materials deposited and the spatial heterogeneity of landfills. Considerable efforts have been directed toward the development of rapid and dependable methods for the detection and enumera-tion of microbial populaenumera-tions, such as methanogens [6], sulphate-reducing bacteria [7] and hydrolytic microor-ganisms [8] in different types of complex environmental matrices, such as soil, sediment, sludge and stool [9–11]. The molecular techniques for the characterisation and quantification of single microbial communities—with quantitatively and qualitatively sufficient extracted DNA—are now quite widespread for the optimization of the biogas quantity and quality. The complexity of matri-ces such as those described above, together with storage time, can interfere with some technical aspects, making
Open Access
*Correspondence: valeria.romanazzi@unito.it
1 Hygiene Division, Department of Public Health and Pediatrics, University of Torino, Via Santena 5 bis, 10126 Turin, Italy
these types of samples difficult to treat. Storage condi-tions are of great importance when they are related to the quantification of microbial communities characterizing the anaerobic sludges especially at full-scale digesters where there isn’t a own biomolecular laboratory. Stud-ies on microbial characterization of digested sludges are recently growing, since it is considered as an important bioindicator of the state of bioreactor functioning in which the anaerobic digestion process is realized [4, 6,
12–14]. Since the effects of storage conditions on micro-bial community are likely expected, it should be relevant to investigate the freezing effects on microbial popula-tion. Various results concerning the effects of handling and storage conditions on DNA and on the microbial characterization from different environmental matrices exist [10, 11, 15–17], but information regarding the stor-age effects of anaerobic digested sludge samples are still lacking. Various studies revealed that the phylogenetic structure of the microbiota did not significantly differ when human or environmental samples were stored at different temperatures [15–17]. A lower stability of DNA was observed only for storage at room temperatures after 24 h [16].
On the other hand, it is important to recognize that studies on the phylogenetic structure of the micro-bial populations require qualitative evaluations when referring to the relative composition of the microbiota, whereas quantitative measurements using a standard curve represent a different tool that is able to provide quantitative information [18]. Therefore, the current study aimed to define the influence of technical condi-tions—including freezing and storage time—on extracted DNA yield and on microbial targets such as total bacteria and methanogens. The study was carried out on full-scale anaerobic digesters of wastes including digested sludge samples coming from a wastewater treatment plant (WWTP) and from the organic fraction of municipal solid waste (OFMSW).
Results and discussion WWTP samples
Mean of DNA concentrations in the A, B, C and D sam-ples are reported in Table 1, comparing two DNA extrac-tion time points. Samples stored for 10 days at −20 °C displayed a significant decrease of DNA concentrations respect to fresh samples (ANOVA p < 0.0001) of nearly 63 % (T test p = 0.001), 58 %, (T test p < 0.0001), 72 % (T test p < 0.0001) and 70 % (T test p = 0.001) for the A, B, C and D digested sludge types, respectively. Con-sidering fresh samples and comparing them by influent and effluent, no significant decrease in the DNA con-centrations is observed for samples from the secondary treatment (A vs B samples, T test p = 0.125, about 26 %
[image:2.595.304.540.126.348.2]decrement), and no significant increase in the DNA con-centrations is observed for samples from mixed treat-ment (C vs D samples, T test p = 0.120, about 28 % increment). Considering quantifications of microbial communities, total Bacteria have a statistically significant decrement in effluent samples when comparing samples from C and D mixed sludges (−0.05 % in D samples, T test p < 0.0001). However, considering the anaerobic microbial community, a significant increased concen-tration of methanogens is observed in effluent samples for both of the two treatment systems (A vs B second-ary sludge samples T test p = 0.04; C vs D mixed sludge samples T test p < 0.0001) (Fig. 1). Considering frozen samples and comparing them by influent and effluent, a not significant decrement in the DNA concentrations of secondary sludges is observed (A vs B samples, T test p = 0.464, about 16 % decrement), and a not significant increment in the DNA concentrations of mixed sludges is attested (C vs D samples, T test p = 0.069, about 35 % increment). In this case when considering the total bacte-rial microbial community, a statistically significant decre-ment in effluent samples was only found in mixed sludges (−0.04 % in D samples, T test p = 0.001 comparing C and D mixed samples), meanwhile concerning the anaerobic microbial community, a significant increased concentra-tion of methanogens is observed in effluent samples for both of the two treatment systems (A vs B secondary Table 1 Comparison of DNA concentrations in anaero-bic sludges from WWTP and OFMSW samples in the two experimental line
The mean values and SD are reported, based on 10 replicates for each type of samples, concerning WWTP samples. For OFMSW experimental line, only two samples were available, so SD was not calculated, since E and F samples were independent sludge samples
DNA µg/g of weighted sample ± SD WWTP
Fresh samples Frozen samples
A samples 246.1 ± 107.7 89.6 ± 48.2 B samples 182.0 ± 65.2 75.5 ± 35.4 C samples 103.2 ± 44.6 28.3 ± 12.4 D samples 143.9 ± 64.9 43.5 ± 21.1 All samples 168.8 ± 89.0 59.2 ± 39.7
OFMSW
Days elapsed E sample F sample
1 21.6 32.36
19 9.16 22.8
28 13.64 35.88
29 4.64 12.36
21 7.32 15.84
sludge samples +13 % in B samples, T test p < 0.0001; C vs D mixed sludge samples +0.06 % in D samples, T test p = 0.007) (Fig. 1). Both for total bacteria and for metha-nogens concentrations—expressed as extracted DNA mass unit—were similar comparing fresh and frozen quantifications for the same kind of sample, moving into the same order of magnitude (Log scale). The positive and significant correlation between quantifications from
the two extraction points reinforces this last evidence (for total bacteria Spearman’s rho = 0.662, p < 0.0001; for methanogens Spearman’s rho = 0.813, p < 0.0001).
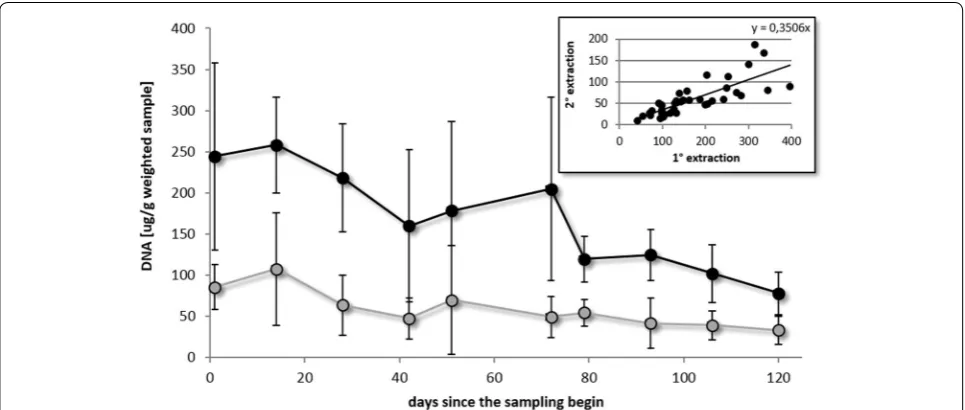
Using a correlation model between the two time points of DNA extraction, the slope value resulting from the equation (=0.35) provides an indirect indication of the amount of DNA lost due to the frozen storage (nearly 65 %) (Fig. 2). We have applied this value on DNA Fig. 1 Total bacteria (triangles) and methanogens (dots) in the four fresh and frozen sample types. Black and grey colours indicate DNA extraction from fresh sample (first extraction) and from 10 days-frozen storage samples, respectively. (A samples input secondary WWTP sludge; B samples output secondary WWTP sludge; C samples input mixed WWTP sludge; D samples output mixed WWTP sludge)
[image:3.595.60.540.88.292.2] [image:3.595.57.540.474.679.2]concentrations from ten days frozen samples, observing successfully that the normal decrease of DNA concen-tration occurring in frozen samples can be adequately controlled.
OFMSW samples
Considering the two E and F samples, their initial DNA concentrations reported on the first monitoring day were 21.6 and 32.4 µg/g dry weight sample, respectively. The noticeable reduction of the total amount of DNA during frozen storage, as observed throughout nearly 4 months of repeated extractions, is evident for both of sam-ples (Table 1). The tendency does not display a regular decrease, however the mean value of the quantified DNA concentration is inversely proportional to the length of the frozen storage period (Spearman’s rho = −0.886, p = 0.019). Overall, the total lost DNA quantity is 81 and 93 % for E and F samples, respectively, when com-paring the mean of the first and the last time point DNA concentrations (T test, p = 0.049). Moreover, the linear regression between the DNA concentration, as evaluated for the two samples, and the frozen storage time displays a decrease of approximately 6.6 % for every 10 days of storage.
Figure 3 shows the presence of total bacteria and meth-anogens in E and F samples as a quantification of the
16SrDNA and mcrA functional gene target respectively. Both total bacteria and the methanogens are quantifiable throughout the entire average abundance of the monitor-ing period with an average of approximately 10616SrDNA
and 105mcrA copies number µl−1 of DNA extracts, and
the gene target concentrations in the two samples are quite similar (paired T test p = 0294, and p = 0.160 for total bacteria and methanogens respectively). Overall, the mean of the methanogen quantification in the two samples is inversely proportional to the length of frozen storage (Spearman’s rho = −0.600, p = 0.208), for total bacteria the levels seem to be less affected by storage time. In particular, the value of the microbial quantifica-tions display a constant tendency until extracted DNA concentrations are appreciable. Thus, after approximately 100 days of frozen storage, in addition to the reduction of DNA concentration, there was a nearly two orders of magnitude reduction in the mcrA quantification value, while only about an half a log for total bacteria.
Since the advent of DNA-based methods to charac-terise complex bacterial communities in biological and/ or environmental samples, often freezing samples is required, in order to perform the analysis on a larger number of samples collected at different times. This is crucial especially switching from lab scale to full scale digesters. The use of specific biomolecular techniques has been recently expanding in the field of microbial charac-terisation of environmental samples in addition to the use of the classical and time-consuming culture methods. Even if these techniques are still very reliable with a low DNA concentration, it is important to take into account that also the technical aspects such as storage conditions could have a role in obtaining higher quality-genomic samples.
Concerning our study, variations of DNA concentra-tions among the four types of WWTP fresh samples
[image:4.595.56.541.481.689.2]are expected, since different microbial communities are temporally selected during the anaerobic diges-tion process. In particular the anaerobic condidiges-tions establishing within the bioreactor induce the growth of the anaerobic microbial communities, leading to increased DNA concentrations and to increased pres-ence of growing methanogens in the effluent samples (B and D samples). While this tendency is well evident for the mixed treatment, the secondary system shows an inverse tendency likely due to inhibition of aero-bic community (typically more abundant in second-ary activated sludges than mixed sludges) during the anaerobic digestion, thus masking the contribution of growing anaerobic communities (Table 1). In fact when considering only the methanogens, an increased concentration of anaerobic communities is observed in effluent samples for both of the two treatment systems (Fig. 1). Even if—comparing fresh and frozen sam-ples—all the fluctuations in terms of DNA concentra-tions are kept, the significant reduction found in the frozen samples pays serious attention to the microbial quantification. As observed for OFMSW samples, the methanogens quantification remains quite constant for DNA concentrations ranging from 4.6 to 35.9 µg g−1 of
weighted sample: only for DNA concentration values below this range, also the methanogens quantification has a decrement but not statistically significant, prob-ably attributable to the low numerosity of data (Fig. 3) suggesting the DNA extraction from such samples after short freezing time. A 2 months period is desir-able. Storage conditions are considered to be a critical component of DNA-based microbial community anal-ysis methods. In regards to our study, since fresh and frozen samples were technically processed in a same way (same DNA extraction kit, same operative DNA extraction conditions), the observed differences in the DNA concentrations comparing fresh and frozen sam-ples could be mainly likely due to the freezing storage, considering also the intrinsic variability of a complex matrix such as anaerobic sludge. Results highlight nei-ther the freezing temperatures nor the length of fro-zen storage (ranging from 10 days to approximately 2 months) appeared to adequately preserve environ-mental samples from a genomic DNA yield point of view. It should be also important to distinguish between “freezing step” and “thawing step” among the general expression “freezing storage”. Actually we are not really able to attribute the observed differences in DNA yields to the first or to the second step. However the Table 1—concerning DNA quantity in OFMSW samples—shows how if the problem was the thaw-ing, a decrease in DNA yield over the time should not be observed, and the last aliquot should have a DNA
content comparable to the first aliquot, since the DNA degradation (by DNAse or other) should occur with the same entity on the first aliquot as well as on the last one. For this reason the degradation seems to be likely attributable to the length of time during which the sample is kept at −20 °C, and not to the thawing phase. Freezing storage is only one among the many troubles related to the treatment of such complex type of samples. Actually literature on anaerobic sludge samples do not contemplate, for example, the use of any substances to preserve DNA during the thawing. During this phase microbial cells could be broken and DNA as well as DNAases that destroy DNA could be released. However, similar studies on this kind of sam-ple indicate any substance or reagent to preserve the anaerobic sludge samples from the degradation of nucleic acids [4, 6, 12, 14, 19]. One of the major imped-iments in quantifying microorganisms from environ-mental samples is, for example, the presence of several potentially PCR-inhibiting factors, including humic substances, metals and ions that in the present study were adequately controlled by ten-fold diluting of sam-ples [4, 6, 20]. Also there are other several wastewater treatment process parameters can influence the pres-ence and the viability of microbial communities in these samples: retention time, type of digestion (batch or continuous), reactor configuration, pH, concentra-tion and composiconcentra-tion of (volatile) fatty acids, available nutrients, structure and composition of bacterial com-munities, microbial competition and chemical interac-tions, including ammonia toxicity [19, 21, 22], could interfere both with the DNA quantification and the molecular characterisation of microbial communities, making this type of sample much more variable from a management point of view than other environmental and biological samples originated in more stable con-ditions. In line with freezing storage timing tested on OFMSW samples, the methanogens quantification in WWTP samples is not so affected when performed on ten-days frozen samples, comparing it with the quanti-fication on fresh samples (Fig. 1).
Conclusions
Our findings indicate that the enumeration of abundant microbial populations from complex samples—such as methanogens in anaerobic sludges—was not significantly affected when processed after short periods of storage at −20 °C (about 10 days), comparing with fresh-processed samples. Also longer time storage at −20 °C does not sig-nificantly affect the DNA concentration nor the princi-pal microbial communities colonizing anaerobic sludge samples. Although the freezing storage represents a con-solidated lab practice to preserve samples, our purpose was to consider how this technical procedure poten-tially could lead to underestimated results; this is rele-vant when the quantification and characterisation of the microorganism community in reactors—together with chemical and physical parameters—is used for the con-trol and management of the anaerobic process.
Methods Samples
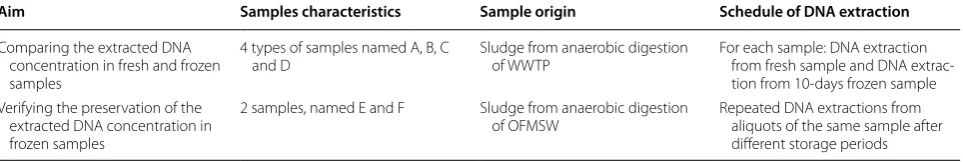
Two different types of sampling activities and schedule procedures were performed (Table 2). For the first exper-imental line, sludge samples coming from the anaerobic digestion treatment of WWTP sludge were intended to highlight any differences in DNA yield between fresh and 10-days frozen samples. Forty samples were provided by the SMAT (Società Metropolitana Acque Torino S.p.A.), which is concerned with wastewater treatment in Cas-tiglione Torinese (Italy). Samples coming from two dif-ferent biodigesters: one biodigester is fed with sludge from the secondary treatment of wastewater (A and B samples), and another is fed with mixed sludge (50 % of sludge from primary treatment + 50 % of sludge from secondary treatment; C and D samples), where A and C samples were collected at the influent (feeding input sludge), and the B and D samples were collected at the effluent (digested output sludge) of each biodigester. For each sample type (A, B, C and D), 10 samples were col-lected, every 15 days along a period of 5 months. 500 ml of sludge sample were collected in sterile PET bottles for microbiological analysis, and then the samples were
divided into aliquots of 50 ml of undiluted sludge. Thus, for each sample, DNA was extracted twice: the first extraction was intended to quantify DNA from fresh sample, and the second extraction occurred after 10 days of frozen storage at −20 °C using the same aliquot.
For the second experimental line, sludge samples com-ing from the anaerobic digestion of OFMSW treatment plant in the province of Alessandria (Italy) were used to test the DNA preservation status of saved samples throughout a frozen storage period ranging from 20 to 120 days. Sludge samples were harvested from two dif-ferent sections of the same sole biodigester under inves-tigation: considering a reactor diameter of approximately 25 m, the E sample was harvested from a more external side (2 m section from the wall towards the centre), and the F sample was harvested from the central section of the reactor. The sludge samples were collected in the same manner of the WWTP samples; after an accurate mixing, undiluted samples were divided into 10 aliquots and then stored at −20 °C. Arranging a number of sep-arate aliquots for each sludge sample was also useful to correctly perform the following biological evaluations: in this way thawing and DNA extraction occurred one sole time for each aliquot, avoiding repeated thawing and re-freezing steps. With a regular periodicity (on aver-age every 25 days, for a entire period of approximately 4 months), each of these stored aliquots was thawed for DNA extraction and quantification until the DNA concentration reached the threshold of 1 µg ml−1. This
threshold is the minimum DNA concentration needed to provide sufficient DNA template for each qPCR reaction [26] and to detect single microbiological groups, such as methanogens, for which at least 0.1 ng of DNA for PCR is necessary [13].
Extraction, quantity and quality of DNA
50 ml of sludge sample from each type of biodigester were centrifuged at 2500g for 10 min, to collect all par-ticulate matter eventually in the supernatant (including cells and bacteria) into the pellet at the bottom, and the supernatant was then discarded. Every DNA extraction
Table 2 Schematic experimental design of the two conducted experiments in which two clearly distinct activities are described
Aim Samples characteristics Sample origin Schedule of DNA extraction
Comparing the extracted DNA concentration in fresh and frozen samples
4 types of samples named A, B, C
and D Sludge from anaerobic digestion of WWTP For each sample: DNA extraction from fresh sample and DNA extrac-tion from 10-days frozen sample Verifying the preservation of the
extracted DNA concentration in frozen samples
2 samples, named E and F Sludge from anaerobic digestion
[image:6.595.58.540.645.726.2]was performed with a commercial kit already employed for sludge samples [7, 15] (PowerSoil DNA Isolation Kit, MO-BIO Laboratories Inc., Carlsbad), starting from 0.25 g of semi-dry pellet, in accordance to the manu-facturer’s instructions. No treatment to protect DNA against DNAse was applied neither for fresh nor for frozen-thawed samples: the same DNA extraction proce-dural conditions for all samples coming from both of the two experimental lines were carried out. The fluorimet-ric quantification of each DNA sample was performed using a Qubit™ Fluorometer and Qubit™ dsDNA HS Assay by Invitrogen (distributed by Life Technology Ltd., Paisley, UK) on diluted DNA aliquots (range of stand-ard curve: 0–10 µg ml−1). The DNA samples were stored
at −20 °C until the PCR analysis was performed. The A260/280 ratio was calculated by spectrophotometric method (BioTek Instruments plate Reader—PowerWave HT, accessorized with Gen5 software) for the quality of extracted DNA. For the WWTP freshly-processed sam-ples the average ratio was 1.95, conversely the average ratio is less favorable for frozen WWTP samples with a value of 1.8.
RT‑qPCR for microbial target quantification
Real-Time Quantitative PCR (RT-qPCR) was performed using a Chromo4 thermal-cycler (Bio-Rad, Hercules, CA) and Opticon Monitor 3 Software. The amplification target for total bacteria quantification was the riboso-mal RNA 16S subunit (16SrDNA) [27]; for methanogen quantification was the functional gene methyl-coenzyme M reductase α-subunit (mcrA) [6]. For methanogens 2 µl of ten-fold diluted sample (about 8 ng of DNA per single PCR reaction) was added to the reaction mix-ture consisting of 10 µl of SsoFast EvaGreen® Super-mix (Bio-Rad, Hercules, CA), 0.25 µmol l−1 of forward
(mlas-F: 5′-GGTGGTGTMGGDTTCACMCARTA-3′) and reverse (mcrA-R: 5′-CGTTCATBGCGTAGTTV GGRTAGT-3′) primers [6] (Thermo Fisher Scientific, Waltham, MA, USA), and 7 µl of ultrapure water in a 20 µl volume reaction. Primers targeting the specific por-tion of DNA coding for the funcpor-tional gene mcrA were used as previously described by Steinberg and Regan [6] (the accession numbers of the used sequences are reported by Steinberg and Regan in their study). Total methanogens were quantified using a standard curve in which the mcrA gene from Methanosarcina acetivorans
was placed into the pCR21 vector [6]. The mcrA plasmid was first amplified through the transformation of Top 10
E. Coli cells, and then, the plasmid was extracted using a commercial kit (NucleoSpin Plasmid, Macherey–Nagel, Düren, Germany) as previously described [13]. Serial ten-fold dilutions of the plasmid DNA containing mcrA gene was applied, and a six-point standard curve ranging from
2.5 × 10⁷ to 2.5 × 10² copies of mcrA was applied. For
total bacteria 2 µl of ten-fold diluted samples was added to reaction mixture consisting of 8 µl IQ™ Multiplex Pow-erMix (Bio-Rad, Hercules, CA, USA), 0.2 µl molecular probe (10 µM concentration), 0.5 µl each of the forward and reverse primers (10 µM final concentration, Thermo Fisher Scientific, Waltham, MA, USA) and 8.8 µl of ultrapure water in a 20 µl final reaction volume. To obtain an absolute quantification of all targets in sludge sam-ples, the genomic DNA of each microorganism, provided by the American Type Culture Collection, LGC (ATCC, Manassas, VA, USA), was used as standards. Serial ten-fold dilutions of each ATCC standard were assayed, and quantifications are expressed as gene copy number µl−1
of extracted DNA, assuming four 16SrDNA gene copies per bacterium [4]. Standards and samples were tested in triplicate and DNA quality and integrity were evaluated by gel electrophoresis before the chain reaction. Reaction condition were 95 °C for 3 min (1×), then 95 °C for 3 s, 55 °C for 45 s, 72 °C for 30 s and 83 °C for 5 s (40×). A final melt curve analysis was performed to verifying the specificity of PCR products. The program was as follows: denaturation of 1 min at 95 °C, cooling of 1 min at 65 °C and then 95 °C, at a rate of 0.5 °C per cycle. For total bac-teria, the reaction conditions were 95 °C for 3 min (1×), then 95 °C for 30 s, 55 °C for 1 min (39×). The other amplifications were performed for 30 s, 55 °C for 1 min (40×); a melt curve was not performed. The results were expressed as the mcrA and 16SrDNA gene copies num-ber per ng of DNA. The triplicate averages were accepted only if the coefficient of variation was below 20 %. All the PCRs were conducted taking into account the reaction efficiency (ŋ efficiency values >75 %).
Statistical analysis
The Spearman correlation coefficient was used to assess the relationship between the variables. Consid-ered variables were the DNA yield expressed as ug g−1
of weighted sample, and microbial targets expressed as gene copies number per ng of DNA. A T test of inde-pendent variables and an ANOVA test were used to compare two or more means, respectively. A paired T-test was used to compare singular values from two sets of data. Log-transformation was needed for the microbial evaluation data. All the statistical evaluations were considered significant at p < 0.05. Statistical analy-ses were performed with the SPSS Package version 19.0 for Windows.
Abbreviations
Authors’ contributions
VR carried out the experimental work, analyzed the data and wrote the manu-script; DT analyzed the data, scheduled the sampling activities and supervised the lab activity; EL provided SMAT samples together with chemical analysis; finally GG revised the overall work as Head of the lab. All authors read and approved the final manuscript.
Author details
1 Hygiene Division, Department of Public Health and Pediatrics, University of Torino, Via Santena 5 bis, 10126 Turin, Italy. 2 SMAT, Società Metropolitana Acque Torino S.p.A., Corso XI Febbraio 14, 10152 Turin, Italy.
Acknowledgements
The authors wish to thank the European Community for funding. This work was produced as part of the project financed in the context of the Fuel Cells and Hydrogen Joint Undertaking (FCH-JU) Seventh Framework Programme titled “SOFC CCHP with poly-fuel: operation and maintenance” (Project acro-nym: SOFCOM, Grant agreement number: 278798). We wish to give special acknowledgment to all of the collaborators employed in the anaerobic diges-tion plants and, obviously, the owners of the companies.
Compliance with ethical guidelines
Competing interests
The authors declare that they have no competing interest.
Received: 12 November 2014 Accepted: 31 August 2015
References
1. Khalid A, Arshad M, Anjum M, Mahmood T, Dawson L. The anaerobic digestion of solid organic waste. Waste Manag. 2011;31:1737–44. 2. Diaz I, Donoso-Bravo A, Fdz-Polanco M. Effect of microaerobic
condi-tions on the degradation kinetics of cellulose. Bioresour Technol. 2011;102:10139–42.
3. Guerrero L, Chamy R, Jeison D, Montalvo S, Huilinir C. Behavior of the anaerobic treatment of tannery wastewater at different initial pH values and sulfate concentrations. J Environ Sci Health Tox Hazard Subst Environ Eng. 2013;48:1073–8.
4. Merlino G, Rizzi A, Villa F, Sorlini C, Brambilla M, Navarotto P, Bertazzoni B, Zagni M, Araldi F, Daffonchio D. Shifts of microbial community structure during anaerobic digestion of agro-industrial energetic crops and food industry byproducts. J Chem Technol Biotechnol. 2012;87:1302–11. 5. Ryckebosch E, Drouillon M, Veruaeren H. Techniques for transformation of
biogas to biomethane. Biomass Bioenerg. 2011;35:1633–45. 6. Steinberg LM, Regan JM. Phylogenetic comparison of the
methano-genic communities from an acidic, oligotrophic fen and an anaerobic digester treating municipal wastewater sludge. Appl Environ Microbiol. 2008;74:6663–71.
7. Ben-Dov E, Brenner A, Kushmaro A. Quantification of sulfate-reducing bacteria in industrial wastewater, by real-time polymerase chain reaction (PCR) using dsrA and apsA genes. Microb Ecol. 2007;54:439–51. 8. Regueiro L, Veiga P, Figueroa M, Alonso-Gutierrez J, Stams AJ, Lema
JM, Carballa M. Relationship between microbial activity and microbial community structure in six full-scale anaerobic digesters. Microbiol Res. 2012;167:581–9.
9. Pesaro M, Widmer F. Identification and specific detection of a novel pseudomonadaceae cluster associated with soils from winter wheat plots of a long-term agricultural field experiment. Appl Env Microbiol. 2006;72:37–43.
10. Rissanen AJ, Kurhela E, Aho T, Oittinen T, Tiirola M. Storage of environmen-tal samples for guaranteeing nucleic acid yields for molecular microbio-logical studies. Appl Microbiol Biotechnol. 2010;88:977–84.
11. Wallenius K, Rita H, Simpanen S, Mikkonen A, Niemi RM. Sample storage for soil enzyme activity and bacterial community profiles. J Microbiol Methods. 2010;81:48–55.
12. Garcia-Pena EI, Parameswaran P, Kang DW, Canul-Chan M, Krajmalnik-Brown R. Anaerobic digestion and co-digestion processes of vegetable and fruit residues: process and microbial ecology. Bioresour Technol. 2011;102:9447–55.
13. Traversi D, Villa S, Acri M, Pietrangeli B, Degan R, Gilli G. The role of differ-ent methanogen groups evaluated by Real-Time qPCR as high-efficiency bioindicators of wet anaerobic co-digestion of organic waste. AMB Express. 2012;1:28.
14. Zhao YG, Wang AJ, Ren NQ. Effect of sulfate absence and nitrate addition on bacterial community in a sulfidogenic bioreactor. J Hazard Mater. 2009;172:1491–7.
15. Bahl MI, Bergstrom A, Licht TR. Freezing fecal samples prior to DNA extraction affects the Firmicutes to Bacteroidetes ratio determined by downstream quantitative PCR analysis. FEMS Microbiol Lett. 2012;329:193–7.
16. Carroll IM, Ringel-Kulka T, Siddle JP, Klaenhammer TR, Ringel Y. Characteri-zation of the fecal microbiota using high-throughput sequencing reveals a stable microbial community during storage. PLoS One. 2012;7:e46953. 17. Lauber CL, Zhou N, Gordon JI, Knight R, Fierer N. Effect of storage condi-tions on the assessment of bacterial community structure in soil and human-associated samples. FEMS Microbiol Lett. 2010;307:80–6. 18. Gadkar D, Filion M. Studying microbial gene expression in complex
environmental matrices using quantitative Real-Time Polymerase Chain Reaction. In: Filion M, editor. Quant Real-Time PCR Appl Microbiol. Nor-folk: Caister Academic Press; 2012. p. 163–80.
19. Farrah SR, Bitton G. Bacterial survival and association with sludge flocs during aerobic and anaerobic digestion of wastewater sludge under laboratory conditions. Appl Env Microbiol. 1983;45:174–81.
20. Merlino G, Rizzi A, Schievano A, Tenca A, Scaglia B, Oberti R, Adani F, Daf-fonchio D. Microbial community structure and dynamics in two-stage vs single-stage thermophilic anaerobic digestion of mixed swine slurry and market bio-waste. Water Res. 2013;47:1983–95.
21. Kearney TE, Larkin MJ, Levett PN. The effect of slurry storage and anaerobic digestion on survival of pathogenic bacteria. J Appl Bacteriol. 1993;74:86–93.
22. Smith SR, Lang NL, Cheung KH, Spanoudaki K. Factors controlling patho-gen destruction during anaerobic digestion of biowastes. Waste Manag. 2005;25:417–25.
23. LaPara TM, Nakatsu CH, Pantea LM, Alleman JE. Aerobic biological treatment of a pharmaceutical wastewater: effect of temperature on cod removal and bacterial community development. Water Res. 2001;35:4417–25.
24. Konopka A, Zakharova T, LaPara TM. Bacterial function and com-munity structure in reactors treating biopolymers and surfactants at mesophilic and thermophilic temperatures. J Ind Microbiol Biotechnol. 1999;23:127–32.
25. Baghchehsaraee B, Nakhla G, Karamanev D, Margaritis A, Reid G. The effect of heat pretreatment temperature on fermentative hydrogen production using mixed cultures. Int J Hydrog Energy. 2008;33:4064–73. 26. Nolvak H, Truu M, Truu J. Evaluation of quantitative real-time PCR
workflow modifications on 16S rRNA and tetA gene quantification in environmental samples. Sci Total Env. 2012;426:351–8.