RESEARCH
Transcriptome analysis of
Plasmodium
berghei
during exo-erythrocytic development
Reto Caldelari
1*, Sunil Dogga
2, Marc W. Schmid
3, Blandine Franke‑Fayard
4, Chris J. Janse
4,
Dominique Soldati‑Favre
2and Volker Heussler
1*Abstract
Background: The complex life cycle of malaria parasites requires well‑orchestrated stage specific gene expression. In the vertebrate host the parasites grow and multiply by schizogony in two different environments: within erythrocytes and within hepatocytes. Whereas erythrocytic parasites are well‑studied in this respect, relatively little is known about the exo‑erythrocytic stages.
Methods: In an attempt to fill this gap, genome wide RNA‑seq analyses of various exo‑erythrocytic stages of Plasmo-dium berghei including sporozoites, samples from a time‑course of liver stage development and detached cells were performed. These latter contain infectious merozoites and represent the final step in exo‑erythrocytic development.
Results: The analysis represents the complete transcriptome of the entire life cycle of P. berghei parasites with tempo‑ ral detailed analysis of the liver stage allowing comparison of gene expression across the progression of the life cycle. These RNA‑seq data from different developmental stages were used to cluster genes with similar expression profiles, in order to infer their functions. A comparison with published data from other parasite stages confirmed stage‑ specific gene expression and revealed numerous genes that are expressed differentially in blood and exo‑erythrocytic stages. One of the most exo‑erythrocytic stage‑specific genes was PBANKA_1003900, which has previously been annotated as a “gametocyte specific protein”. The promoter of this gene drove high GFP expression in exo‑erythrocytic stages, confirming its expression profile seen by RNA‑seq.
Conclusions: The comparative analysis of the genome wide mRNA expression profiles of erythrocytic and different exo‑erythrocytic stages could be used to improve the understanding of gene regulation in Plasmodium parasites and can be used to model exo‑erythrocytic stage metabolic networks toward the identification of differences in metabolic processes during schizogony in erythrocytes and hepatocytes.
Keywords: Malaria, Life cycle, Plasmodium liver stage, Transcriptome, RNA‑seq, Merosome
© The Author(s) 2019. This article is distributed under the terms of the Creative Commons Attribution 4.0 International License (http://creat iveco mmons .org/licen ses/by/4.0/), which permits unrestricted use, distribution, and reproduction in any medium, provided you give appropriate credit to the original author(s) and the source, provide a link to the Creative Commons license, and indicate if changes were made. The Creative Commons Public Domain Dedication waiver (http://creativecommons.org/ publicdomain/zero/1.0/) applies to the data made available in this article, unless otherwise stated.
Background
Malaria is a devastating disease caused by apicompl-exan parasites of the genus Plasmodium. Almost half of the world’s population is permanently at risk of malaria resulting in over 200 Million malaria cases worldwide mostly in African countries. There were more than 400,000 deaths in 2017 [1], and the majority of them were children under the age of five.
The life cycle of Plasmodium parasites involves the injection of sporozoites into the vertebrate host during a blood meal of an infected female mosquito. For the
rodent parasite Plasmodium berghei it has been shown
that a proportion of injected sporozoites actively invade blood vessels and then are passively transported to the liver [2]. After crossing the blood vessel endothelia in the liver to reach the parenchyma, the parasite trans-migrates through several hepatocytes before it set-tles in one. Upon entry into the ultimate host cell, the host plasma membrane invaginates forming a parasi-tophorous vacuole (PV) in which the parasite resides, develops and multiplies by exo-erythrocytic schizogony.
Open Access
*Correspondence: [email protected]; [email protected] 1 Institute of Cell Biology, University of Bern, Bern, Switzerland
The intracellular parasite extensively remodels the par-asitophorous vacuole membrane (PVM), in particu-lar by excluding or removing host cell proteins and by incorporating parasite proteins [3].
Each exo-erythrocytic stage parasite (EEF: exo-eryth-rocytic form) generates tens of thousands of nuclei by the process of exo-erythrocytic schizogony. This rapid nuclear division is accompanied by growth and replica-tion of organelles including the Golgi apparatus, endo-plasmic reticulum, mitochondrion and apicoplast and a vast expansion of the plasma membrane [4–6]. Nuclei and organelles are eventually segregated into individual merozoites. Once EEF merozoites have completed their development, the PVM ruptures. This process requires
an orchestrated action of multiple Plasmodium
pro-teins such as lipases (e.g. PbPL) [7], proteases (e.g. SUB1) [8, 9] and possibly perforins as shown for eryth-rocytic stage parasites (EF: erytheryth-rocytic form) [10–12]. Upon rupture of the PVM, EEF merozoites disperse in the host cell cytoplasm and the host cell actin cytoskel-eton collapses [13]. The final developmental stage of the EEF in in vitro cultures, is the formation of detached cells (DCs) and merosomes, host cell plasma membrane enclosed merozoites [14, 15]. In the in vivo mouse model, infected cells become excluded from the liver tissue upon PVM rupture and merosomes are formed and pushed into the lumen of adjacent blood vessels. At tissue sites with small capillaries, merosomes rup-ture to release merozoites into the blood [16]. Liberated merozoites immediately invade red blood cells (RBC), where they undergo repeated asexual reproduction cycles. In contrast to the tens of thousands merozoites generated by a single EEF, within erythrocytes the para-sites produce only a limited number (12 to 32) mero-zoites by erythrocytic schizogony. Another difference between erythrocytic and exo-erythrocytic schizogony is that after rupture of the PVM the EEF merozoites can reside in the host cell cytoplasm for up to several hours, whereas EF merozoites are liberated from the PVM and the host cell plasma membrane almost simultaneously [17]. Some EF will differentiate into male and female gametocytes. When these are ingested by a mosquito during a blood meal, they mature into macrogametes and microgametes and are liberated from the RBC. These sexual forms fuse to form zygotes and transform into motile ookinetes, which are able to cross the mid-gut epithelium of the mosquito to develop into oocysts, in which thousands of sporozoites are formed. After about 9–16 days (depending on the parasite species and the environmental temperature), sporozoites are lib-erated and invade the salivary glands of the mosquito (reviewed in [18]), whereupon they are then ready to be injected into a host during the next blood meal.
Studying the entire life cycle using human parasites under live or laboratory conditions is difficult due to ethical and safety reasons. However, the use of model organisms, such as the rodent malaria parasite P. berghei
is experimentally tractable and the genetic manipulation of this parasite is relatively easy and well established [19–
21]. This model allows investigating the EEF development and filling gaps of knowledge that might also be relevant
for human Plasmodium species. Many transcriptomic
studies have been undertaken for different Plasmodium
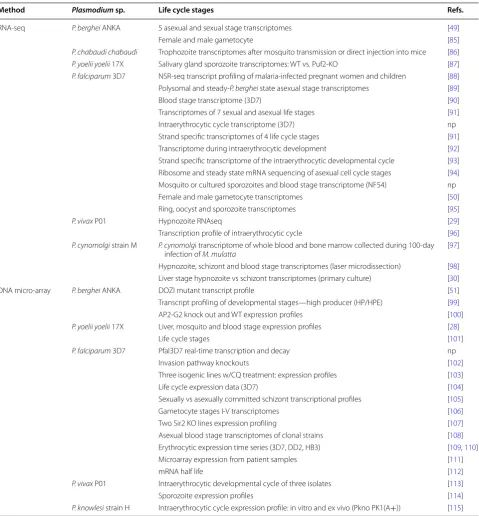
species, either by microarrays or RNA-seq. Table 1 lists the transcriptomic data integrated in PlasmoDB [22].
Recently, single cell transcriptomic profiles have also
been published for EF of Plasmodium falciparum,
Plas-modium knowlesi and P. berghei [23–25]. One of these studies (the Malaria Cell Atlas) also analysed the liver stage, but only a single time point (44hpi) [25]. Two fur-ther RNA-seq studies focused on the host cell transcrip-tome and did not attempt to group parasite genes in a systematic manner and did not include data from later stage EEFs (beyond 48hpi) [26, 27]. Three further
stud-ies analysed the transcriptome of Plasmodium EEFs,
one of which was done using the rodent parasite
Plas-modium yoelii [28] and the other two using Plasmodium vivax with an emphasis on the dormant parasite stage, the hypnozoite [29, 30]. Since P. berghei is a widely used model in malaria research and the so far published data for its EEF stages are incomplete, genome wide RNA-seq analyses of EEF development in a time course fashion were performed and expression data were compared to already published data of gene-expression of other life cycle stages of P. berghei. In particular, EEF merozoites originating from DCs/merosomes were compared to EF merozoites (from in vitro cultivated schizonts) and it was found that their transcription profiles differ substantially. Remarkably, differences were identified that are predicted to have an impact on metabolic processes during schiz-ogony in erythrocytes and hepatocytes despite the fact, that both types of merozoites infect RBC.
Methods
Mice, parasites, infections
BALB/c mice used for mosquito infections were between 6 and 10 weeks of age and were purchased from the Central animal facility at University of Bern, Harlan (Horst, the Netherlands) or Janvier Labs (Le Genest Saint Isle, France). For RNA work: mice were infected by intraperitoneal injection of blood
stabilates of marker-free P. berghei strain ANKA
expressing mCherry under the control of hsp70 regu-latory sequences (PbmCherryhsp70) [7]. At
treated mice (200 μl of 6 mg/ml in PBS, 2–3 days before). At day 3 to 4 after infection, each mouse with at least 7% parasitaemia was anaesthetized with Ket-asol/Xylasol and exposed to ~ 150 female Anopheles ste-phensi mosquitoes (which were sugar starved for 5 h). Mosquitoes were kept at 20.5 °C and 80% humidity.
From day 16–26 post infection salivary glands of infected mosquitos (sorted by fluorescence
stereomi-croscope Olympus SZX10/U-HGLGPS) were dissected
into serum free IMDM (Iscove’s Modified Dulbecco’s Medium, Sigma-Aldrich). Sporozoites were liberated from the glands and were used to infect confluent HeLa
Table 1 Genome wide transcriptome data from studies integrated in PlasmoDB release43; http://www.plasm odb.org (np: not published)
Method Plasmodium sp. Life cycle stages Refs.
RNA‑seq P. berghei ANKA 5 asexual and sexual stage transcriptomes [49]
Female and male gametocyte [85]
P. chabaudi chabaudi Trophozoite transcriptomes after mosquito transmission or direct injection into mice [86] P. yoelii yoelii 17X Salivary gland sporozoite transcriptomes: WT vs. Puf2‑KO [87] P. falciparum 3D7 NSR‑seq transcript profiling of malaria‑infected pregnant women and children [88] Polysomal and steady‑P. berghei state asexual stage transcriptomes [89]
Blood stage transcriptome (3D7) [90]
Transcriptomes of 7 sexual and asexual life stages [91]
Intraerythrocytic cycle transcriptome (3D7) np
Strand specific transcriptomes of 4 life cycle stages [91]
Transcriptome during intraerythrocytic development [92]
Strand specific transcriptome of the intraerythrocytic developmental cycle [93] Ribosome and steady state mRNA sequencing of asexual cell cycle stages [94] Mosquito or cultured sporozoites and blood stage transcriptome (NF54) np
Female and male gametocyte transcriptomes [50]
Ring, oocyst and sporozoite transcriptomes [95]
P. vivax P01 Hypnozoite RNAseq [29]
Transcription profile of intraerythrocytic cycle [96]
P. cynomolgi strain M P. cynomolgi transcriptome of whole blood and bone marrow collected during 100‑day
infection of M. mulatta [97]
Hypnozoite, schizont and blood stage transcriptomes (laser microdissection) [98] Liver stage hypnozoite vs schizont transcriptomes (primary culture) [30]
DNA micro‑array P. berghei ANKA DOZI mutant transcript profile [51]
Transcript profiling of developmental stages—high producer (HP/HPE) [99]
AP2‑G2 knock out and WT expression profiles [100]
P. yoelii yoelii 17X Liver, mosquito and blood stage expression profiles [28]
Life cycle stages [101]
P. falciparum 3D7 Pfal3D7 real‑time transcription and decay np
Invasion pathway knockouts [102]
Three isogenic lines w/CQ treatment: expression profiles [103]
Life cycle expression data (3D7) [104]
Sexually vs asexually committed schizont transcriptional profiles [105]
Gametocyte stages I‑V transcriptomes [106]
Two Sir2 KO lines expression profiling [107]
Asexual blood stage transcriptomes of clonal strains [108]
Erythrocytic expression time series (3D7, DD2, HB3) [109, 110]
Microarray expression from patient samples [111]
mRNA half life [112]
P. vivax P01 Intraerythrocytic developmental cycle of three isolates [113]
Sporozoite expression profiles [114]
[image:3.595.59.539.110.627.2]cells (per time point 10 wells of 96 well plates were seeded with 40,000 cells/well the day before). Each well was infected with ~ 20,000 PbmCherryhsp70 sporozoites
for 6 h. The cells were detached with accutase (Inno-vative Cell Technology), pooled and the equivalent of 10 wells were seeded in 25 cm2 cell culture flask. 1/6th
of the cells was washed once with PBS and pelleted by centrifugation (2 min 100 g). The pellet was loosened by flicking and the cells were resuspended with 250 μl of RNAlater and stored at 4 °C till all time points were harvested. It has been reported that RFP in contrast to GFP is preserved in RNAlater treated cells [31].
Media of the cultured cells were changed at 24 hpi and 48 hpi. At the respective time points the cells were detached from the surface with accutase, washed once with PBS and then resuspended in 250 μl RNAlater and stored at 4 °C. The use of RNAlater shortened the para-site’s time in an unnatural state not being in the incubator in adequate environment and medium down to 10 min compared to 1–2 h in case of sorting fresh cells.
To generate transgenic parasites expressing gfp
under control of the promoter of PBANKA_1003900
(PBANKA_1003900GFP), an episomal PbGFPcon
vec-tor was used [32]. First, the PBANKA_1003900
pro-moter (1.7 kb) was amplified using primers GCT CTA CCA ATT TTG TGT CAC and GGA TCC TTA AAA ATT AAT TTT GTA TAA AAT CG and cloned into a
pCR2.1-TOPO vector (Invitrogen) and sequenced. Then the P.
berghei elongation factor-1α promoter of PbGFPcon was
exchanged for the PBANKA_1003900 promoter (EcoRV
from pCR2.1-TOPO vector/BamHI) and the gfp gene
was re-introduced in the correct orientation as a BamHI fragment. Finally the construct (Additional file 2: Fig. S1) was used to transfect the reference wild type P. berghei
ANKA parasite line (cl15cy1 (ANKAwt)) [19] to
gener-ate line 300 (PBANKA_1003900GFP). Transfection with
the episomal construct and positive selection of trans-fected parasites with pyrimethamine was performed as described previously [19].
For Microscopy work: confluent HeLa cells in 96-well plate (40,000 cells seeded the day before) were infected
with ~ 20,000 PBANKA_1003900GFP sporozoites. Cells
were washed and detached 2 h post-infection using accutase and seeded on glass covers in 24 wells. At the indicated time points cells were fixed with 4% PFA in PBS for 10 min, washed with PBS and kept at 4 °C. Nuclei were stained with 1 μM Hoechst 33342 for 20 min, embedded with Dako-mounting medium. Fluorescent microscopy pictures were taken on a Leica DM5500B. Signals were photographed using same exposure settings.
For live cell imaging, infected cells were seeded onto glass bottom dishes (35-20-1.5-N, Cellvis, Mountain View). Live cell microscopy was performed with a Leica
DMI6000B epifluorescence microscope equipped with a SOLA-SE-II light source starting at 30hpi.
FACS sorting
Cells kept in RNAlater were FACS sorted on a BD FAC-SARIA III, FACSflow was used as sheath fluid. A 561 nm laser was used in combination of 610/20 nm filter detect the infected cells (see Additional file 2: Fig. S2). To obtain maximal purity the sorting was performed using the 4-way-purity mode with 100 microns nozzle. The sorted cells were collected into RNAlater (500 μl in Eppedorf tube). 100,000 non-infected cells at each time point were sorted as negative controls.
RNA isolation, library preparation, sequencing
Prior to isolation of RNA by ReliaPrep™ RNA Cell Mini-prep System RNAlater was removed from the cells by adding an equal volume of ddH2O to the cells. The cells
were then centrifuged (200 g, 2 min). The RNA from the pelleted cells was extracted according to the manufac-turer’s protocol and kept at − 80 °C. RNA extraction and Illumina m RNA-sequencing were performed in dupli-cates. Following RNA isolation, total RNA was quantified with a Qubit Fluorometer (Life Technologies). Quality of the extracted RNA was checked by the RNA integrity number (RIN), measured using an Agilent 2100
BioAna-lyser (Agilent Technologies). The SMARTer™ Ultra Low
RNA kit from Clontech was used for the reverse tran-scription and cDNA amplification according to manu-facturer’s specifications, starting with 10 ng of total RNA as input. The Nextera XT kit (Illumina, San Diego, CA, USA) was used for cDNA libraries preparation using 200 pg of cDNA. Library molarity and quality was assessed with the Qubit and Tapestation using a DNA High sensitivity chip (Agilent Technologies). The cDNA libraries were pooled and loaded at 12.5 pM, multiplexed on 4 lanes of HiSeq Rapid PE v2 Flow cells for generat-ing paired reads of 100 bases on an Illumina HiSeq 2500 sequencer (Illumina, San Diego, CA, USA).
Data processing
Short reads generated in this study were deposited at the
European Nucleotide Archive “(http://www.ebi.ac.uk/
ena/) and are accessible through the accession
in this study, Nextera transposase sequences and low quality reads were removed with Trimmomatic (version 0.33 with the parameters ILLUMINACLIP:adapters/ NexteraPE-PE.fa:2:30:10 LEADING:3 TRAILING:3
SLIDINGWINDOW:5:30 MINLEN:50 [33]. Low
com-plexity reads were removed with fqtrim (version 0.9.4) [34]. For paired-end reads, if only one end was removed, the remaining read end was treated as single-end read. To remove potential contamination with host RNA, all reads were aligned to the human genome (ensembl82) with Bowtie2 (version, 2.2.5) [35]. Single-end reads and read pairs with none of the ends aligning to the human
genome were kept and aligned to the P. berghei ANKA
reference genome (PlasmoDB Release 33) with Subread (i.e. subjunc, version 1.4.6-p5) [36] allowing up to 10 alignments per read (options: -n 20 -m 5 -B 10 -H –all Junctions, always in single-end mode, i.e., ignoring the reverse read-end of paired-end reads). Count tables were generated with Rcount [37] with an allocation distance of 100 bp for calculating the weights of the reads with mul-tiple alignments and a minimal number of 5 hits. Count tables are available in Additional file 1: Table S2. Multi-reads were included to avoid underestimation of expres-sion of genes with similar sequences (see for example [38,
39]). To ensure that each multiread contributes only once to the final expression values, alignments of multireads were weighted according to the number of unique read alignments within 100 bp of a multiread alignment site (for details, see [37]).
Differential expression
Variation in gene expression was analysed with a gen-eral linear model in R with the package DESeq 2 (ver-sion 1.16.1) [40] according to a design with a single factor comprising all different experimental groups. Specific groups were compared with linear contrasts and P-values were adjusted for multiple testing [41], (i.e., false discov-ery rate). Genes with an adjusted P value (FDR) below 0.01 and a minimal logFC of 2 were considered to be dif-ferentially expressed. Normalized gene expression data for plotting and clustering was likewise obtained with DESeq 2 (version 1.16.1) [40].
Gene co‑expression network
To identify groups of genes with similar expression patterns across the life cycle of P. berghei, a gene co-expression network (GCN) was constructed. Therefore an adjacency matrix with pairwise Pearson correlation coefficients was calculated, Fisher’s z-transformation was applied and each pairwise correlation coefficient for being significantly bigger than zero was tested (as described in [42]). P-values were adjusted for multiple testing [41] and correlation coefficients with an adjusted
P-value below 0.001 were identified as significant. The significant pairwise correlation coefficients were then used to construct the GCN. To resolve the community structure of the GCN, a modularity optimization algo-rithm [43] implemented by the function “cluster_louvain” in the R package “igraph” (version 1.0.1) was used [44]. Communities with less than 11 genes were collapsed into a single “mixed” community (70 communities with a total of 197 genes). The network was visualized with Cytoscape (version 3.5.1, “prefuse force directed layout”) [45]. The GeneIDs per community are listed in Additional file 1: Table S4. It should be considered that the GCN analysis was partly based on already published data and for that reason could not be corrected for possible batch effects. The focus of the current study was the liver stage includ-ing the sporozoite stage and detached cells as a final point of liver stage development.
Gene ontology enrichment
To functionally characterize the network communities or genes found to be differentially expressed, enrichment of gene ontology (GO) terms was tested with topGO (ver-sion 3.4.1) [46] in conjunction with the GO annotation
available from PlasmoDB [22]. Analysis was based on
gene counts (genes in the set of interest compared to all annotated genes) using the “weight” algorithm with Fish-er’s exact test (both implemented in topGO). A term was identified as significant if the P-value was below 0.05.
Enrichment of selected gene groups
To test for enrichment of a specific group of genes (e.g., “merozoite invasion genes” from [47]) within a gene set of interest compared to all genes annotated with any of the tested groups, we used Fisher’s exact test (two-by-two contingency table). P-values were adjusted for multiple testing [41] and groups with an adjusted P-value (FDR) below 0.05 were identified as significant.
Results and discussion
High fidelity exo‑erythrocytic stage RNA‑seq data and sample selection criteria
day 20 post feeding. For each sample, independent bio-logical duplicates were collected. Following the isolation of total RNAs from infected HeLa cells and from infected salivary glands, libraries were sequenced with an Illu-mina HiSeq 2500 resulting in 34 to 61 million paired-end reads per sample (Additional file 1: Table S1). After removal of low quality sequences, sequencing adapt-ers and sequences arising from host RNA, reads were aligned to the P. berghei ANKA reference genome, result-ing in around 0.23 to 21.4 million weighted alignments (hits) within genic regions (Additional file 1: Table S1, raw counts are provided in Table S2). Samples collected 6 h after infection were excluded from further analysis as only low amounts of hits were recovered (22,154 and 35,312 hits) in both biological replicates. The reason is most likely that, at this time-point of infection, parasite transcripts represent only a small fraction compared to host cell transcripts.
4475 transcribed genes were identified (≥ 80
nor-malized read counts, corresponding on average to 20 RPKMs in at least one developmental stage of the EEF).
In a previously reported transcriptome analysis of P.
yoelii EEF stages using microarrays, about 2000 genes were detected [28]. This exemplifies the higher sensi-tivity of the Next Generation Sequencing (NGS) com-pared to array technology [39].
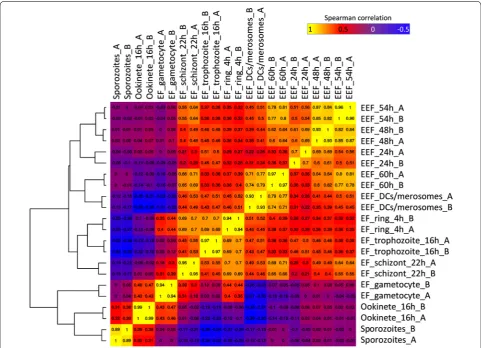
A hierarchical clustering of the different EEF sam-ples was performed together with RNA-seq data of EF (rings, trophozoites and schizonts harvested 4, 16 and 22 h after infection of RBC), as well as with RNA-seq data of gametocytes and ookinetes [49]. The replicates exhibited a high Spearman’s correlation to each other and the different stages grouped well according to the host environment (exo-erythrocytic, erythrocytic) (Fig. 1).
[image:6.595.57.539.326.674.2]The analysis revealed that the transcripts profiles of the extracellular ookinetes and sporozoites cluster together, which might be due to the fact, that both are motile stages that traverse mosquito host cells. Ooki-netes and sporozoites are, however, markedly different from the profiles of EEF and asexual EF stages. Nota-bly, the expression profile of gametocytes is different from both EEF and asexual EF stages but shows simi-larities to the ookinetes. This is not surprising as in the
Plasmodium life cycle gametocytes differentiate into ookinetes (via gamete and zygote stages). In female gametocytes various mRNAs are already produced but translationally repressed and only used during
develop-ment of the zygote and ookinete [50–52]. Among the
EEF stages, the highest similarities of gene expression profiles were observed as expected for adjacent stages/ timepoints (e.g., 48 h and 54 h). However, the early stages/timepoints (24 h, 48 h and 54 h) were fairly dis-tinct from the later time-points (60 h and detached cells). The asexual EF stages showed a high degree of similarity among them. In fact, the gene expression profile of detached cells, containing the EEF merozo-ites, was rather distinct from the profile of late stage EF schizonts, containing EF merozoites, although both need to be prepared to invade RBC. It is noteworthy that proteomics data of P. yoelii, revealed that 90% of the proteins of late EEF were also detected in the early EF [28].
To verify the RNA-seq data, the expression pattern of selected genes was compared to previously reported pat-terns. The expression pattern of the housekeeping pro-teins (GAPDH, actin 1 and alpha-tubulin 1; Additional file 2: Fig. S3), putative proteases (SERA 1 to 5; Addi-tional file 2: Fig. S4), PVM proteins (EXP1, Exp2, UIS3 and UIS4; Additional file 2: Fig. S5), sporozoite surface proteins (CSP and TRAP; Additional file 2: Fig. S6), fatty acid biosynthesis enzymes (FabB/F, FabI, FabZ and FabG, Additional file 2: Fig. S7) as well as merozoite surface proteins (MSP 1, 4/5, 7, 8, 9, 10; Additional file 2: Fig. S8) were very similar to the already published data con-firming the quality of the here presented RNA-seq data. Further information about the selected genes presented in Additional file 2: Figs. S3 to S8 is detailed in the sup-plementary information section.
Importantly, the expression profiles deduced from the RNA-seq analysis provide valuable information for the choice of promoters to drive expression of stage-specific transgenes, such as fluorescent or luminescent reporter proteins. Previously, the promoters of the housekeeping genes heat shock protein (hsp70) and eukaryotic elonga-tion factor 1α (eef1α) have been used to drive expression of fluorescent reporters [7, 32, 53]. According to the here presented RNA-seq analysis, the hsp70 promoter is a bet-ter choice for driving constitutive expression of reporbet-ters as hsp70 mRNA exhibits a more uniform expression pro-file compared to eef1α mRNA (Additional file 2: Fig. S9).
Next, a more detailed computational analysis of the exo-erythrocytic stage transcriptome and a comparison with other developmental stages was performed.
Gene co‑expression network
To further explore the complexity of the parasite tran-scriptome, in particular the gene expression similari-ties among the different developmental stages, a gene
co-expression network (GCN) was computed [42] and
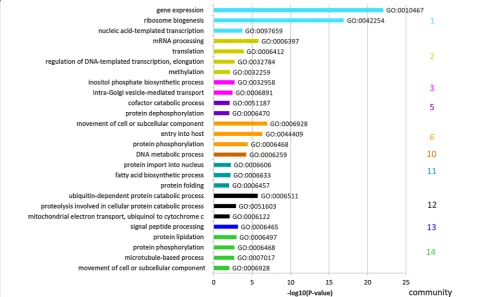
genes with similar expression patterns (“communities”) [43] were extracted and visualized (Fig. 2). This analysis allowed to gain insight into the sets of similarly expressed genes in the different EEF and EF stages and into char-acteristic expression patterns within the entire tran-scriptome. These analyses were used to find functionally related genes based on similar expression patterns.
The GCN analysis revealed 14 different communi-ties comprised of 11 to 818 genes and a “mixed” com-munity with 197 genes (a pool of communities with 10 or less genes per community) (Fig. 2, Additional file 1: Table S4). Of a total of 5104 genes, 4675 genes are rep-resented in the GCN. 429 genes did not meet the GCN criteria, as the expression pattern of each of them did not significantly correlate to the expression pattern of another gene throughout all stages. Interestingly, the GCN analysis indicated marked differences between EEF and EF. Unexpectedly, even the transcriptome of EEF-derived and EF-derived merozoites (i.e., detached cells and late blood schizonts) were found to differ sub-stantially. The 486 transcribed genes of community 1 were strongly expressed in DCs/merosomes, which con-tain EEF-derived merozoites and extended into the ring
Fig. 2 Gene co‑expression network based on RNA‑seq data of samples of different life cycle stages. Stages are sporozoites, exo‑erythrocytic (EEF) stages (DCs/merosomes correspond to detached cells and merosomes), erythrocytic (EF) stages (rings, trophozoites, schizonts, gametocytes) and ookinetes. Each node represents a gene and each edge depicts a significant pairwise correlation. The network was visualized with Cytoscape [45] using the “prefuse force directed layout”. Nodes/genes are colored according to their membership in 14 communities and a ‘mixed’ (M) community (pool of communities with less than 11 genes per community), identified with a modularity optimization algorithm [43]. For each community, a heatmap summarizes the expression patterns of all genes within the community. Expression values in the heatmaps correspond to gene‑wise Z‑scored of normalized and log2(x + 1)‑transformed count data averaged across the replicates
stage (initial phase of EF development). The 596 tran-scribed genes of community 2 were as well enriched in DCs/merosomes, but expression of these genes persisted longer during the EF (into trophozoite and partly into schizont stage) whereas their expression was strongly reduced in the sporozoites. To functionally characterize the communities defined in the GCN, a gene ontology (GO) term enrichment analysis from the domain “Biolog-ical Process (BP)” was performed (Fig. 3, Additional file 1: Table S3).
The first two communities in Fig. 2 contain genes that are expressed specifically in DCs/merosomes and EF stages. The majority of the corresponding gene prod-ucts were predicted to be involved in gene expression, ribosome biogenesis and transcription (Community 1), or in mRNA processing and translation (Community 2) (Fig. 3). All these functions are involved in DNA/RNA biology, particularly in gene expression and regulation. This is not surprising as invasive forms like the merozo-ites in DCs/merosomes prepare for the next growth phase after invasion and most likely need stored transcripts for a rapid protein synthesis after invasion of erythrocytes, comparable to the storage of repressed transcripts in
mature gametocytes and sporozoites [50–52, 54–58]. On the other hand, the 160 genes of community 3 were highly specific to the EF stages (Fig. 3). Conspicuously, this community has almost no GO-term annotations for biological processes (only 3 out of 160 genes were anno-tated). However, this community was highly enriched for small nucleolar RNAs (snoRNAs), PIR pseudogenes (Plasmodium interspersed repeat pseudo genes) and genes of the three large multigene families in rodent parasites, coding for PIR proteins, fam-a proteins and fam-b proteins. SnoRNAs are important components of ribosome biogenesis that consist in non-coding RNAs with a diversity of function like pseudo-uridylation and
2′-O-methylation of RNAs or synthesis of telomeric
DNA [59]. PIR, fam-a and fam-b proteins are exported
by EF stages into the cytoplasm of the host erythrocyte. Recently it has been shown that a subset of PIR, fam-a and fam-b proteins are also expressed in EEF stages [60], however the function of most of these proteins remains unknown.
Community 6, consisting of 776 genes, was enriched for genes expressed in sporozoites, but also frequently expressed at elevated levels in gametocytes, ookinetes
[image:9.595.57.537.391.688.2]and schizonts. Not surprisingly, genes preferentially expressed in community 6 were involved in host cell entry, host cell exit and parasite motility (Fig. 3). In addition, genes that are involved in transport of subcel-lular components and DNA repair were present. Genes whose expression was found to be more specific to sporo-zoites, with persisting expression during the early EEF stages, but almost complete absence in DCs/merosomes (community 5), were involved in DNA synthesis and metabolic processes, consistent with the high multipli-cation observed following hepatocyte invasion by the sporozoites (Fig. 3).
Communities 7, 8 and 9 contain 45 genes in total, the expression of which were mostly specific to the devel-oping EEF stages. According to guidelines of the Broad Institute on GeneSetEnrichmentAnalysis, small size communities should not be interpreted.
The expression of the 31 genes of community 10 was enriched in EF schizonts and in gametocytes, but these genes were also found well expressed in late EEF stages. Although the GO term ‘DNA metabolic process’ is listed for this community, it should be assessed with caution due to the reason mentioned above.
The 176 genes of community 11 were expressed dur-ing the developdur-ing EEF and EF stages, with a slight bias towards the developing EEF stages (85% of all genes in the community were on average expressed at a higher level in the EEF stages). In this community, 3 out of 9 genes coding for enzymes of fatty acid biosynthesis have been identified as hits. This is in agreement with the high fatty acid usage of EEF stages to generate various parasite membranes [61]. Apart from genes involved in fatty acid biosynthesis, it is very likely that genes identified in this community are involved in schizogony and merozoite development in both EEF and EF stages.
The remaining communities were mostly defined by genes with almost complete absence of expression in sporozoites (community 12; 499 genes), in sporozoites and DCs/merosomes (community 13; 480 genes) or in sporozoites, 24 h EEF stage and partly DCs/merosomes (community 14; 818 genes). However, whereas genes of community 12 and 13 were generally expressed through-out the EEF and the EF stages, genes of community 14 were more specific to gametocytes and ookinetes (Fig. 2). Sporozoites are not growing or proliferating and there-fore it can be expected that in sporozoites, expression of genes involved in several metabolic processes, protein lipidation, phosphorylation and signal peptide processing is less pronounced than in other stages.
Altogether, the GCN analysis allowed to identify 14 clearly defined communities and a pool of small commu-nities (mix) with totally 4675 genes attributed (see Addi-tional file 1: Table S4 for GeneIDs of the members of the
communities and for genes excluded during the GCN analysis).
The generated GCN provides a first comprehensive
overview of gene regulation in a Plasmodium parasite
throughout EEF and EF development including several life cycle stages in the mosquito vector (ookinetes, sporo-zoites). The identification of clear communities of genes with comparable expression profiles may help identifying common signatures in the untranslated promotor regions that may be involved in regulation of gene expression.
Differences in gene expression between developing exo‑erythrocytic and erythrocytic parasites
To better elucidate the differences between EEF and EF stage parasites, differential expression analyses were con-ducted. A limitation of this approach was that blood stage gene transcription was based on already published data, which cannot be corrected for batch effects or contami-nations with sexual stage parasites. Known confounders are the contamination of the 4 h EF ring stage with about 3% mature gametocytes and the 22 h EF schizont cultures with about 10% immature gametocytes [49]. In addition, the transition between ring forms and young trophozo-ites is not exactly defined by morphological or molecular means. Apart from these reasonable limitations, a com-parison of the highly enriched and homogeneous stages during blood and liver stages revealed very interesting differences.
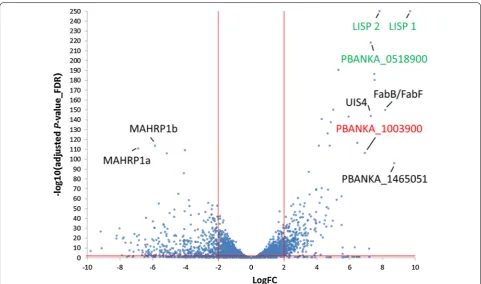
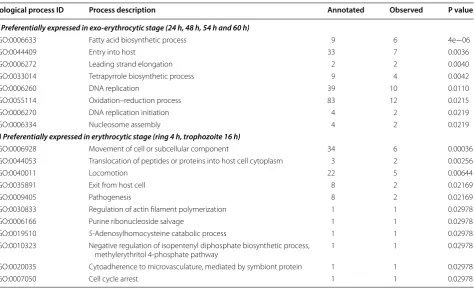
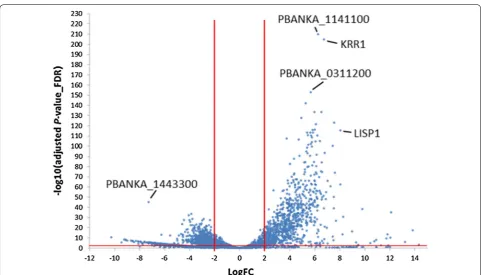
In order to compare EF and EEF parasites, averaged gene expression of developing EEF stages (24 h, 48 h, 54 h and 60 h) and of developing EF stages (ring 4 h, tropho-zoite 16 h) was compared, despite that such an averaging bears a potential bias towards earlier or late stages. In this comparison, 299 genes were significantly upregulated in the EEF stages (LogFC ≥ 2, adjP ≤ 0.01) and 392 genes were significantly upregulated in the EF stages (Fig. 4; Additional file 1: Table S5). GO-term enrichment (sum-marized in Table 2) revealed that genes preferentially expressed in the EEF stages were enriched for the fatty acid biosynthesis pathway (e.g. fabB/fabF in Fig. 4), entry into the host cell, leading strand elongation, tetrapyr-rol biosynthesis and DNA replication. Considering that
a single P. berghei EEF parasite generates more than
of gene expression related to translocation of proteins (e.g. membrane associated histidine-rich protein 1: mah-rp1a and b in Fig. 4) across the PVM is also required for parasite remodeling of the host RBC [65], including pro-teins transported to the surface of the RBC involved in RBC sequestration [65–67]. Many P. berghei proteins are known to be transported into the host red blood cell [60,
67] whereas only a few proteins have been identified to be exported into the host hepatocyte, for example, CSP [68, 69] and LISP2 [70].
Exo‑erythrocytic and erythrocytic merozoites: same but different
In contrast to the limited differences in gene expres-sion observed during parasite development in hepato-cytes and RBC, the differences between first generation merozoites generated at the end of the liver stage and subsequent generation merozoites generated during the repeated rounds of blood stage development, were much more pronounced (i.e. see communities 1, 2, 4, 5, 10, 13 in Fig. 2) even though the 22 h EF schizont sample was not entirely pure but also contained some immature schizonts and immature gametocytes as stated in the
corresponding publication [49]. Still, 880 and 1275 genes were preferentially expressed in DC s/merosomes and in 22 h schizonts, respectively (Fig. 5 and Additional file 1: Table S6). GO-term enrichment analysis (Table 3) indi-cated clear differences between these sets. Genes pref-erentially expressed in first generation merozoites (DCs/ merosomes) were found enriched for the GO-terms: gene expression, ribosome biogenesis, amide biosynthetic pro-cess, RNA biosynthetic process and mRNA splicing. In contrast, genes preferentially expressed in subsequent generation merozoites (22 h EF schizonts) were enriched for the GO-terms: small GTPase-mediated signal trans-duction, DNA replication and recombination, protein localization and modification, and signal peptide pro-cessing. At first glance, it is rather surprising that mero-zoites derived from EEF and EF stage differ so markedly. However, it might reflect the fact that the mechanism of egress from their respective host cells differ markedly. EF stage-derived merozoites almost simultaneously rupture
the PVM and the plasma membrane of the RBC [17]. On
the other hand, EEF stage-derived merozoites are initially freed from the PVM but can then stay for several hours in the host cell until they are extruded inside merosomes Fig. 4 Volcano plot of differently expressed genes of developing exo‑erythrocytic (EEF) stages (EEF_24 h–60 h) compared to developing
[image:11.595.57.539.86.370.2]into a blood vessel [7, 14] and are eventually released from merosomes in the fine capillaries of the lungs [16]. Also, DCs/merosomes do not form entirely synchro-nously. In vitro generation of detached cells starts as early as 54 h, peaks at 65 h but continues until 69 h and even later. Since for the current study DCs/merosomes were collected at 69 h to increase the yield, some merozoites might be at different developmental and activation stages and thus might express different sets of genes. However, the vast majority of 22 h EF schizonts and 69 h DCs/ merosomes contain fully matured and infectious merozo-ites and thus are certainly the best defined stages to com-pare between blood and liver stages. The next section focuses in more detail on genes involved in the egress of EEF derived merozoites in comparison to EF stage-derived merozoites.
Comparison of mRNA expression patterns at the end of exo‑erythrocytic and erythrocytic stage development Given that EF merozoites egress within minutes upon PVM rupture, whereas EEF merozoites remain in the hepatocyte cytoplasm for up to several hours, genes were searched that might be (i) necessary for the rapid egress specifically from RBC, (ii) required for survival in the hepatocyte cytoplasm and (iii) specific for both
developmental stages (i.e. necessary for PVM rup-ture in RBC and hepatocytes). Interestingly, 74 genes were upregulated in 22 h EF schizonts in comparison to EEF samples (LogFC ≥ 2, adjP ≤ 0.01, Additional file 1: Table S7), but only four of these were upregulated when compared to all other stages (Additional file 1: Table S8). These four genes code for the following proteins: (i) the high mobility group protein B1 (PBANKA_0601900) of
which the orthologue in P. falciparum has been shown
to potently activate pro-inflammatory cytokines, sug-gesting a role in triggering host inflammatory immune responses [71]; (ii) a protein of the PIR multigene family (PBANKA_0500781); the function of PIRs is not known but these proteins are believed to be involved in antigenic variation and evasion from host immune responses [72]; (iii) a conserved Plasmodium protein of unknown func-tion (PBANKA_0915200); (iv) MSP9 (Merozoite surface protein 9, PBANKA_1443300). The orthologue of MSP9 in P. falciparum has been shown to bind to erythrocyte
band 3 protein and to form a complex with MSP1 [73,
74]. Plasmodium falciparum merozoites are able to infect RBC via two different invasion mechanisms: one is sialic acid-dependent, involving MSP9 and the other one is MSP9 and sialic acid-independent. Interestingly msp9 is barely transcribed in DCs/merosomes and also hardly in
Table 2 Gene ontology (GO) term annotation of genes preferentially expressed in (i) EEF stages and (ii) asexual EF stages
The number of annotated genes (number genes per GO term present in the entire RNA-seq study) and observed genes (number of genes per GO term preferentially expressed in…) per Biological Process are listed. Only GO terms with P-values < 0.05 are shown
Biological process ID Process description Annotated Observed P value
(i) Preferentially expressed in exo-erythrocytic stage (24 h, 48 h, 54 h and 60 h)
GO:0006633 Fatty acid biosynthetic process 9 6 4e−06
GO:0044409 Entry into host 33 7 0.0036
GO:0006272 Leading strand elongation 2 2 0.0040
GO:0033014 Tetrapyrrole biosynthetic process 9 4 0.0042
GO:0006260 DNA replication 39 10 0.0110
GO:0055114 Oxidation–reduction process 83 12 0.0215
GO:0006270 DNA replication initiation 4 2 0.0219
GO:0006334 Nucleosome assembly 4 2 0.0219
(ii) Preferentially expressed in erythrocytic stage (ring 4 h, trophozoite 16 h)
GO:0006928 Movement of cell or subcellular component 34 6 0.00036
GO:0044053 Translocation of peptides or proteins into host cell cytoplasm 3 2 0.00256
GO:0040011 Locomotion 22 5 0.00644
GO:0035891 Exit from host cell 8 2 0.02169
GO:0009405 Pathogenesis 8 2 0.02169
GO:0030833 Regulation of actin filament polymerization 1 1 0.02978
GO:0006166 Purine ribonucleoside salvage 1 1 0.02978
GO:0019510 S‑Adenosylhomocysteine catabolic process 1 1 0.02978
GO:0010323 Negative regulation of isopentenyl diphosphate biosynthetic process,
methylerythritol 4‑phosphate pathway 1 1 0.02978
GO:0020035 Cytoadherence to microvasculature, mediated by symbiont protein 1 1 0.02978
[image:12.595.64.539.99.388.2]other developmental EEF stages, which might be indica-tive that EEF stage-derived merozoites do not invade in the sialic acid-dependent manner. Attempts to knock out P. berghei MSP9 were not successful [75]. In P. yoelii, MSP9 has been found in the erythrocyte cytoplasm [76] and might, in addition to invasion, also be involved in egress of merozoites from RBC.
Thereafter, 293 genes were identified that are spe-cifically upregulated in DCs/merosomes when com-pared to all other stages (Additional file 1: Table S9). It is conceivable that most of them are involved in the EEF stage-specific egress, in parasite survival in the dying host hepatocyte or in early RBC remodeling. As dis-cussed earlier, it is plausible that transcripts are transla-tionally suppressed in merozoites until the next stage in the life cycle, like has been described for mature
game-tocytes and sporozoites [51, 77]. Among the highly
upregulated transcripts, sbp1 (skeleton binding
pro-tein 1) (PBANKA_1101300), mahrp1a and mahrp1b
(PBANKA_1145800 and PBANKA_1145900) were iden-tified. These gene products are all involved in the traf-ficking of exported proteins from the parasite to the
surface of the RBC [65]. Knock out of MAHRP1a or
SBP1 reduced the sequestration of infected cells [65]. It is plausible that EEF stage-derived merozoites express high
levels of these mRNAs in order to sufficiently express these proteins immediately after infection of RBC. Plau-sibly, this may allow the infected RBC to be efficiently sequestered in the periphery to avoid immediate clear-ance by the spleen. Why expression of sbp1 and mahrp1a
and mahrp1b appears to be lower in EF stage merozoites than in EEF stage merozoites is unknown. One reason might be, that in course of EF stage infection, the spleen is heavily remodeled [78–80] and allows for passage of infected RBC, making an efficient sequestration and thus a pronounced expression of sequestration ligands on the surface of the infected RBC less necessary [65]. The para-site might thus be less dependent on intense trafficking of sequestration ligands. Another reason might be that
mahrp1a and sbp1 are already expressed during ring and trophozoite stage and thus less transcript would be needed to fulfill the same function as in EEF.
Genes predominantly expressed in exo‑erythrocytic stages One of the goals of this study was to identify EEF stage-specific expressed genes. The EEF data were therefore compared with data from all other stages. The com-parison revealed 5 highly specifically expressed tran-scripts for EEF stages with a LogFC > 6 and adjP < 0.01 (Fig. 6). The genes lisp1 (PBANKA_1024600) and lisp2
[image:13.595.57.539.84.359.2](PBANKA_1003000) have been previously reported to be expressed exclusively during EEF stage develop-ment [80–82]. This is clearly reflected by the here
pre-sented RNA-seq analysis where substantial lisp1 and
lisp2 mRNA levels were only found in EEF stages, from 24 hpi to DCs/merosomes. Along with lisp1 and lisp2
two conserved Plasmodium genes (PBANKA_0518900
and PBANKA_0519500) were identified, one of which is annotated as membrane protein, although there is no transmembrane domain other than the signal peptide (PBANKA_0518900). The fifth gene in this EEF-specific group of genes is PBANKA_1003900. An averaged logFC of PBANKA_1003900 from later stages compared to non-EEF stages was similarly high as for lisp2 and lisp1
(Table 4).
PBANKA_1003900 is a syntenic ortholog of P.
falci-parum sexual stage-specific protein precursor (Pfs16; PF3D7_0406200) which is expressed early during
devel-opment of P. falciparum gametocytes [83].
Plasmo-dium berghei parasites expressing an mCherry-tagged PBANKA_1003900 provided experimental evidence that this gene is also expressed in gametocytes and was, there-fore, annotated as a gametocyte specific protein [84].
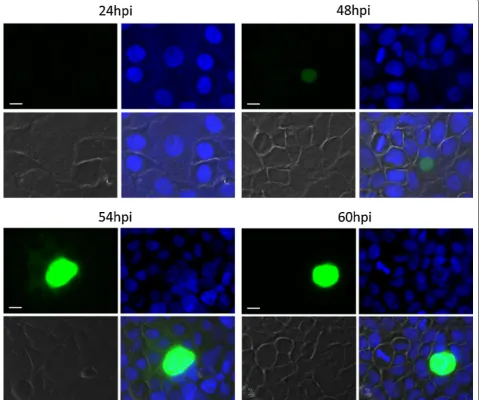
However, substantial PBANKA_1003900 transcript levels were only detected in EEF stages. A transgenic parasite line expressing GFP under the control of the promoter
of PBANKA_1003900 (PBANKA_1003900GFP) was
[image:14.595.63.537.111.410.2]gen-erated and analysed for GFP expression by fluorescence microscopy in the different EEF and EF stages. GFP was not detectable in any of the EF stages, including game-tocytes. In contrast, GFP expression was detected by fluorescence microscopy of infected HeLa cells fixed at different time points (Fig. 7; 24 h, 48 h, 54 h, 60 h). At 24 h of EEF stage development no or only very weak GFP-fluorescence was detectable. At 48 h of EEF stage development, the signal was readily visible and at 54 h and 60 h post infection the fluorescent signal was pro-foundly intense. When performing live cell imaging, the first signals were observed at 30 h post infection (Addi-tional file 3: Movie S1, starting from 30 hpi). From 45 h onwards the protein was substantially expressed con-firming the results obtained from fixed cells. These fluorescence patterns (fixed and live) nicely confirmed the RNA-seq data during EEF stage development. Interestingly, analyses of gene-deletion mutants lack-ing PBANKA_1003900 demonstrated that the gene is
Table 3 Gene ontology (GO) term annotation of genes preferentially expressed in (i) EEF merozoites and (ii) EF merozoites
The number of annotated genes (number genes per GO term present in the entire RNA-seq study) and observed genes (number of genes per GO term preferentially expressed in…) per Biological Process are listed. Only GO terms with P-values < 0.05 are shown
Biological process ID Process description Annotated Observed P value
(i) Preferentially expressed in exo-erythrocytic stage merozoites (DCs/merosomes)
GO:0010467 Gene expression 462 181 3.0e−22
GO:0042254 Ribosome biogenesis 63 47 4.6e−20
GO:0043604 Amide biosynthetic process 219 98 1.1e−17
GO:0032774 RNA biosynthetic process 103 35 0.00017
GO:0017183 Peptidyl‑diphthamide biosynthetic process from peptidyl‑
histidine 5 4 0.00700
GO:0000398 mRNA splicing, via spliceosome 43 15 0.01718
GO:0008295 Spermidine biosynthetic process 2 2 0.04105
GO:0008612 Peptidyl‑lysine modification to peptidyl‑hypusine 2 2 0.04105
(ii) Preferentially expressed in erythrocytic stage merozoites (22 h schizonts)
GO:0007264 Small gtpase mediated signal transduction 26 14 0.0014
GO:0006260 DNA replication 39 20 0.0049
GO:0045184 Establishment of protein localization 93 34 0.0060
GO:0007017 Microtubule‑based process 35 15 0.0075
GO:0000041 Transition metal ion transport 7 6 0.0151
GO:0006465 Signal peptide processing 5 4 0.0153
GO:0006848 Pyruvate transport 3 3 0.0154
GO:0006497 Protein lipidation 21 10 0.0196
GO:0006511 Ubiquitin‑dependent protein catabolic process 38 16 0.0248
GO:0043248 Proteasome assembly 8 5 0.0267
GO:0006310 DNA recombination 9 6 0.0366
not essential at any developmental stage throughout the complete parasite life cycle ([84] and own unpublished data). According to the expression profile deduced from the RNA-seq analysis and also confirmed by the pro-moter analyses, it is appropriate to revise the annotation as “gametocyte specific protein” and to rename it as “liver specific protein 3 (LISP3)”.
Conclusion
This study presents a time-course transcriptomic assess-ment of P. berghei liver stage development with empha-sis on late stage EEF stages and an extended comparative gene transcription analysis including published tran-scriptomic data from erythrocytic stages (sexual and asexual), as well as the ookinete stage. This offers a com-prehensive overview of gene transcription throughout most of the life cycle and allows a better understand-ing of gene regulation in different life cycle stages. In Fig. 6 Expression profiles of the top 5 genes predominantly expressed in exo‑erythrocytic stages compared to all other stages. Gene expression values corresponding to normalized and log2(x + 1)‑transformed read counts. The data were normalized with DESeq 2 (with default parameters) [40]
Table 4 LogFC and FDR (adjP) values of EEF-specific genes
LogFC is indicated as mean of EEF late stages by single comparisons to each other stage. FDR (adjP) values are presented as min and max values of the different comparisons
48 h to DCs/merosomes compared to other stages
Mean LogFC Min adjP Max adjP
Liver specific protein 2 (lisp2) PBANKA_1003000 9.946 2.26E−228 1.22E−18
Liver specific protein 3 (lisp3) PBANKA_1003900 8.730 9.44E−133 2.17E−10
Conserved Plasmodium membrane
protein, unknown function PBANKA_0518900 8.697 3.36E−175 9.55E−17
Liver specific protein 1 (lisp1) PBANKA_1024600 8.475 1.21E−189 1.24E−38
Conserved Plasmodium protein,
[image:15.595.56.538.85.363.2] [image:15.595.58.539.441.555.2]particular, the transcriptome of these different life cycle stages provides an invaluable tool for systems biology approaches to model metabolic pathways that are essen-tial in different steps of the Plasmodium life cycle. In a first attempt to analyse transcription profiles during the
Plasmodium life cycle, almost 4700 genes were sege-mented into 14 distinct communities based on their dif-ferent expression profile and attributed gene ontology terms to the individual communities. A more detailed analysis of the promoter regions of the genes in the com-munities with similar expression profiles could help iden-tifying common DNA domains that might support the further understanding of regulation of gene expression in Plasmodium. The RNA-seq data provided here are of
considerable interest for fundamental research questions with respect to the parasite biology as well as for applied research at the identification of new protein targets for vaccine and drug development.
Supplementary information
Supplementary information accompanies this paper at https ://doi. org/10.1186/s1293 6‑019‑2968‑7.
Additional file 1: Table S1. RNA‑seq data of different life cycle stages of
P. berghei used in this study. Table S2. RNA‑seq analysis: Raw sequencing counts per gene in the different life cycle stages. Table S3. Gene ontol‑ ogy (GO) term annotation of genes of the individual communities in the GCN. Table S4.P. berghei geneIDs of genes of the different communities in the GCN. Table S5. Genes preferentially expressed in developing EEF stages compared to developing EF stages. Table S6. Genes preferentially
[image:16.595.59.539.90.490.2]expressed in detached cells (DCs/merosomes) compared to erythrocytic schizonts. Table S7. Genes preferentially expressed in blood schizonts (22 h) compared to EEF stages. Table S8. Genes preferentially expressed in blood schizonts (22 h) compared to all other stages. Table S9. Genes preferentially expressed in detached cells (DCs/merosomes) compared to all other stages.
Additional file 2: Figure S1. Generation and genotyping of parasites expressing gfp under control of the promoter of PBANKA_1003900 (PBANKA_1003900GFP). Figure S2. Fluorescence‑activated cell sorting of infected HeLa cells preserved in RNAlater. Figure S3. RNA expression profiles of 3 housekeeping genes (gapdh, actinI, tubulin1). Figure S4. RNA expression profiles of 5 genes encoding serine‑repeat antigens, serine‑ type proteases (SERA1‑5). Figure S5. RNA expression profiles of 5 genes encoding proteins of the parasitophorous vacuole membrane (Exported protein 1, Exported protein 2, UIS3, UIS4). Figure S6. RNA expression profiles of genes encoding 2 sporozoite surface proteins (CSP and TRAP). Figure S7. RNA expression profiles of 4 genes encoding enzymes involved in fatty acid biosynthesis (FabB/F, FabI, FabZ, FabG). Figure S8.
RNA expression profiles of 6 genes encoding merozoite surface proteins (MSP). Figure S9. RNA expression profiles of 3 genes whose promoter regions have been used to drive expression of fluorescent/luminescent reporter proteins (HSP70, two genes for EF1α).
Additional file 3. Time laps: GFP expression under the control of PBANKA_1003900 promoter during EEF stage development.
Acknowledgements
FACS sorting was performed at the Cytometry Laboratory Core facility of the University of Bern; we are thankful for the kind support by Stefan Müller. RNA‑ sequencing was performed at the iGE3 genomics platform of the University of Geneva.
Authors’ contributions
VH and DSF conceived and coordinated the study, VH and RC designed the experiments; RC, SD performed the experiments; MWS, RC and SD conducted data analysis; BFF and CJJ generated reporter parasite lines; RC and MWS prepared figures; VH and RC wrote the original draft; DSF, CJJ, VH, RC, BFF, MWS, SD reviewed and edited the paper. All authors read and approved the final manuscript.
Funding
DSF and VH were supported by the RTD Grant MalarX (Grant Number: 51RTPO_151032), within SystemsX.ch (the Swiss Initiative for Systems Biology
http://www.syste msx.ch/proje cts/resea rch‑techn ology ‑and‑devel opmen t‑proje cts/malar x/).
Availability of data
Short reads generated in this study were deposited at the European Nucleotide Archive (http://www.ebi.ac.uk/ena/) and are accessible through the accession number PRJEB23770 (Secondary study accession number: ERP105548).
Ethics approval and consent to participate
Experiments were performed in accordance with the guidelines of the Swiss Act on animal protection (TSchG) and approved by the animal experimenta‑ tion commission of the canton Bern (authorization numbers BE109/13 and BE132/16). The generation of the parasite line expressing GFP under the promoter of PBANKA_1003900 was approved by the Animal Experiments Committee of the Leiden University Medical Center (DEC 12042). The Dutch Experiments on Animal Act is established under European guidelines (EU directive no. 86/609/EEC regarding the Protection of Animals used for Experi‑ mental and Other Scientific Purposes).
Consent for publication
Not applicable.
Competing interests
The authors declare that they have no competing interests.
Author details
1 Institute of Cell Biology, University of Bern, Bern, Switzerland. 2 Department of Microbiology and Molecular Medicine, Faculty of Medicine, University of Geneva CMU, Geneva, Switzerland. 3 MWSchmid GmbH, Zurich, Switzer‑ land. 4 Leiden Malaria Research Group, Department of Parasitology, Leiden University Medical Center, Leiden, The Netherlands.
Received: 14 June 2019 Accepted: 17 September 2019
References
1. WHO. World malaria report 2016. Geneva: World Health Organization; 2017.
2. Douglas RG, Amino R, Sinnis P, Frischknecht F. Active migration and passive transport of malaria parasites. Trends Parasitol. 2015;31:357–62. 3. Spielmann T, Montagna GN, Hecht L, Matuschewski K. Molecular make‑
up of the Plasmodium parasitophorous vacuolar membrane. Int J Med Microbiol. 2012;302:179–86.
4. Kaiser G, De Niz M, Zuber B, Burda P‑C, Kornmann B, Heussler VT, et al. High resolution microscopy reveals an unusual architecture of the Plasmodium berghei endoplasmic reticulum. Mol Microbiol. 2016;102:775–91.
5. Stanway RR, Mueller N, Zobiak B, Graewe S, Froehlke U, Zessin PJM, et al. Organelle segregation into Plasmodium liver stage merozoites. Cell Microbiol. 2011;13:1768–82.
6. Burda PC, Schaffner M, Kaiser G, Roques M, Zuber B, Heussler VT. A
Plasmodium plasma membrane reporter reveals membrane dynamics by live‑cell microscopy. Sci Rep. 2017;7:9740.
7. Burda P‑C, Roelli MA, Schaffner M, Khan SM, Janse CJ, Heussler VT. A
Plasmodium phospholipase is involved in disruption of the liver stage parasitophorous vacuole membrane. PLoS Pathog. 2015;11:e1004760. 8. Tawk L, Lacroix C, Gueirard P, Kent R, Gorgette O, Thiberge S, et al. A key
role for Plasmodium subtilisin‑like SUB1 protease in egress of malaria parasites from host hepatocytes. J Biol Chem. 2013;288:33336–46. 9. Suarez C, Volkmann K, Gomes AR, Billker O, Blackman MJ. The malarial
serine protease SUB1 plays an essential role in parasite liver stage development. PLoS Pathog. 2013;9:e1003811.
10. Deligianni E, Morgan RN, Bertuccini L, Wirth CC, de Monerri NC, Spanos L, et al. A perforin‑like protein mediates disruption of the erythrocyte membrane during egress of Plasmodium berghei male gametocytes. Cell Microbiol. 2013;15:1438–55.
11. Garg S, Agarwal S, Kumar S, Shams Yazdani S, Chitnis CE, Singh S. Calcium‑dependent permeabilization of erythrocytes by a perforin‑like protein during egress of malaria parasites. Nat Commun. 2013;4:1736. 12. Wirth CC, Glushakova S, Scheuermayer M, Repnik U, Garg S, Schaack
D, et al. Perforin‑like protein PPLP2 permeabilizes the red blood cell membrane during egress of Plasmodium falciparum gametocytes. Cell Microbiol. 2014;16:709–33.
13. Burda P‑C, Caldelari R, Heussler VT. Manipulation of the host cell mem‑ brane during Plasmodium liver stage egress. MBio. 2017;8:e00139. 14. Sturm A, Amino R, van de Sand C, Regen T, Retzlaff S, Rennenberg A,
et al. Manipulation of host hepatocytes by the malaria parasite for delivery into liver sinusoids. Science. 2006;313:1287–90.
15. Graewe S, Stanway RR, Rennenberg A, Heussler VT. Chronicle of a death foretold: Plasmodium liver stage parasites decide on the fate of the host cell. FEMS Microbiol Rev. 2012;36:111–30.
16. Baer K, Klotz C, Kappe SHI, Schnieder T, Frevert U. Release of hepatic
Plasmodium yoelii merozoites into the pulmonary microvasculature. PLoS Pathog. 2007;3:e171.
17. Glushakova S, Yin D, Li T, Zimmerberg J. Membrane transformation during malaria parasite release from human red blood cells. Curr Biol. 2005;15:1645–50.
18. Ghosh AK, Jacobs‑Lorena M. Plasmodium sporozoite invasion of the mosquito salivary gland. Curr Opin Microbiol. 2009;12:394–400. 19. Janse CJ, Ramesar J, Waters AP. High‑efficiency transfection and drug
selection of genetically transformed blood stages of the rodent malaria parasite Plasmodium berghei. Nat Protoc. 2006;1:346–56.
21. Kaiser G, De Niz M, Burda P‑C, Niklaus L, Stanway RL, Heussler V. Gen‑ eration of transgenic rodent malaria parasites by transfection of cell culture‑derived merozoites. Malar J. 2017;16:305.
22. Aurrecoechea C, Brestelli J, Brunk BP, Dommer J, Fischer S, Gajria B, et al. PlasmoDB: a functional genomic database for malaria parasites. Nucleic Acids Res. 2009;37:D539–43.
23. Poran A, Nötzel C, Aly O, Mencia‑Trinchant N, Harris CT, Guzman ML, et al. Single‑cell RNA sequencing reveals a signature of sexual commit‑ ment in malaria parasites. Nature. 2017;551:95–9.
24. Reid AJ, Talman AM, Bennett HM, Gomes AR, Sanders MJ, Illingworth CJR, et al. Single‑cell RNA‑seq reveals hidden transcriptional variation in malaria parasites. Elife. 2018;7:e33105.
25. Howick VM, Russell A, Andrews T, Heaton H, Reid AJ, Natarajan KN, et al. The Malaria Cell Atlas: a comprehensive reference of single parasite transcriptomes across the complete Plasmodium life cycle. bioRxiv. 2019;527:556.
26. Posfai D, Sylvester K, Reddy A, Ganley JG, Wirth J, Cullen QE, et al. Plas-modium parasite exploits host aquaporin‑3 during liver stage malaria infection. PLoS Pathog. 2018;14:e1007057.
27. LaMonte GM, Orjuela‑Sanchez P, Calla J, Wang LT, Li S, Swann J, et al. Dual RNA‑seq identifies human mucosal immunity protein Mucin‑13 as a hallmark of Plasmodium exoerythrocytic infection. Nat Commun. 2019;10:488.
28. Tarun AS, Peng X, Dumpit RF, Ogata Y, Silva‑Rivera H, Camargo N, et al. A combined transcriptome and proteome survey of malaria parasite liver stages. Proc Natl Acad Sci USA. 2008;105:305–10.
29. Gural N, Mancio‑Silva L, Miller AB, Galstian A, Butty VL, Levine SS, et al. In vitro culture, drug sensitivity, and transcriptome of Plasmodium vivax
hypnozoites. Cell Host Microbe. 2018;23:395–406.
30. Voorberg‑van der Wel A, Roma G, Gupta DK, Schuierer S, Nigsch F, Carbone W, et al. A comparative transcriptomic analysis of replicating and dormant liver stages of the relapsing malaria parasite Plasmodium cynomolgi. Elife. 2017;6:e29605.
31. Zaitoun I, Erickson CS, Schell K, Epstein ML. Use of RNAlater in fluores‑ cence‑activated cell sorting (FACS) reduces the fluorescence from GFP but not from DsRed. BMC Res Notes. 2010;3:328.
32. Franke‑Fayard B, Trueman H, Ramesar J, Mendoza J, van der Keur M, van der Linden R, et al. A Plasmodium berghei reference line that constitu‑ tively expresses GFP at a high level throughout the complete life cycle. Mol Biochem Parasitol. 2004;137:23–33.
33. Bolger AM, Lohse M, Usadel B. Trimmomatic: a flexible trimmer for Illumina sequence data. Bioinformatics. 2014;30:2114–20. 34. Pertea G. fqtrim: v0.9.4 release. 2015.
35. Langmead B, Salzberg SL. Fast gapped‑read alignment with Bowtie 2. Nat Methods. 2012;9:357–9.
36. Liao Y, Smyth GK, Shi W. The Subread aligner: fast, accurate and scalable read mapping by seed‑and‑vote. Nucleic Acids Res. 2013;41:e108. 37. Schmid MW, Grossniklaus U. Rcount: simple and flexible RNA‑Seq read
counting. Bioinformatics. 2015;31:436–7.
38. Mortazavi A, Williams BA, McCue K, Schaeffer L, Wold B. Mapping and quantifying mammalian transcriptomes by RNA‑Seq. Nat Methods. 2008;5:621–8.
39. Schmid MW, Schmidt A, Klostermeier UC, Barann M, Rosenstiel P, Gross‑ niklaus U. A powerful method for transcriptional profiling of specific cell types in eukaryotes: laser‑assisted microdissection and RNA sequenc‑ ing. PLoS ONE. 2012;7:e29685.
40. Love MI, Huber W, Anders S. Moderated estimation of fold change and dispersion for RNA‑seq data with DESeq2. Genome Biol. 2014;15:550. 41. Benjamini Y, Hochberg Y. Controlling the false discovery rate: a practi‑
cal and powerful approach to multiple testing. J R Stat Soc Ser B. 1995;57:289–300.
42. Coman D, Rütimann P, Gruissem W. A flexible protocol for tar‑ geted gene co‑expression network analysis. Methods Mol Biol. 2014;1153:285–99.
43. Blondel VD, Guillaume J‑L, Lambiotte R, Lefebvre E. Fast unfolding of communities in large networks. J Stat Mech Theory Exp. 2008. p. 10008. 44. Csardi G, Nepusz T. The Igraph software package for complex network
research. InterJournal Complex Systems. 2006;1695:1–9. 45. Shannon P, Markiel A, Ozier O, Baliga NS, Wang JT, Ramage D, et al.
Cytoscape: a software environment for integrated models of biomo‑ lecular interaction networks. Genome Res. 2003;13:2498–504.
46. Alexa A, Rahnenführer J, Lengauer T. Improved scoring of functional groups from gene expression data by decorrelating GO graph struc‑ ture. Bioinformatics. 2006;22:1600–7.
47. Bozdech Z, Llinás M, Pulliam BL, Wong ED, Zhu J, DeRisi JL. The tran‑ scriptome of the intraerythrocytic developmental cycle of Plasmodium falciparum. PLoS Biol. 2003;1:e5.
48. Nishimoto KP, Newkirk D, Hou S, Fruehauf J, Nelson EL. Fluorescence activated cell sorting (FACS) using RNAlater to minimize RNA degrada‑ tion and perturbation of mRNA expression from cells involved in initial host microbe interactions. J Microbiol Methods. 2007;70:205–8. 49. Otto TD, Böhme U, Jackson AP, Hunt M, Franke‑Fayard B, Hoeijmakers
WAM, et al. A comprehensive evaluation of rodent malaria parasite genomes and gene expression. BMC Biol. 2014;12:86.
50. Lasonder E, Rijpma SR, van Schaijk BCL, Hoeijmakers WAMAM, Kensche PR, Gresnigt MS, et al. Integrated transcriptomic and proteomic analyses of P. falciparum gametocytes: molecular insight into sex‑ specific processes and translational repression. Nucleic Acids Res. 2016;44:6087–101.
51. Mair GR, Braks JAM, Garver LS, Dimopoulos G, Hall N, Wiegant JCAG, et al. Translational repression is essential for Plasmodium sexual development and mediated by a DDX6‑type RNA helicase. Science. 2006;313:667–9.
52. Mair GR, Lasonder E, Garver LS, Franke‑Fayard BMD, Carret CK, Wiegant JCAG, et al. Universal features of post‑transcriptional gene regula‑ tion are critical for Plasmodium zygote development. PLoS Pathog. 2010;6:e1000767.
53. Hliscs M, Nahar C, Frischknecht F, Matuschewski K. Expression profiling of Plasmodium berghei HSP70 genes for generation of bright red fluo‑ rescent parasites. PLoS ONE. 2013;8:e72771.
54. Saeed S, Carter V, Tremp AZ, Dessens JT. Translational repression controls temporal expression of the Plasmodium berghei LCCL protein complex. Mol Biochem Parasitol. 2013;189:38–42.
55. Rao PN, Santos JM, Pain A, Templeton TJ, Mair GR. Translational repres‑ sion of the cpw‑wpc gene family in the malaria parasite Plasmodium. Parasitol Int. 2016;65:463–71.
56. Zhang M, Fennell C, Ranford‑Cartwright L, Sakthivel R, Gueirard P, Meister S, et al. The Plasmodium eukaryotic initiation factor‑2α kinase IK2 controls the latency of sporozoites in the mosquito salivary glands. J Exp Med. 2010;207:1465–74.
57. Silvie O, Briquet S, Müller K, Manzoni G, Matuschewski K. Post‑transcrip‑ tional silencing of UIS4 in Plasmodium berghei sporozoites is important for host switch. Mol Microbiol. 2014;91:1200–13.
58. Zhang M, Joyce BR, Sullivan WJ, Nussenzweig V. Translational control in
Plasmodium and Toxoplasma parasites. Eukaryot Cell. 2013;12:161–7. 59. Kiss T. Small nucleolar RNAs: an abundant group of noncoding RNAs
with diverse cellular functions. Cell. 2002;109:145–8.
60. Fougère A, Jackson AP, Paraskevi Bechtsi D, Braks JAM, Annoura T, Fonager J, et al. Variant exported blood‑stage proteins encoded by Plas-modium multigene families are expressed in liver stages where they are exported into the parasitophorous vacuole. PLoS Pathog. 2016;12:1–37. 61. Tarun AS, Vaughan AM, Kappe SHI. Redefining the role of de novo
fatty acid synthesis in Plasmodium parasites. Trends Parasitol. 2009;25:545–50.
62. Yu M, Kumar TRS, Nkrumah LJ, Coppi A, Retzlaff S, Li CD, et al. The fatty acid biosynthesis enzyme FabI plays a key role in the development of liver‑stage malarial parasites. Cell Host Microbe. 2008;4:567–78. 63. Vaughan AM, O’Neill MT, Tarun AS, Camargo N, Phuong TM, Aly ASI,
et al. Type II fatty acid synthesis is essential only for malaria parasite late liver stage development. Cell Microbiol. 2009;11:506–20.
64. Shears MJ, Botté CY, McFadden GI. Fatty acid metabolism in the Plasmo-dium apicoplast: drugs, doubts and knockouts. Mol Biochem Parasitol. 2015;199:34–50.
65. De Niz M, Ullrich A‑K, Heiber A, Soares AB, Pick C, Lyck R, et al. The machinery underlying malaria parasite virulence is conserved between rodent and human malaria parasites. Nat Commun. 2016;7:11659. 66. Fonager J, Pasini EM, Braks JAM, Klop O, Ramesar J, Remarque EJ,
et al. Reduced CD36‑dependent tissue sequestration of Plasmodium‑ infected erythrocytes is detrimental to malaria parasite growth in vivo. J Exp Med. 2012;209:93–107.