METHODOLOGY
Simultaneous quantification
of artesunate and mefloquine in fixed-dose
combination tablets by multivariate calibration
with middle infrared spectroscopy and partial
least squares regression
Breno Maurício Marson, Raquel de Oliveira Vilhena, Camilla Regina de Souza Madeira,
Flávia Lada Degaut Pontes, Mário Sérgio Piantavini and Roberto Pontarolo
*Abstract
Background: Malaria is one of the most lethal and life-threatening infectious diseases in the world, causing more than half a million deaths annually. Treatment with mefloquine and artesunate is currently recommended by the World Health Organization, and was historically the first artemisinin-based combination therapy used clinically for treatment of Plasmodium falciparum. The problem of poor-quality medicines, such as counterfeit and sub-standard anti-malarials, is a worldwide issue; therefore, it is essential to develop rapid, low cost, solvent-free, and reliable meth-ods for routine quality control for these drugs. The aim of this study was to develop and validate a novel multivariate method for direct simultaneous quantification of mefloquine and artesunate in tablets by diffuse reflectance, middle infrared spectroscopy and partial least squares regression (MIR-PLS).
Methods: Diffuse reflectance infrared Fourier transform spectroscopy (DRIFTS) and partial least squares regres-sion were applied for simultaneous quantification of artesunate and mefloquine in tablets provided by the Brazil-ian Government. The model was obtained with full spectra (4000–400 cm−1) preprocessed by first derivative and
Savitzky-Golay smoothing followed by mean centring, and built with three latent variables. The method was validated according to Brazilian and international guidelines through the measuring of figures of merit, such as trueness, preci-sion, linearity, analytical sensitivity, selectivity, bias, and residual prediction deviation. The results were compared to an HPLC–MS/MS method.
Results: The MIR-PLS method provided root mean square errors of prediction lower than 2.0 mg per 100 mg of powder for the two analytes, and proved to be valid according to guidelines for analytical methods that use infrared (IR) spectroscopy with multivariate calibration. For the samples obtained from Brazilian healthcare units, the method provided results statistically similar to those obtained by HPLC–MS/MS.
Conclusion: MIR-PLS was found to be suitable for the quality control of these drugs. It is fast, does not use solvents, and does not generate chemical waste. Furthermore, the proposed method may be transferred and developed for use in portable equipment, increasing the possibilities for assessing the quality of these drugs.
Keywords: Artesunate, Mefloquine, DRIFTS, Multivariate analytical, PLS, Analytical validation, Quality control
© 2016 Marson et al. This article is distributed under the terms of the Creative Commons Attribution 4.0 International License (http://creativecommons.org/licenses/by/4.0/), which permits unrestricted use, distribution, and reproduction in any medium, provided you give appropriate credit to the original author(s) and the source, provide a link to the Creative Commons license, and indicate if changes were made. The Creative Commons Public Domain Dedication waiver (http://creativecommons.org/ publicdomain/zero/1.0/) applies to the data made available in this article, unless otherwise stated.
Open Access
*Correspondence: [email protected]
Background
Malaria is a human infection caused by some protozoan parasites of the genus Plasmodium [1]. Many species are known to infect humans, and the most dangerous is Plas-modium falciparum, responsible for the most severe and fatal cases [2, 3]. Recognized as a serious public health problem worldwide, 3.3 billion people are at risk of being infected with malaria and developing disease. In 2013, 198 million cases of malaria were recorded, and the dis-ease led to between 367,000 and 755,000 deaths [3].
Treatment is based on inhibiting the life cycle of the parasite. Currently, in order to increase the spectrum of therapeutic action and its effectiveness, as well as pre-venting anti-malarial drug resistance, the World Health Organization (WHO) recommends that artemisinin-based combination therapy (ACT), such as artesunate (ARS) and mefloquine (MFQ), be used for the treatment of uncomplicated P. falciparum malaria [3, 4]. Its mecha-nism of action involves the interruption of the erythro-cytic schizogony cycle, destruction of latent forms of the parasite in the tissue cycle, and stopping the growth of the sexual form [5]. ACT consists of the use of two drugs with different modes of action, combining the immedi-ate effect of an artemisinin-derivative that rapidly clears asexual blood-stage parasites and gametocytes, as well as a drug that has a longer half-life, thus eliminating resid-ual parasites [6].
ARS-MFQ fixed-dose combination tablets are the most common ACT treatment of uncomplicated fal-ciparum malaria in Brazil [7]. Two kinds of tablet are currently available: one containing 25 mg of ARS and 55 mg of MFQ (corresponding to 50 mg of mefloquine base), and one containing 100 mg of ARS and 220 mg of MFQ (corresponding to 200 mg of mefloquine base) (Fig. 1).
Anti-malarials are among the most widely taken drugs in tropical countries, and have been particularly tar-geted by counterfeiters. The use of counterfeit drugs or sub-standard anti-malarial drugs can increase instances of morbidity, adverse effects and mortality due to exces-sive dose, presence of potentially toxic ingredients or pathogenic contaminants. Also, sub-therapeutic amounts of active ingredients contribute significantly to selection of resistant parasites and, thus, resistance to anti-malarial drugs [8]. Quality control of anti-malarial drug preparations may help to ensure treatment efficacy and avoid development of resistance to anti-malarial drugs [9].
Several methods for the simultaneous quantification these drugs can be found in the literature, such as ultravi-olet (UV) spectrophotometry [10, 11], high performance liquid chromatography (HPLC) with UV spectropho-tometry detection [12, 13], high performance thin layer chromatography (HPTLC) with UV spectrophotometry detection [13, 14], and HPLC coupled with tandem mass spectroscopy (HPLC–MS/MS) [15]. Despite being very commonly used, no methods for quality control of avail-able products are described in the pharmacopoeias [16– 19]. There are no methods using infrared (IR) associated with multivariate calibration for these drugs can be found in the scientific literature. Furthermore, this method pro-vides direct and fast analysis, and is low cost and solvent free.
Methods based on diffuse reflectance infrared Fourier transform (DRIFT) middle infrared spectroscopy (MIR) and near infrared (NIR) spectroscopy have been adopted in the pharmaceutical industry for raw material test-ing and process monitortest-ing, and have become a reliable alternative for the quality control of active pharmaceu-tical ingredients (APIs) [20–26]. Due to the significant overlap of IR bands, univariate techniques have limita-tions. However, these limitations can be circumvented through the use of multivariate calibration tools. The combination of IR spectroscopy and multivariate calibra-tion, such as partial least squares (PLS) regression, has emerged in the last decade as a promising alternative for the quality control of APIs [27]. Furthermore, IR in combination with multivariate calibration tools has sig-nificant advantages in terms of speed, cost and reliabil-ity of analysis. Perhaps most importantly, no solvent is required by the technique.
The aim of this work was to develop and validate a simple and rapid multivariate method for direct simul-taneous determination of ARS and MFQ in powdered samples of anti-malarial tablet formulations using diffuse reflectance MIR spectroscopy and PLS. The results of the multivariate method (MIR-PLS) were compared with the results obtained using HPLC–MS/MS [15].
[image:2.595.56.290.550.701.2]Methods
Samples and chemicals
ARS, MFQ and ARS-MFQ fixed-dose combination tab-lets were provided by Farmanguinhos/Fundação Oswaldo Cruz (Rio de Janeiro, RJ, Brazil). The ARS standard was obtained from Farmacopeia Brasileira (>98.8 %) (Bra-sília, DF, Brazil), The MFQ-hydrochloride standard was obtained from Sigma-Aldrich (>98.0 %) (St Louis, MO, USA). Microcrystalline cellulose was obtained from DEG (São Paulo, Brazil), and croscarmellose sodium and mag-nesium stearate were obtained from Indukern do Brasil Química Ltd (São Paulo, Brazil). HPLC grade acetoni-trile and methanol were purchased from Tedia (Fair-field, USA). Formic acid was purchased from Carlo Erba Reagenti, Rodano, Italy (>99.0 %). Ultrapure water was obtained using a Milli-Q purification system from Mil-lipore (Bedford, MA, USA). The tablets had the formu-lation composition: 100 mg of ARS and 220 mg of MFQ (corresponding to 200 mg of mefloquine base) per tablet. The quantitative compositions of the excipients are not publicly available.
Apparatus and software
The spectral dataset was acquired from a Bruker Alpha Fourier transform infrared (FTIR) spectrom-eter equipped with a diffuse reflectance accessory, and under controlled temperature (20.0 ± 0.2 °C) and humidity (45–55 %). The spectra were obtained in absorbance mode using OPUS (Optical User Software) for windows (version 6.0, Brucker Optik, Bremen, Ger-many). Data were handled using OPUS, MATLAB soft-ware (version 7.13, The Math-Works, Natick, USA), PLS Toolbox (version 6.5, Eigenvector Technologies, Manson, USA), and Statistica 10.0 software (StatSoft, Oklahoma, USA).
HPLC–MS/MS analyses were performed on an Agilent 1200 HPLC system (Agilent Technologies, Santa Clara, CA, USA) that consisted of a G1312B binary pump, a G1379B degasser and a G1316B column oven. This appa-ratus was connected with a CTC sample manager (Model 2777, Waters, Milford, MA, USA). The mass spectrom-eter coupled to the HPLC system was a triple quadrupole API 3200 from Applied Biosystems MDS Sciex Instru-ments (Foster City, CA, USA) equipped with a syringe pump (Harvard Apparatus, Holliston, MA, USA) and an electrospray (ESI) ion source. The data acquisition was performed with MS Workstation by Analyst 1.4 software (MDS Sciex, Concord, Ontario, Canada) [15].
Experimental design
Thirty-seven powder samples were prepared according to a central composite design (CCD) (αrotability = 1.6818; αortogonality = 1.2872) with three factors (ARS, MFQ and
the majority excipient), and five levels plus a central point. The number of samples for calibration must be equal to 6 × [the number of latent variables (LV) + 1] and the number of validation samples equal to 4 × LV, according to the American Society for Testing and Mate-rials (ASTM) recommendations, as depicted in Fig. 2 [28].
The total mass of each sample was fixed at 100.0 mg, the central point of the CCD corresponds to 23.3 mg of ARS and 51.4 mg of MFQ per 100 mg of sample. The ranges of ARS and MFQ were varied from ca. 75.0–125.0 % of their nominal contents in the ARS-MFQ fixed-dose combination tablets. In the case of the minority excipi-ents (croscarmellose sodium and magnesium stearate), was chosen not to vary their concentrations owing their low concentrations in the formulation. For the majority excipient microcrystalline cellulose, the concentration range was sufficient to ensure a final mass equivalent to 100.0 mg of sample, as defined.
Sample preparation
The powder samples of experimental design were weighed with an analytical balance (±0.0001 g) and man-ually homogenized with a pestle and mortar. The spectra of the samples were recorded from 4000 to 400 cm−1 as the average of 32 scans and with a resolution of 4 cm−1. To evaluate repeatability, six replicates of samples from the central point were also obtained. To estimate inter-mediate precision, the results were compared with simi-lar replicates obtained on another day by a different analyst. Fifty spectra of the empty cell were recorded to measure the instrumental noise.
The multivariate calibration model development
The multivariate calibration model was developed using PLS regression. Several models were built using algorithm PLS1 (models for only one API) and PLS2 (models for 2 API simultaneously), cross-validation
Fig. 2 Experimental central composite design (CCD) used for varia-tion of active pharmaceutical ingredient contents, artesunate (ARS) and mefloquine (MFQ). Samples of calibration set are represented by
[image:3.595.305.539.562.680.2](leave-one-out), and the combination of different pre-processing methods. Models were constructed using the entire spectrum, restricted to using the leading bands of each analyte and also through the technique of intervals PLS (iPLS). The best models were chosen based on the value of the root mean square of calibra-tion (RMSEC) and the root mean square of prediccalibra-tion (RMSEP).
Analysis of ARS‑MFQ fixed‑dose combination tablets
The content of ten tablets with 100 mg of ARS and 220 mg of MFQ (corresponding to 200 mg of mefloquine base), was crushed and mixed into a homogeneous pow-der. The MIR spectra of these samples were acquired in the same conditions described in section sample prepara-tion, in triplicate. These same samples were also analysed by HPLC–MS/MS.
HPLC–ESI–MS/MS analysis
The analytical separations were achieved on an XBridge C18 column (50 × 2.1 mm, 5 μm) coupled with an XBridge C18 guard column (10 × 2.1 mm, 5 μm) main-tained at 25 °C. The mobile phase consisted of water/ acetonitrile/methanol (30:35:35 v/v/v) containing 0.1 % formic acid. The flow rate was 350 μL min−1 and the injection volume was 5 μL. The ESI source was oper-ated in positive mode under the following working con-ditions: ion spray voltage of 5500 V; source temperature of 400 °C; nebulizer and dryer gas (nitrogen) of 40 psi; collision activated dissociation gas (CAD) of 10 psi and curtain gas (CUR) of 10 psi. Quantification was per-formed in multiple reaction monitoring (MRM) mode, maintaining a dwell time of 350 ms. A mass equivalent to one quarter of the tablet was subjected to extraction and mixed with internal standard, diluted in mobile phase in a volumetric flask according to the appropriate concen-tration. All samples were prepared under low light expo-sure and filtered through a 0.22 µm PVDF syringe filter prior to injection.
Results
Selection of excipients and experimental design
As the quantitative levels of the excipients in the ARS-MFQ fixed-dose combination tablets was not known, due to lack of access to information from the manufacturer, it was suggested a formulation based on the qualitative levels of excipients described in the leaflet and phar-macotechnical study to build a multivariate calibration model. The formulation set consisted of microcrystal-line cellulose (19.5 %-diluent), sodium croscarmellose (3.5 %-disintegrating agent) and magnesium stearate (0.5 %-lubricant).
Multivariate calibration model
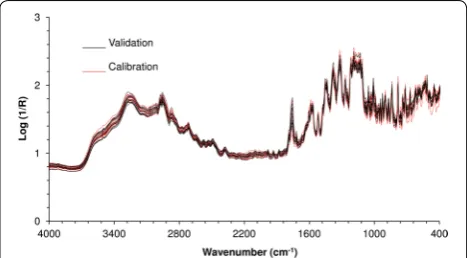
The spectra of all 37 prepared samples (Fig. 3) were divided into 25 for the calibration set and 12 for the vali-dation set, according to an experimental design (Fig. 2). The validation samples were selected in order to test the predictive ability of the model by ensuring a homogene-ous and representative distribution of the two analytes within the analytical ranges. The use of preprocessing techniques in PLS model development by reflectance IR of powder samples is almost mandatory, due to the pres-ence of non-linear baseline deviations. In this work, the most commonly used preprocessing techniques, such as multiplicative scatter correction (MSC), standard normal variate (SNV), and Savitzky-Golay first derivative with smoothing, were tested [29].
The best model was MIR-PLS using full spectra (4000– 400 cm−1) with first derivative followed by Savitsky-Golay smoothing, followed by MSC (15 points in filter and first order polynomial fit), and mean centring (X block). The Y block utilized only mean centring. The PLS model was selected by random sub-sets cross-validation with three LVs (recommended as the minimum number of calibration and validation samples for infrared mul-tivariate quantitative analysis). This number of LVs was used to estimate the smallest prediction error variance without significant loss of data (root mean square errors of cross validation (RMSECV × LV) [28].
Outliers may adversely affect the predictive ability of the model and therefore were investigated by analysis of the studentized residuals versus leverage, with limits of ±2.5 and 3 LV/n, respectively, considering a confidence
limit of 95 % [28]. The values of studentized residual were between ±2.5 %, and values of leverage were less than
0.36. Outliers were not found. This model accounted for 89.91 % of the total variance in the X block and 80.98 % in the Y block. The averages the RMSEC, RMSECV and RMSEP values for ARS and MFQ are given in Table 1.
Fig. 3 Diffuse reflectance MIR spectra of all the 37 samples of experimental design. Samples of calibration set are represented by
[image:4.595.305.539.546.675.2]Validation of the multivariate model
Once the model was developed, its analytical validation is essential. For the validation process, it was consid-ered the figures of merit recommended for multivariate calibration models [28], and national and international recommendations [30–32]. All the multivariate fig-ures of merit estimated for this validation are listed in Table 1.
The precision, defined as the closeness of measure-ments of the same concentration, was assessed at two levels, based on the relative standard deviation (RSD) for six replicates of sample at 100 % of nominal concen-tration. The RSDs for repeatability (intra-run precision) were 2.73 and 2.89 % for ARS and MFQ, respectively, while for intermediate precision (inter-run) they were 3.12 and 2.79 %, ARS and MFQ, respectively. All RSD values are less than 5 %, in accordance with Brazilian regulations [30]. The average trueness was evaluated through the parameters RMSECV, RMSEC and mainly, RMSEP. The estimated RMSEP for the analytes were 0.87 and 1.93 mg/100 mg for ARS and MFQ, respectively. These results for trueness and precision confirm that the method is accurate.
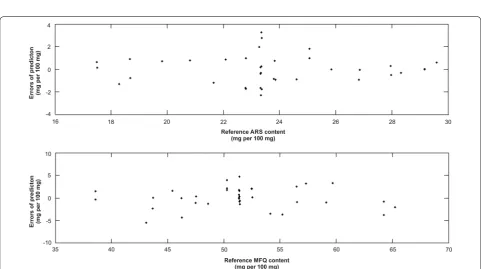
The linearity was evaluated through the plot of the ref-erence versus predicted values, as shown in (Fig. 4), and by verifying the random behaviours of the residual dis-tributions for both analytes, as can be seen in Fig. 5. The correlation coefficients (r) were 0.90 for ARS and 0.91 for MFQ.
Considering the linearity and accuracy evalua-tions, the working ranges of this method are 17.49– 29.59 mg/100 mg for ARS, and 38.56–65.23 mg/100 mg for MFQ.
The figures of merit selectivity (SEL), sensitivity (SEN), analytical sensitivity (γ), and limits of detection (LOD) were estimated based on the concept of net analytical signal (NAS), as described in the appropriate literature [22, 33–35]. The interpretation of SEL for multivariate methods is different from univariate methods, and has no practical application for quality control purposes. The SEL definition is only useful within a certain group of samples of similar composition, and for the developed method it was estimated that about 28.70 and 34.40 % of the analytical signal were used for measuring ARS and MFQ, respectively.
Since the pure SEN is not appropriate for comparison with other methods, their values were divided by the esti-mative of the instrumental noise (ε = 3.7 × 10⁻³) and the more useful γ (analytical sensibility) was estimated to be 25.47 and 35.25 mg/100 mg for ARS and MFQ, respec-tively. The inverse of γ indicated that the method was able to discriminate minimum content differences between 3.9 × 10⁻² and 2.8 × 10⁻² mg/100 mg for ARS and MFQ, respectively, considering random instrumental noise as the only source of errors.
Although not necessary for this kind of method, LOD and limit of quantification (LOQ) were also estimated based on the ε. The bias should be estimated only for the validation samples, and the values in Table 1, along with their standard deviation, were used in t tests with 11 degrees of freedom and at 95 % confidence level. The esti-mated t values were all bellow the critical t value (2.201), demonstrating the absence of systematic errors in the model. The residual prediction deviation (RPD) [35] is the ratio of natural variation in the samples to the size of probable errors occurring during the prediction, and it is more useful for comparing models on different data sets or in absolute terms. It was calculated for the calibra-tion and validacalibra-tion sets, and the minimum RPD was esti-mated as 1.56 and 3.67 for ARS and MFQ, respectively (for prediction in the calibration set), and 1.89 and 2.58 for ARS and MFQ, respectively (for prediction in the vali-dation set).
Analysis of ARS‑MFQ fixed‑dose combination tablets
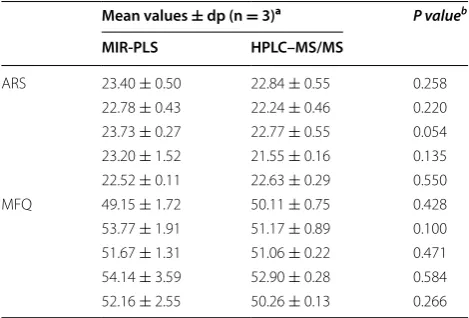
The developed method was applied to the simultaneous quantification of ARS and MFQ in tablets (Farmanguin-hos, RJ, Brazil) and the results were compared with those obtained using HPLC–MS/MS. The same samples were analysed by the two methods in triplicate. The predicted mean values and their standard deviations are shown in Table 2. According to the t test, there were no significant
Table 1 Parameters estimated for validating the devel-oped MIR-PLS method
a Per cent
b mg/100 mg
c Dimensionless units
Figures of merit Parameter Values
ARS MFQ
Precision RSD repeatabilitya 2.73 2.89
RSD intermediatea 3.12 2.79
Trueness RMSECb 1.58 2.84
RMSECVb 2.10 3.62
RMSEPb 0.87 1.93
Rangeb 17.49–29.59 38.56–65.23
Selectivitya 28.70 34.40
SA (γ)b 25.47 35.25
γ−1b 0.04 0.03
RPDc Calibration 1.56 1.89
Validation 3.67 2.58
Bias −0.03 0.56
LODb 0.13 0.09
differences between the predictions of the developed MIR-PLS method and HPLC–MS/MS, for both ana-lytes (p > 0.05), at 95 % confidence level (all estimated
t values were below the critical t = 2.776). Therefore, it
can be inferred that the results are statistically equivalent between the techniques.
Fig. 4 Plots of reference content versus predicted content of artesunate (ARS) and mefloquine (MFQ) determined by multivariate calibration model. Samples of calibration set are represented by black circles and validation set by red down triangles
[image:6.595.58.539.88.341.2] [image:6.595.57.539.386.655.2]It is worth mentioning that the MIR-PLS method was developed based on a formulation proposed by this study. Even considering the possible difference between the for-mulation proposed and samples obtained from Brazilian healthcare units, the method showed predictive capacity equivalent to the HPLC–MS/MS method.
Conclusions
This study was the first report of simultaneous quantifi-cation of ARS and MFQ in pharmaceutical formulations tablets by diffuse reflectance MIR spectroscopy using multivariate calibration. The developed method was validated and shown to be a suitable technique to quan-tify these anti-malarial agents in pharmaceutical prepa-rations, provided results statistically similar to those obtained by HPLC–MS/MS, and may be successfully employed for quality control analysis. ARS and MFQ tab-lets analysed by the validated method showed adequate quality and drug contents in agreement with the labelled amounts. Compared to liquid chromatography methods, the MIR-PLS method has advantages such as its low cost, rapidity and ability to provide direct solvent-free analysis. It may be considered suitable for routine quality control determinations.
Abbreviations
ACT: artemisinin-based combination therapy; API: active pharmaceutical ingredient; ARS: artesunate; ASTM: American Society for Testing and Materials; CAD: collision activated dissociation gas; CCD: central composite design; CUR: curtain gas; DRIFTS: diffuse reflectance infrared Fourier transform spectros-copy; ESI: electrospray; FTIR: Fourier transform infrared; HPLC–MS/MS: high performance liquid chromatography coupled with tandem mass spectros-copy; HPTLC: high performance thin layer chromatography; iPLS: interval partial least squares regression; IR: infrared; LOD: limits of detection; LOQ: limit of quantification; LV: latent variable; MFQ: mefloquine; MIR: middle infrared spectroscopy; MIR-PLS: middle infrared spectroscopy and partial least squares
regression; MRM: multiple reaction monitoring; MSC: multiplicative scatter cor-rection; NAS: net analytical signal; NIR: near infrared spectroscopy; PLS: partial least squares regression; RMSEC: root mean square of calibration; RMSEP: root mean square of prediction; RMSECV: root mean square of cross-validation; RPD: residual prediction deviation; RSD: relative standard deviation; SEL: selectivity; SEN: sensitivity; SNV: standard normal variate; UV: ultraviolet; WHO: World Health Organization; γ: analytical sensitivity.
Authors’ contributions
BMM elaborated the experimental design, executed the analytical laboratory experiments, interpreted the data, and wrote the manuscript. ROV supported the analytical laboratory experiments and manuscript preparation. CRSM and FLDP supported the analytical laboratory experiments and interpretation of data. MSP supported the experimental design, analytical laboratory experi-ments, interpretation of data, and manuscript preparation. RP was the overall study coordinator and critically reviewed the manuscript. All authors read and approved the final manuscript.
Acknowledgements
The authors thank CAPES for fellowships, and Fundação Oswaldo Cruz for providing the ARS, MFQ, and ARS-MFQ fixed-dose combination tablets.
Competing interests
The authors declare that they have no competing interests.
Received: 16 October 2015 Accepted: 9 February 2016
References
1. Shapiro TA, Goldberg DD. Chemotherapy of protozoal infections: malaria. In: Brunton LL, Lazo JS, Parker KL, editors. Goodman and Gilman’s the pharmacological basis of therapeutics. 11th ed. New York: McGraw-Hill; 2006. p. 1021–47.
2. Nichols WK. Anti-infectives. In: Limmer D, editor. Remington: the science and practice of pharmacy. 20th ed. Philadelphia: Lippincott Williams and Wilkins; 2006. p. 1546–7.
3. WHO. World Malaria Report 2014. Geneva: World Health Organization; 2014.
4. WHO. Guidelines for the treatment of malaria. Geneva: World Health Organization; 2010.
5. Wilairatana P, Krudsood S, Treeprasertsuk S, Chalermrut K, Looareesuwan S. The future outlook of antimalarial drugs and recent work on the treat-ment of malaria. Arch Med Res. 2002;33:416–21.
6. Varotti FP, Botelho ACC, Andrade AA, De Paula RC, Fagundes EMS, Valverde A, et al. Synthesis, antimalarial activity, and intracellular targets of MEFAS, a new hybrid compound derived from mefloquine and artesu-nate. Antimicrob Agents Chemother. 2008;52:3868–74.
7. Ministério de Saúde. Departamento de Vigilância Epidemiológica: Guia prático do tratamento da malária no Brasil. Brasília: Série A Normas e Manuais Técnicos, Ministerio da Saude; 2010.
8. Newton PN, Green MD, Fernández FM, Day NPJ, White NJ. Counterfeit anti-infective drugs. Lancet Infect Dis. 2006;6:602–13.
9. César IC, Nogueira FHA, Pianetti GA. Simultaneous determination of artemether and lumefantrine in fixed dose combination tablets by HPLC with UV detection. J Pharm Biomed Anal. 2008;48:951–4.
10. Kalyankar TM, Kakade RB, Attar MS, Kamble AR. Simultaneous spec-trophotometric estimation of artesunate and mefloquine. J Chem. 2013;2013:1–5.
11. Sourabh K, Ajay G, Mukut T, Surendra SI, Rajesh R. Development and vali-dation of first order derivative UV spectroscopic method for simultaneous estimation of artesunate and mefloquine as api and in marketed tablet dosage form. IJPRBS. 2014;3:200–11.
12. Nogueira FHA, Reis NFA, Chellini PR, César IC, Pianetti GA. Development and validation of an HPLC method for the simultaneous determination of artesunate and mefloquine hydrochloride in fixed-dose combination tablets. Braz J Pharm Sci. 2013;49:837–43.
13. Sandhya SM, Shiji kumar PS, Meena S. Application of HPTLC-densi-tometry by derivatization and stability indicating LC for simultaneous Table 2 Comparison of contents of ARS and MFQ in tablets
by MIR-PLS and HPLC–MS/MS (n = 5)
a mg/100 mg of tablet
b t test non-paired, at 95 % confidence level
Mean values ± dp (n = 3)a P valueb
MIR‑PLS HPLC–MS/MS
ARS 23.40 ± 0.50 22.84 ± 0.55 0.258
22.78 ± 0.43 22.24 ± 0.46 0.220
23.73 ± 0.27 22.77 ± 0.55 0.054
23.20 ± 1.52 21.55 ± 0.16 0.135
22.52 ± 0.11 22.63 ± 0.29 0.550
MFQ 49.15 ± 1.72 50.11 ± 0.75 0.428
53.77 ± 1.91 51.17 ± 0.89 0.100
51.67 ± 1.31 51.06 ± 0.22 0.471
54.14 ± 3.59 52.90 ± 0.28 0.584
[image:7.595.56.291.114.273.2]• We accept pre-submission inquiries
• Our selector tool helps you to find the most relevant journal
• We provide round the clock customer support
• Convenient online submission
• Thorough peer review
• Inclusion in PubMed and all major indexing services
• Maximum visibility for your research
Submit your manuscript at www.biomedcentral.com/submit
Submit your next manuscript to BioMed Central
and we will help you at every step:
determination of mefloquine hydrochloride and artesunate in combined dosage form. Am Chem Sci J. 2015;7:26–37.
14. Manikandan K, Lakshmi KS, Geetha Y, Sowmiya K, Saranya K. Method development and validation of artesunate and mefloquine hydrochloride in bulk and dosage form by HPTLC. J Chem Pharm Sci. 2013;6:155–60. 15. Marson BM. Desenvolvimento e validação de métodos para a quanti-ficação de fármacos antimaláricos utilizando IVM-PLS e CLAE-EM/EM. In: Master Dissertation. Federal University of Paraná, Pharmaceutical Sciences Department; 2015.
16. The International Pharmacopoeia. 4th ed. Geneva; 2006. 17. European Pharmacopoeia, 6th ed. Strasbourg; 2007.
18. The United States Pharmacopeia. 36th ed. Rockville: United States Phar-macopeial Convention; 2013
19. Farmacopéia Brasileira, 5 ed. Brasília; 2010.
20. Ferreira MH, Gomes JFF, Sena MM. Development and validation of a mul-tivariate calibration model for determination of dipyrone in oral solutions by near infrared spectroscopy. J Braz Chem Soc. 2009;20:1680–6. 21. Rocha WFC, Rosa AL, Martins JA, Poppi RJ. Determination and validation
of nimesulide in pharmaceutical formulation by near infrared spectros-copy. J Braz Chem Soc. 2010;21:1929–36.
22. Silva MAM, Ferreira MH, Braga JWB, Sena MM. Development and analyti-cal validation of a multivariate analyti-calibration method for determination of amoxicillin in suspension formulations by near infrared spectroscopy. Talanta. 2012;89:342–51.
23. Piantavini MS, Pontes FLD, Uber CP, Stremel DP, Sena MM, Pontarolo R. Chemometric quality inspection control of pyrantel pamoate, febantel and praziquantel in veterinary tablets by mid infrared spectroscopy. Spectrochim Acta A. 2014;125:396–403.
24. Bunaciu AA, Aboul-Enein HY, Fleschin S. Application of Fourier transform infrared spectrophotometry in pharmaceutical drugs analysis. Appl Spectrosc. 2010;45:206–19.
25. Kandhro AA, Laghari AH, Mahesar SA, Saleem R, Nelofar A, Khan ST, et al. Application of attenuated total reflectance Fourier transform infrared
spectroscopy for determination of cefixime in oral pharmaceutical formulations. Spectrochim Acta A. 2013;115:51–6.
26. Müller ALH, Picoloto RS, Ferrão MF, Silva FEB, Müller EI, Flores ÉM. Simul-taneous diffuse reflectance infrared determination of clavulanic acid and amoxicillin using multivariate calibration techniques. Drug Test Anal. 2012;4:500–6.
27. Haaland DM, Thomas EV. Partial least-squares methods for spectral analyses. 1. Relation to other quantitative calibration methods and the extraction of qualitative information. Anal Chem. 1988;60:1193–202. 28. Annual book of ASTM standards. Standard practices for infrared
multivari-ate quantitative analysis E1655-05, West Conshohocken; 2012. 29. Rinnan A, VanDenBerg F, Engelsen SB. Review of the most common
pre-processing techniques for near-infrared spectra. TrendsAnal Chem. 2009;28:1201–22.
30. Ministério da Saúde. Agência Nacional de Vigilância Sanitária—ANVISA: Guia para validação de métodos analíticos e bioanalíticos RE no 899, de 29/5/2003. Brasília; 2003
31. INMETRO-Instituto Nacional de Metrologia Normalização e Qualidade Industrial, DOQ-CGCRE-008. Orientação sobre validação de métodos analíticos. Brazil; 2010.
32. ICH Guidelines—International Conference on Harmonisation, Q2(R1). In: Validation of analytical procedures: text and methodology. 2005. http:// www.ich.org/fileadmin/Public_Web_Site/ICH_Products/Guidelines/Qual-ity/Q2_R1/Step4/Q2_R1__Guideline.pdf. Accessed 17 Sept 2015. 33. Olivieri AC, Faber NM, Ferré J, Boqué R, Kalivas JH, Mark H. Uncertainty
estimation and figures of merit for multivariate calibration (IUPAC techni-cal report). Pure Appl Chem. 2006;78(3):633–61.
34. Valderrama P, Braga JWB, Poppi RJ. Estado da arte de figuras de mérito em calibração multivariada. Quim Nova. 2009;32(5):1278–87. 35. Williams P. Implementation of near-infrared technology. In: Williams P,