R E S E A R C H
Open Access
Sensitive and rapid quantification of C-reactive
protein using quantum dot-labeled microplate
immunoassay
Yang Luo
1, Bo Zhang
1, Ming Chen
2, Tianlun Jiang
3, Daiyang Zhou
1, Junfu Huang
1and Weiling Fu
1*Abstract
Background:High-sensitivity C-reactive protein (hs-CRP) assay is of great clinical importance in predicting risks associated with coronary heart disease. Existing hs-CRP assays either require complex operation or have low throughput and cannot be routinely implemented in rural settings due to limited laboratory resources.
Methods:We developed a novel hs-CRP assay capable of simultaneously quantifying over 90 clinical samples by using quantum dots-labeled immunoassay within a standard 96-well microplate. The specificity of the assay was enhanced by adopting two monoclonal antibodies (mAbs) that target distinct hs-CRP epitopes, serving as the coating antibody and the detection antibody, respectively. In the presence of hs-CRP antigen, the fluorescence intensity of the mAb-Ag-mAb sandwich complex captured on the microplate can be read out using a microplate reader.
Results:The proposed hs-CRP assay provides a wide analytical range of 0.001-100 mg/L with a detection limit of 0.06 (0.19)μg/L within 1.5 h. The accuracy of the proposed assay has been confirmed for low coefficient of variations (CVs), 2.27% (intra-assay) and 8.52% (inter-assay), together with recoveries of 96.7-104.2%. Bland-Altman plots of 104 clinical samples exhibited good consistency among the proposed assay, commercial high-sensitivity ELISA, and nephelometry, indicating the prospects of the newly developed hs-CRP assay as an alternative to existing hs-CRP assays.
Conclusion:The developed assay meets the needs of the rapid, sensitive and high-throughput determination of hs-CRP levels within a short time using minimal resources. In addition, the developed assay can also be used to detect and quantify other diagnostic biomarkers by immobilizing specific monoclonal antibodies.
Keywords:Cardiovascular disease, C-reactive protein, Fluoroimmunoassay, Quantification, Quantum dots
Background
Serum high-sensitivity C-reactive protein (hs-CRP) is of clinical importance as an independent marker for coron-ary heart disease, with stratifications corresponding to low (< 1 mg/L), moderate (1-3 mg/L), and high (> 3 mg/L) levels of cardiovascular risks [1-3] and insulin resistance [4,5].
Over the last decades, various hs-CRP assays have been developed, including the enzyme-linked immunosorbent assay (ELISA) [6,7], immunoturbidimetry [8],
time-resolved immunofluorimetric assay [9], and mass spec-trometry [10]. Among the assays, mass specspec-trometry- spectrometry-based measurements are the most accurate and have been widely used in proteomics [11]. Immunoturbidime-try assays and time-resolved immunofluorimetric assays provide excellent sensitivity (better than 2.8μg/L) with a detection time of < 1 h [9]. However, these techniques require relatively expensive instrumentation, rigid opera-tional protocols and an inflexible set of reagents. Although ELISAs are frequently performed in most clini-cal laboratories due to low cost and simplicity, the accuracies of traditional ELISAs vary considerably when
the sample concentrations are lower than 1 μg/L.
Although high-sensitivity ELISAs (hs-ELISAs) improve * Correspondence: weilingfu@yahoo.com
1
Department of Laboratory Medicine, Southwest Hospital, The Third Military Medical University, Chong Qing 400038, Peoples’Republic of China Full list of author information is available at the end of the article
the detection sensitivity as low as 0.014μg/L by signal amplification [12-14], the considerably complicated operation protocols limit their wide clinical applications [15]. Fluorescence or chemiluminescence-based techni-ques are useful alternatives in clinical diagnosis because of their high sensitivities, allowing them to detect small amounts of proteins and cytokines [16]. Quantum dots (QDs) are ideal dyes with excellent fluorescence intensity and photobleaching resistance ability and have been uti-lized for the detection of various biological analytes, such as nucleic acids [17-20], proteins [21], cells [22-24], and organic molecules [25]. Recently, Zhu et al. established an hs-CRP assay with QD labeling and immunoaffinity separation [26]. However, this assay is restricted in large-scale clinical sample determination due to its complex operation and stringent reagent requirements. In con-trast, hs-CRP assays, with the ability to sensitively and economically analyze 50-100 samples simultaneously, meet the needs for the rapid and early diagnosis of heart disease. Unfortunately, no such high-throughput QDs-based hs-CRP assays have been reported until now.
In this paper, we report a low cost hs-CRP assay cap-able of analyzing 90 clinical serum samples
simulta-neously. This quantum dot-labeled microplate
immunoassay (QL-MI) combined the features of QD labeling in microplate format, allowing the fluorescence intensity to be read out using a microplate reader, which is available in most clinical laboratories. In a typical QL-MI assay, two monoclonal antibodies (mAbs) against dis-tinct epitopes of hs-CRP were applied to enhance the specificity of the assay. The hs-CRP antigen is captured by the mAb immobilized on the microplate, then the QD565 labeled detection antibody is introduced to form an mAb-Ag-mAb sandwich complex. The induced fluor-escence intensity (FI) is proportional to the concentration of serum hs-CRP. In this study, the optimal operation conditions, including mAb coating concentration and incubation time, are discussed. Furthermore, two formats are designed for different clinical applications. A one-step QL-MI that requires shorter detection time can be applied for large-scale sample screening. Alternatively, a two-step QL-MI, which introduces the QD565 and mAb into the microwells separately, provides improved analy-tical characteristics and can be implemented in routine clinical applications. Methodological evaluation of 104 clinical serum samples confirmed that the proposed hs-CRP assay is highly comparable with existing hs-ELISAs and nephelometry.
Methods
Materials and reagents
All serum samples were collected from the Southwest Hospital (China) between May 2009 and Jan 2010. There were a total of 104 serum samples used in the
study; 68 samples were from healthy individuals under-going a physical health examination, and 36 samples were from patients with various inflammation condi-tions. All participants provided signed informed con-sents, and the study was approved by the Ethics Boards of the Third Military Medical University. In this study, 8 mL of peripheral blood was drawn in the morning after an overnight fast. All of the serum samples were isolated after centrifugation at 3000 rpm for 15 min and then immediately stored at -20°C; repeated freeze-thaw cycles were avoided. Prior to the assay, the frozen samples were brought to room temperature slowly and gently mixed. Next, each sample suspension was divided into four equal portions for analysis by nephelometry, hs-ELISA, one-step QL-MI, and two-step QL-MI.
High-purity CRP from human serum was obtained from EMD Biosciences (La Jolla, CA). CRP control serum was purchased from Beckman Coulter (Brea, CA). The CRP primary monoclonal antibody (clone 3) was obtained from Meridian Life Science (Saco, ME). Anti-CRP (clone 7) was obtained from Santa Cruz (San Fran-cisco, CA). The Human CRP ELISA Kit was obtained from Phoenix Pharmaceutical (Burlingame, CA). Purified human albumin, immunoglobulin G, and hemoglobin were purchased from Pierce (Rockford, IL). The Qdot 565 ITK Streptavidin Conjugate Kit was obtained from Invitrogen (Gaithersburg, MD). Phosphate buffered saline (PBS), bovine serum albumin (BSA), sodium bicarbonate, and other reagents were obtained from Sigma-Aldrich (St. Louis, MO). Ultra-pure water (18.2 MΩ·cm) from Milli-Q (Billerica, MA) was used for the preparation of all solutions and for the cleaning of substrates. A Synergy HT Hybrid Multi-Mode Microplate Reader was obtained from BioTek (Winooski, VT) for fluorescence measure-ments. UV-transparent, clear-bottom microplates (96-well) were obtained from Corning (Lowell, MA). A Microplate Genie mixer from Scientific Industries (Bohe-mia, NY) was used for reagent mixing.
Coating of 96-well microplates with the primary antibody
plastic wells were covered. Then, the microplates were dried and stored at 4°C until use.
Preparation of the standards and biotinylated anti-CRP
High-purity CRP was diluted in a dilution buffer (PBS, pH 7.4, with 0.05% Tween-20) from an original concen-tration of 500 mg/L to concenconcen-trations of 0.001, 0.01, 0.1, 1, 10, and 100 mg/L for use as calibration standards. The preparation of QD-streptavidin conjugates followed the procedure supplied by Invitrogen. Briefly, QD-streptavi-din conjugates were centrifuged at 5000 rpm for 3 min
prior to use. Next, 2 μL of the stock supernatant
(approximately 1μM) was immediately added to 100μL
of the secondary incubation buffer to produce a 20 nM QD-streptavidin conjugate solution. The protocol of anti-CRP biotinylation was supplied by Santa Cruz. Briefly, 10 mg of biotin was dissolved in 1 mL of anhy-drous DMSO immediately before use. Biotin was then mixed with secondary CRP mAb at a concentration ratio
of 80μg/mg (biotin: mAb). After incubation at room
temperature for 4 h, the unreacted biotin was removed, and the conjugated antibody was transferred into the sto-rage buffer by gel filtration or dialysis. The QD-streptavi-din conjugate or biotinylated CRP mAb was diluted using a 20% standard diluent buffer prior to use.
Preparation of QD-antibody complex
The QD-mAb complex was prepared according to the procedure supplied by Invitrogen. Briefly, the monoclonal antibody and the QD-streptavidin conjugate were mixed and incubated with slight stirring at 25°C for 2 h to form the QD-antibody complex. Next, the QD-mAb complex was concentrated and purified prior to collecting the absorbance and fluorescence spectra for the effluent. Sam-ples with an absorbance at 280 nm and no fluorescence at the emission maximum of the QDs contained excess anti-bodies. A Bradford assay was performed to calculate the coupling efficiency by determining the amount of uncoupled antibody. The conjugated antibody concentra-tion was determined by subtracting the amount of uncoupled antibody from the total number of antibodies used in the assay. The induced concentrations of the QD-antibody conjugate were determined accordingly.
Measurement procedures
In each well of a 96-well plate, 100 μL of the solution (serum sample or diluted hs-CRP standard) was incu-bated with the primary mAb that was preabsorbed onto the well at 25°C for 20 min. Each well was then washed three times with wash buffer (PBS buffer, pH 7.4, with 0.05% Tween-20) at 2 min per wash. It is essential in these experiments to place the patient samples and cali-bration standards on the plates in a manner that mini-mizes biased readings to obtain reliable results.
Therefore, these measurements were performed in dupli-cates, and the duplicated samples were placed in different positions on the plate.
For subsequent hs-CRP detection, two assay formats were applied (Figure 1): A) a one-step detection with 50μL of the QD-mAb complex per well at a final concen-tration of 20 nM (Figure 1A) or B) and a two-step format that added 50μL of biotinylated anti-CRP antibody first in each well, followed by three washes and incubation with 50μL/well of QD-streptavidin (Figure 1B). For both assay formats, the microplate was washed three times with wash buffer to remove any unreacted QD-streptavidin complex or QD-mAb complex prior to fluorescence measurements.
Optimization of reaction conditions
To obtain the optimum conditions for our hs-CRP assays, various analytical conditions, including the coated primary monoclonal antibody concentration (1-10 mg/L) and the concentrations of the QD-conjugated
secondary mAb against hs-CRP (0.1-1 mg L-1), were
optimized to achieve an ideal regression coefficient for the standard curve and a high signal-to-noise ratio of fluorescence intensity.
Methodology comparison and clinical sample detection
The operational characteristics, including the precision, specificity, analytical sensitivity, and detection limits, were evaluated to validate the proposed immunoassay. All 104 clinical samples were analyzed for hs-CRP levels using one-step QL-MI, two-step QL-MI, hs-ELISA, and nephelometry (Beckman, Brea CA). Nephelometry and hs-ELISA assays were performed according to the proto-cols provided by the suppliers. Bland-Altman plots were performed with MedCalc (version 11.3) to evaluate the residuals plots of the proposed and reference methods. A statistically significant difference between the fluores-cence intensity induced by various interferents was tested with t-tests. The results were considered statisti-cally significant if the P-value was < 0.05. The calibra-tion curves were plotted using Origin (version 8.1).
Results and discussion
the microplate, a secondary mAb against a different epi-tope of the hs-CRP was added into the microwell to form a mAb-Ag-mAb complex. The adoption of two high-affinity mAbs, targeting distinct epitopes of hs-CRP, potentially eliminates the false-positive signals encountered in traditional ELISAs. According to differ-ences in procedure of introducing the reporter (QD565), we developed the QL-MI assay in two formats: one-step QL-MI and two-step QL-MI.
In the one-step assay (Figure 1A), streptavidin-coated QD565 were preconjugated with the secondary hs-CRP mAbs with a high coupling efficiency (approximately 95%). To investigate the stability of preconjugated QD-antibody complex, the storage time of the complex was studied. No obvious aggregation was observed within three days when stored at 4°C. However, aggregation can be observed in the solution when the storage time increased. Sonication or vortexing resulted in a decreased limit of detection, indicating that the resulting QD-anti-body conjugate was not stable for extended storage peri-ods. We postulate the decreased detection limit is due to the aggregation of the functionalized QDs after gradually losing their colloidal stability in the PBS or the fluores-cence quenching effect by conjugated biomolecules or the remaining chemicals in the solution [27]. We further compared the extent by which the FI reduced over time for CRP detection, QD-streptavidin and QD-mAb stock solution. The results show that the QD-streptavidin
stock solution has almost no obvious FI decrease within 10 days, and the FI for QD-antibody stock solution decreases ~16% of its initial value by day 10 (Figure 2A). However, in case of CRP detection, the corresponding FI decreased ~20% after 5 days of storage and ~45% after 10 days of QD-mAb storage. These results indicate that in addition to the aggregation of the QDs, inactivation of the antibody may also contribute to the decrease in fluor-escence intensity observed over extend storage time. Two reasons may attribute to the decrease in fluorescence: (i) the dissociation of the antibody from the QDs-antibody conjugate and (ii) improper storage conditions (antibo-dies should be stored below -20°C or -80°C to avoid the inactivation of the epitopes, whereas QDs should be kept at 4°C to avoid decrease in fluorescence). For improved results, the fluorescence of the Ab-Ag-Ab complex should be measured immediately, and the longest per-missible storage time should be shorter than one week in PBS buffer (pH 7.4). This shortcoming greatly limits the application of the one-step assay in routine clinical detec-tion, although it can simplify the procedure and reduce analysis time.
[image:4.595.60.539.88.325.2]unbound detection antibodies were washed away by three rinses with wash buffer. Next, the streptavidin coated QD565 was added into the microwell followed by a 10-min incubation to allow the completion of streptavidin-biotin reaction. Lastly, the fluorescence intensity was read out using a microplate reader after washing away any unbound QD-streptavidin. Although the detection time increased by approximately 20 min due to the extra incubation and washing steps, the accu-racy and sensitivity of this format are enhanced by elim-inating the fluorescence decrease caused by the long-term storage of the QD-mAb complex.
Optimization of analytical parameters
Various assay parameters (Figure 2B-D) were optimized for the hs-CRP assay including the concentration of the captured antibody, the incubation time of the hs-CRP antigen, and the concentration of the tagged detection antibody. To simplify the experiment, all our optimiza-tions were performed using the two-step format. Figure 2B shows that the FI increases proportionally with the coating antibody concentration for concentrations lower
than 4 mg/L. The FI reaches a maximum at a coating concentration of 4-6 mg/L and then decreases as the coating concentration becomes higher than 6 mg/L. This behavior is primarily attributed to the steric hin-drance that prevents the formation of the Ag-Ab com-plex between the mAb coating and the hs-CRP antigen when the primary mAb is over-coated. Accordingly, the optimal coating mAb concentration is defined to be 4 mg/L.
Similarly, a time-dependent fluorescence intensity increase was observed when the serum incubation time increased from 5 to 30 min (Figure 2C). According to the combination kinetics between the antigen and the anti-body, the FI reached a maximum at 20 min when a dynamic balance was reached between the coating mAb and the hs-CRP antigen. This balance is confirmed by the slight increase in fluorescence intensity even with a longer incubation time. Thus, 20 min was ascertained as the optimal serum incubation time. Figure 2D reveals that the optimal detection antibody (biotinylated anti-CRP) concentration is 0.6 mg/L. To evaluate the optimal washing procedure, longer incubation times with the wash buffer and higher Tween-20 concentrations were tested. The results showed that none of these changes improved the coefficients of variations (CVs) or elimi-nated the background measurements. The exception was that the introduction of Tween-20 in the wash buffer produced lower background fluorescence signals than the PBS buffer without Tween-20 (data not shown).
Calibration curves and linearity of analytical results
Figure 3 shows that the proposed hs-CRP assay had a lin-earity of 0.001-100 mg/L, and no significant difference was observed in the linearity between the two-step and one-step formats. In the one-step assay, the regression equation had a slope of 0.51 (SD, 0.03) and a y-intercept of 2.93 (SD, 0.04) mg/L with an r2value of 0.991. Simi-larly, in the two-step format, the regression equation had a slope of 0.49 (SD, 0.02) and a y-intercept of 3.12 (SD, 0.03) mg/L with an r2value of 0.994. No significant dif-ference was observed between the two analytical formats of QL-MI assay according to the r2value. For both analy-tical formats, the fluorescence intensity could not be accurately determined at protein concentrations > 100 mg/L due to the lack of curve linearity. To obtain accu-rate results, serum samples with concentrations higher than 100 mg/L should be diluted appropriately (10-fold or more) prior to detection.
Analytical sensitivities and detection limits
[image:5.595.56.292.88.266.2]The limit of detection (signal-to-noise ratio > 3) was calcu-lated by measuring the negative control for 20 consecutive duplicates. The limit of quantification was determined by serially diluting stock solutions with calibrated dilute Figure 2 Influence of storage time (A), immobilization
concentration (B), incubation time (C), and detection antibody concentration (D) on the fluorescence intensity.(A) Fluorescence intensity after different storage times (1-10 d) for the
buffer (pH 7.4). Five replicates were measured for the dilu-tions, and the final diluted concentration, which had a CV < 20% between replicates, was considered the limit of quantification. The results showed that the proposed hs-CRP assay had a limit of detection of 0.06μg/L and a limit of quantification of 0.19μg/L (CV < 8%). Thus, the sensi-tivity of the assay developed in this experiment is higher than that of traditional ELISAs or other chemilumines-cence assays [28] and is comparable to that of hs-ELISAs [13,29] or previously reported QD-based immunoassays [26]. For the two-step format assay, a detection limit of 0.21μg/L and a quantification limit of 0.65μg/L (CV < 6%) were obtained. The difference in sensitivity between the two-step and one-step formats is derived from the slight degradation of the preconjugated QD-mAb complex with time.
Imprecision and accuracy
Duplicate tests were performed detecting very low (0.03 mg/L), low (0.3 mg/L), medium (3 mg/L), and high con-centrations (30 mg/L) of CRP in quality control samples. For every sample, the tests were repeated 20 times within 1 day for intra-assay analysis and on 20 consecu-tive days in the same manner (mean of 3 duplicates per day) for inter-assay analysis. The mean intra-assay and inter-assay CVs were 2.27% and 9.52% for the one-step format, respectively, together with 1.75% and 2.17% for the two-step format, respectively. Our data showed that the intra-assay results in the two assay formats were almost identical, whereas the inter-assay variability of the one-step format was much higher than that of the two-step format. This is perhaps due to the significant fluorescence variability of the QD-mAb complex after
long-term storage in the one-step assay, whereas the QD-streptavidin conjugate can retain highly stable fluor-escence properties even when stored for a longer period of time in case of the two-step assay.
Recovery measurements were performed to assess the overall accuracy of the QD-based assay. The serum sam-ples were spiked with a known amount of standard hs-CRP for analysis, and standard hs-hs-CRP concentrations covered the low, medium, and high-risk patient levels. Table 1 shows that all of the recovery rates were within the range of 96.7-104.2%, and no significant differences in fluorescence intensity were observed between the two assays (p> 0.01).
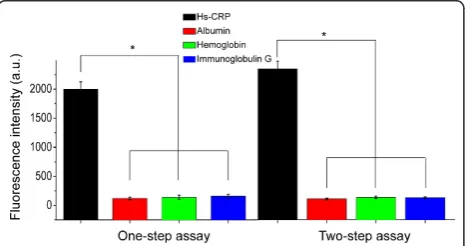
Specificities of the QL-MI
Cross-reaction tests were performed by adding 100μL
of 10 mg/L interferent (albumin, immunoglobulin G, and hemoglobin) to the detection wells. The results showed that the fluorescence intensity induced by a spe-cific Ag-Ab combination (1800 a.u. for 10 mg/L of CRP serum) was significantly stronger than that (average of ~5.6 a.u. with the range of 2.2-9.8 a.u.) from a nonspeci-fic interaction (p < 0.05). These weak, nonspecific sig-nals may be attributed to the background fluorescence interference caused by the autofluorescence of specific biomolecules in the serum matrix, which can be elimi-nated by introducing a reagent blank control consisting of the serum matrix without any hs-CRP. These results indicate that the proposed hs-CRP assay provides extre-mely high specificities, and no significant difference was observed between the two-step and one-step assays (p< 0.05) (Figure 4).
Clinical sample detection and comparison
For methodology evaluation, 104 clinical serum sam-ples were analyzed by ELISA, nephelometry, and the two proposed QL-MI assays. The precision results obtained from our proposed QL-MI assay are better than those of many automated hs-CRP methods [30-32]. We used the Bland-Altman difference plot analysis to compare the four diagnostic strategies: one-step MI with hs-ELISA (Figure 5A), two-one-step QL-MI with hs-ELISA (Figure 5B), one-step QL-QL-MI with nephelometry (Figure 5C), and two-step QL-MI with nephelometry (Figure 5D).
Compared with hs-ELISA, the Bland-Altman difference plot of the one-step QL-MI showed a mean (SD)
differ-ence (QL-MI minus hs-ELISA) of 25.48 (11.3)μg/L, and
[image:6.595.56.291.88.189.2]the range for the limits of agreement (d-1.96 S to d + 1.96 S, -201.2 to 150.2μg/L) was sufficiently narrow. The two-step QL-MI provided a similar difference of 29.04 (8.5)μg/L, and the agreement limits (-196.9 to 133.8μg/ L) were sufficiently narrow. Similarly, the one-step QL-MI provided a difference of 14.71 (8.2)μg/L and a narrow Figure 3Calibration curves for hs-CRP detection; 0.001, 0.01, 0.1,
range of limits (-175.6 to 146.1μg/L) when compared with nephelometry. The two-step QL-MI provided a slight difference of 18.27 (7.4)μg/L and a narrow range
of limits (-236.4 to 199.9 μg/L) when compared with
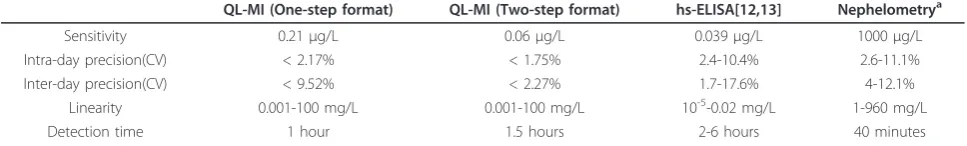
nephelometry. These data suggest good consistency and clinical equivalence between the proposed hs-CRP assay and hs-ELISA or nephelometry. Table 2 summarizes a brief comparison of the advantages and disadvantages among these four assays. The hs-ELISA assay provides the best sensitivity among these four assays [12,13], whereas the nephelometry provides the shortest analyti-cal time [33]. Compared with these two methods, our proposed QL-MI assays provide satisfactory analytical characteristics with a similar sensitivity to hs-ELISA and a shorter turnaround time.
In addition to its high accuracy and sensitivity, the QL-MI method allows for high-throughput detection and automation. For the proposed hs-CRP assay, all of the operating procedures, including sample introduction, incubation, vortexing, washing, and fluorescence mea-surement, can be completed automatically by either a microplate reader or autoanalyzer. In addition, the
96-well microplate format is capable of simultaneously determining more than 90 samples in 1.5 h. This analy-tical time could even be shortened to < 1 h in a one-step format, making the entire process much faster than existing mass spectroscopy-based assays. Our future research is aimed at further improvements in through-put and standardization of the entire analytical process.
Conclusions
[image:7.595.58.539.100.177.2]A rapid and sensitive hs-CRP assay for the high-through-put determination of trace serum hs-CRP was developed by combining commercially available microplates and quantum dots labeling. The ability to read out the fluor-escence signals conveniently using a microplate reader makes the proposed immunoassay an attractive candidate for large-scale CRP determination in various clinical laboratories even without the use of an autoanalyzer. This assay also provides the prospect for the high-throughput detection of other biomarkers by coating the microplate with specific monoclonal antibodies and by
Table 1 Recoveries of QL-MI (n = 20)
Original sample conc. (mg/L) Added conc. (mg/L) Recovered conc. (mg/L) Recovery (%)
one-step format two-step format one-step format two-step format
0.91(0.01)a 0.89(0.05) 0.87(0.04) 98.92(1.34) 96.73(1.27)
6.32(0.07) 5.01(0.09) 5.21(0.07) 4.89(0.06) 104.21 (2.11) 97.81(2.48)
20.31(0.15) 20.82(0.18) 20.03(0.13) 102.62(2.14) 98.72(3.06)
150.01 (2.25) 154.23 (4.12)b 146.64(2.13)b 102.82(3.21) 97.81(2.76) a
Numbers in parentheses denote the standard error of 20 replicated tests b
These samples were diluted 10-fold before analysis
[image:7.595.304.540.475.633.2]Figure 4Cross-reaction of the two assay formats; 100μL of a 10 mg/L solution of albumin (red column), hemoglobin (green column), and immunoglobulin G (blue column) were introduced into the coating antibody-immobilized microplate to perform the cross-reaction. No significant differences were observed between the fluorescence intensities induced by albumin, hemoglobin, and immunoglobulin G. However, the fluorescence intensities induced by nonspecific binding were significantly lower than those induced by the specific hs-CRP antigen in the one-step assay (p< 0.05) and in the two-step assay (p< 0.05). Error bars indicate the standard errors of 3 independent experiments.
[image:7.595.58.294.491.614.2]simply scaling up the 96-well microplate to a 384-well or higher microplate formats.
Abbreviations
BSA: Bovine serum albumin; CV: Coefficients of variation; ELISA: Enzyme-linked immunosorbent assay; FI: Fluorescence intensity; hs-CRP: High-sensitivity c-reactive protein; hs-ELISA: High-High-sensitivity ELISA; mAbs: Monoclonal antibodies; PBS: Phosphate buffered saline; QD: Quantum dot; QL-MI: Quantum dot-labeled microplate immunoassay; SD: Standard deviation.
Acknowledgements
This study was supported in part by grants from the National Natural Science Foundation of China (30900348, 30927002), the Fujian Key Lab of Medical Instrument and Pharmaceutical Technology Foundation (09001), the Science and Technology Planning Project of Chongqing, China (CSTC 2010AA5042), and the Foundation of the Scientific Research of the Third Military Medical University (2010XZH08). The authors also thank Mr. Mainul Hossain and Ms. Yu-ting Fan for their assistance in the proofreading of this manuscript.
Author details
1Department of Laboratory Medicine, Southwest Hospital, The Third Military
Medical University, Chong Qing 400038, Peoples’Republic of China.
2Department of Laboratory Medicine, Daping Hospital, The Third Military
Medical University, Chong Qing 400040, Peoples’Republic of China.
3Department of Transfusion Medicine, Southwest Hospital, The Third Military
Medical University, Chong Qing 400038, Peoples’Republic of China. Authors’contributions
YL have made substantial contributions to conception and design, data acquisition, analysis and data interpretation and are involved in drafting and revising the manuscript. WF has made substantial contributions to conception and design. BZ, MC, TJ, DZ, JH have made substantial contributions to data acquisition, analysis and data interpretation. Moreover, each author has taken public responsibility for appropriate portions of the content. All authors read and approved the final manuscript.
Competing interests
The authors declare that they have no competing interests.
Received: 23 November 2011 Accepted: 6 February 2012 Published: 6 February 2012
References
1. Sabatine MS, Morrow DA, de Lemos JA, Gibson CM, Murphy SA, Rifai N, McCabe C, Antman EM, Cannon CP, Braunwald E:Multimarker approach to risk stratification in non-ST elevation acute coronary syndromes: simultaneous assessment of troponin I, C-reactive protein, and B-type natriuretic peptide.Circulation2002,105:1760-1763.
2. Danesh J, Wheeler JG, Hirschfield GM, Eda S, Eiriksdottir G, Rumley A, Lowe GD, Pepys MB, Gudnason V:C-reactive protein and other circulating markers of inflammation in the prediction of coronary heart disease.N Engl J Med2004,350:1387-1397.
3. Ridker PM, Hennekens CH, Buring JE, Rifai N:C-reactive protein and other markers of inflammation in the prediction of cardiovascular disease in women.N Engl J Med2000,342:836-843.
4. Kim SH, Reaven G, Lindley S:Relationship between insulin resistance and C-reactive protein in a patient population treated with second generation antipsychotic medications.Int Clin Psychopharmacol2011,
26:43-47.
5. Pradhan AD, Manson JE, Rifai N, Buring JE, Ridker PM:C-reactive protein, interleukin 6, and risk of developing type 2 diabetes mellitus.JAMA 2001,286:327-334.
6. Wu TL, Tsai IC, Chang PY, Tsao KC, Sun CF, Wu LL, Wu JT:Establishment of an in-house ELISA and the reference range for serum amyloid A (SAA): complementarity between SAA and C-reactive protein as markers of inflammation.Clin Chim Acta2007,376:72-76.
7. Kjelgaard-Hansen M, Kristensen AT, Jensen AL:Evaluation of a
commercially available enzyme-linked immunosorbent assay (ELISA) for the determination of C-reactive protein in canine serum.J Vet Med A, Physiol, Pathol, Clin Med2003,50:164-168.
8. Sisman AR, Kume T, Tas G, Akan P, Tuncel P:Comparison and evaluation of two C-reactive protein assays based on particle-enhanced immunoturbidimetry.J Clin Lab Anal2007,21:71-76.
9. Ceron JJ, Martinez-Subiela S, Caldin M, Parra MD, Ottolini N, Bertolini G, Bernal LJ, Garcia-Martinez JD:Canine C-reactive protein measurements in cerebrospinal fluid by a time-resolved immunofluorimetric assay.J Vet Diagn Invest2011,23:63-67.
10. Kilpatrick EL, Liao W, Turko IV, Camara JE, Dodder NG, Bunk DM:
Quantification of C-reactive protein in human serum with affinity purification and isotope-dilution tandem mass spectrometry.Clin Chem 2009,55:A205-A206.
11. Muddiman DC, Williams DK:Absolute quantification of c-reactive protein in human plasma derived from patients with epithelial ovarian cancer utilizing protein cleavage isotope dilution mass spectrometry.J Proteome Res2009,8:1085-1090.
12. Dixit CK, Vashist SK, MacCraith BD, O’Kennedy R:Multisubstrate-compatible ELISA procedures for rapid and high-sensitivity immunoassays.Nat Protoc2011,6:439-445.
13. Dixit CK, Vashist SK, O’Neill FT, O’Reilly B, MacCraith BD, O’Kennedy R:
Development of a high sensitivity rapid sandwich ELISA procedure and its comparison with the conventional approach.Anal Chem2010,
82:7049-7052.
14. Yamamori H, Khatoon S, Grundke-Iqbal I, Blennow K, Ewers M, Hampel H, Iqbal K:Tau in cerebrospinal fluid: a sensitive sandwich enzyme-linked immunosorbent assay using tyramide signal amplification.Neurosci Lett 2007,418:186-189.
15. Danese A, Ouellet-Morin I, Williams B, Arseneault L:Validation of a high-sensitivity assay for C-reactive protein in human saliva.Brain Behav Immun2011,25:640-646.
16. Sok D, Clarizia LJ, Farris LR, McDonald MJ:Novel fluoroimmunoassay for ovarian cancer biomarker CA-125.Anal Bioanal Chem2009,393:1521-1523. 17. Lu H, Schops O, Woggon U, Niemeyer CM:Self-assembled donor
comprising quantum dots and fluorescent proteins for long-range fluorescence resonance energy transfer.J Am Chem Soc2008,
130:4815-4827.
18. Chen L, Algar WR, Tavares AJ, Krull UJ:Toward a solid-phase nucleic acid hybridization assay within microfluidic channels using immobilized quantum dots as donors in fluorescence resonance energy transfer.Anal Bioanal Chem2011,399:133-141.
[image:8.595.56.540.102.175.2]19. Shaheen SM, Akita H, Yamashita A, Katoono R, Yui N, Biju V, Ishikawa M, Harashima H:Quantitative analysis of condensation/decondensation status of pDNA in the nuclear sub-domains by QD-FRET.Nucleic Acids Res 2011,39:e48.
Table 2 Comparison of proposed QL-MI assay with hs-ELISA and nephelometry
QL-MI (One-step format) QL-MI (Two-step format) hs-ELISA[12,13] Nephelometrya
Sensitivity 0.21μg/L 0.06μg/L 0.039μg/L 1000μg/L
Intra-day precision(CV) < 2.17% < 1.75% 2.4-10.4% 2.6-11.1%
Inter-day precision(CV) < 9.52% < 2.27% 1.7-17.6% 4-12.1%
Linearity 0.001-100 mg/L 0.001-100 mg/L 10-5-0.02 mg/L 1-960 mg/L
Detection time 1 hour 1.5 hours 2-6 hours 40 minutes
a
20. Niu S, Li Q, Qu L, Wang W:Nicking endonuclease and target recycles signal amplification assisted quantum dots for fluorescence detection of DNA.Anal Chim Acta2010,680:54-58.
21. Qian J, Dai H, Pan X, Liu S:Simultaneous detection of dual proteins using quantum dots coated silica nanoparticles as labels.Biosens Bioelectron 2011,28:314-319.
22. Di Corato R, Bigall NC, Ragusa A, Dorfs D, Genovese A, Marotta R, Manna L, Pellegrino T:Multifunctional nanobeads based on quantum dots and magnetic nanoparticles: synthesis and cancer cell targeting and sorting.
ACS Nano2011,5:1109-1121.
23. Roederer M, Chattopadhyay PK, Price DA, Harper TF, Betts MR, Yu J, Gostick E, Perfetto SP, Goepfert P, Koup RA,et al:Quantum dot semiconductor nanocrystals for immunophenotyping by polychromatic flow cytometry.Nat Med2006,12:972-977.
24. Nie SM, Liu JA, Lau SK, Varma VA, Kairdolf BA:Multiplexed Detection and Characterization of Rare Tumor Cells in Hodgkin’s Lymphoma with Multicolor Quantum Dots.Anal Chem2010,82:6237-6243.
25. Willner I, Freeman R, Finder T, Gill R:Probing Protein Kinase (CK2) and Alkaline Phosphatase with CdSe/ZnS Quantum Dots.Nano Lett2010,
10:2192-2196.
26. Zhu X, Duan D, Publicover NG:Magnetic bead based assay for C-reactive protein using quantum-dot fluorescence labeling and immunoaffinity separation.Analyst2010,135:381-389.
27. Kerman K, Endo T, Tsukamoto M, Chikae M, Takamura Y, Tamiya E:
Quantum dot-based immunosensor for the detection of prostate-specific antigen using fluorescence microscopy.Talanta2007,
71:1494-1499.
28. Miao WJ, Wang SJ, Harris E, Shi JA, Chen A, Parajuli S, Jing XH:
Electrogenerated chemiluminescence determination of C-reactive protein with carboxyl CdSe/ZnS core/shell quantum dots.Phys Chem Chem Phys2010,12:10073-10080.
29. McBride JD, Cooper MA:A high sensitivity assay for the inflammatory marker C-Reactive protein employing acoustic biosensing.J Nanobiotechnol2008,6:5.
30. Roberts WL, Moulton L, Law TC, Farrow G, Cooper-Anderson M, Savory J, Rifai N:Evaluation of nine automated high-sensitivity c-reactive protein methods: implications for clinical and epidemiological applications. Part 2.Clin Chem2001,47:418-425.
31. Lolekha PH, Chittamma A, Roberts WL, Sritara P, Cheepudomwit S, Suriyawongpaisal P:Comparative study of two automated high-sensitivity C-reactive protein methods in a large population.Clin Biochem2005,
38:31-35.
32. Roberts WL, Sedrick R, Moulton L, Spencer A, Rifai N:Evaluation of four automated high-sensitivity C-reactive protein methods: implications for clinical and epidemiological applications.Clin Chem2000,46:461-468. 33. Price CP, Trull AK, Berry D, Gorman EG:Development and Validation of a
Particle-Enhanced Turbidimetric Immunoassay for C-Reactive Protein.J Immunol Methods1987,99:205-211.
doi:10.1186/1479-5876-10-24
Cite this article as:Luoet al.:Sensitive and rapid quantification of C-reactive protein using quantum dot-labeled microplate immunoassay.
Journal of Translational Medicine201210:24.
Submit your next manuscript to BioMed Central and take full advantage of:
• Convenient online submission
• Thorough peer review
• No space constraints or color figure charges
• Immediate publication on acceptance
• Inclusion in PubMed, CAS, Scopus and Google Scholar
• Research which is freely available for redistribution