RIT Scholar Works
Theses Thesis/Dissertation Collections
4-28-1997
The Relationship between social intelligence and
behavioral functioning in students with learning
disabilities
James Vreeland
Follow this and additional works at:http://scholarworks.rit.edu/theses
This Thesis is brought to you for free and open access by the Thesis/Dissertation Collections at RIT Scholar Works. It has been accepted for inclusion in Theses by an authorized administrator of RIT Scholar Works. For more information, please [email protected].
Recommended Citation
Functioning in Students With Learning Disabilities
Master's Thesis
Submitted to the Faculty
Of the School Psychology Program
College of Liberal Arts
ROCHESTER INSTITUTE OF TECHNOLOGY
By
James S. Vreeland
In Partial Fulfillment of the Requirements
for the Degree of
Master of Science
Rochester, New York
Approved:
April 28, 1997
James B. Hale, Ph. D. (Committee Chair)
Gerald T. Guild, Ph. D. (Committee Member)
Dean:, _
Wiliam Daniels, Ph. D., Dean
College of Liberal Arts
.SchoOI Psychology Program Permission to Reproduce Thesis
PERMISSION Title f thesis,
II
Signature of Author: Date: _-+--:''--1""'''''-_ _
I James S. Vreeland hereby grant permission to the
Wallace Memorial Library of the Rochester Institute of Technology to reproduce my thesis in wh e or in part. Any reproduction will not be for commercial use or profit.
PERMISSION FROM AUTHOR REQUIRED
Title of thesis _
I prefer to be contacted each time a
request for reproduction is made. I can be reached at the following address:
PHONE: _
Date: _ Signature of Author: _
PERMISSION DENIED
TITLE
OF
THESIS _I hereby deny permission to theWallace
Memorial Library of the Rochester Institute of Technology to reproduce my thesis in whole or in part.
Clinicians suggest that differences between the nonverbal Picture Arrangement (PA)
and verbal Comprehension (C) WISC subtests reflect poor social perception,
understanding, or action. In this study, data from 79 children with learning
disabilities were subjected to repeated measures MANOVA to examine PAandC
social sensitivity. Although PA and C scores correlated minimally with Teacher (TRF) and Parent (CBCL) reportedbehaviorproblems, those who scored significantly
higher on PA thanC (PA >C) displayed more TRF Internalizing, Withdrawal, Social,
and Thought Problems than the C > PA group. ThePA> C group had moreTRF
Withdrawal and Thought Problems than the PA =Ccontrol group. GroupC =PA
displayed more Total and Delinquencyproblems thanC > PA andPA>C.
Implications willbe discussed.
All rights reserved.
The author would like to thank both Dr. HaleandDr. Guild for guidingme through
this process, andfor havinga great dealofpatiencealongthe way.Mydeepest
gratitude must also be extended to my wife, Brenda, for providing her expertise in graphic design withthe layoutof theTables and presentation ofthis thesis.
I. Title Page i
II. Abstract ii
IE. Copyright Page iii
IV. Acknowledgements iv
V. TableofContents v
VI. Literature Review. 1
A. BehaviorRatingScales 4
B. ObservationalMeasures 5
C. Information-ProcessingScales 6
VII. Methods 11
A. Subjects 11
B. Procedure 12
VIII.Results 13
IX. Discussion 21
A. RelationshipBetweenGroupandCBCL 22
B. TRFInternalizingScale 23
C. TRF Thought Disorders Social and Withdrawn BehaviorScales 24
D. TRFTotalandDelinquencyProblemsScales 25
LITERATURE REVIEW
Assessment of behavioral functioning is a common andrequired practice of a
school psychologistin a public school setting. Referrals from teachers, staff, and parents often involve some type ofbehavioral concern or component. The
psychologist evaluates child behavioral functioning using multiple data sources, as
well as examines the causes and consequences ofreported concerns, and develops a
remediation plan in collaboration with the multidisciplinary team. The potential
causes ofbehavior problems aremultidimensional, but may be affected by perception of self and the environment (Erickson, 1992; Merrell, Cedeno, & Johnson, 1993; Nicol, 1985).
Perceptions of self and the environment, or social perception, are significantly
related to behavioral functioning and social interactions in the school setting (Erickson, 1992; Merrell et al. 1993; Strain,Guralnick, &Walker, 1986; Vaughn & Haager, 1991). Childrenwith learning disabilities may have perceptual or cognitive deficits thatimpair not only academic performance, but social functioning as well (Vaughn &Haager, 1991). Socialskills, the behavioral component of social
perception, are the specific behaviors exhibited during interpersonal interactions (McFall, 1982). Several studies have examined social skill deficits in students with learningdisabilities, with results suggesting thatas many as 75% exhibiting some type of social skill deficit (Kavale &Forness, 1996). Thosewith stronger verbal skills
than nonverbal skills (nonverbal learning disabilities) are especially at risk for
psychosocial disturbance (Fuerst, Fisk, &Rourke, 1990) possiblydue to poor fluid abilities or novel problem-solving abilities (Hale, 1994). In addition,social skills
deficits displayed in early childhood often continue throughout the developmental
Pederson, Babigan, Izzo, & Trost, 1973; Strain, et al. 1986). As a result,children with
learning disabilities are at risk for dropping out of high school,juvenile delinquency
and chronic unemployment (Merrell, 1994).
Social intelligence or competence, and academic achievement are interrelated
in areciprocal manner (Dishion, 1990). For example,during early adolescence, a
positive relationship exists between the level of social responsibility an individual
exhibits and academic performance (Wentzel, 1991). Furthermore, children who
exhibitprosocial behaviorsand, as a result,are more likely tobe acceptedbypeers,
tend to be high achievers (Dishion, 1990; Green, Forehand, Beck, & Vosk, 1980). On the contrary, children who are sociallyrejected tend to be at a greater risk
foracademicfailure (Dishion, 1990; Green et al. 1980). For example,reading
achievement has been found to be affected by behavioral functioning in elementary
children (Vaughn, Hogan, Lancelotta, Shapiro, & Walker, 1992). Though the
direction ofthis relationship is notfullyunderstood, ithas been suggested that the level of achievement may determine the level of social competence (Bursuck &
Asher,1986). Yet othershave suggested thatspecifictypes oflearning disabilities
may precipitate academic andbehavior problems(Fuerst, et al. 1990).
Given the evidence supporting the importance ofunderstanding the
relationship between social intelligence or competence and behavior in an academic setting, itis necessary toestablish a clear understanding of a definitionofthis
construct. The terms social skills, social competence,social intelligence and social
perception have been used interchangeably in research, often resulting in confusion to the reader and confoundingstudy results (Strain, et al. 1986). Socialperception has been definedas the ability tojudge a socialsituation, as compared to acting
Early researchin this area revealed variable definitions of social competence,
resulting in inconsistent attempts at measuring this construct (Anderson & Messick, 1974; Hops, 1983;Zigler &Trickett, 1978).
Poor definitions of social competence lead to difficulties in construct
measurement and researchdesign. Definitions such as an ability to readily
recognize and identify the significance andmeaning of the behavior of others have been provided, yet do not provide for observable and measurablebehaviors
(Johnson & Myklebust, 1976). Another example of an non-measurable definition is
the ability to recognize and interpret the nonverbal aspects of communication
which may indicate the feelings, attitudes, and intentions of another (Griffen, 1968; Lerner,1976).
Further attempts at developing observable and measurable behaviors
indicative of social intelligence or competence appeared to have been more
successful. Gresham's (1983) definition, which states thatbehavior canbe considered socially competent if it predicts important socialoutcomes for an individual, may provide for more reliable measurement of this construct. However, itdid not appeartoreflect the complexity ofthe socialintelligence
construct. Further specificity ofthese social outcomes haveresulted in more clearly
observservable and measurablebehaviors which may be indicative of social
intelligence or competence. These outcomes include peer acceptance, friendships,
significant
others'
judgment of social skills, positive feelings ofself-worth, academic
achievement, and positive adaptation to school, home and community
environements, all of which provide for more ecological validity (Gresham, 1995). Building upon the importance ofspecific outcomes as beingmeasures of
developedbyCavell (1990). This model was comprised of three specific
components, and appeared to provide a more accurate description of specific
behaviors purportedly reflective of social competence. According to this model,
social adjustment is a measure of the current achievement of age-appropriate
behaviors and goals,and social perceptionis the abilityto perform a certain social
task. Finally, social skills are those overtbehaviors the individual engages in during
various social interactions and situations. This approach could enable psychologists
and other social scientists to establish scales and measures of social intelligence or
competence with direct implications for intervention.
Behavior Rating Scales
There are several measures and scales available that purport to evaluate the
construct of social competence, including behavior rating scales, observational
measures, and information-processing techniques. Examples ofbehavior rating
scales include the Walker-McConnell Scales of Social Competence and School
Adjustment (Walker & McConnell, 1988), School Social Behavior Scales (Merrell,
1993), Kohn Social Competence Scale (Kohn, 1986), Waksman Social Skills Rating
Scale (Waksman, 1983), and Social Skills RatingSystem (Gresham & Elliott, 1990),
the latter containing a self-reportform completed by thechild.
Although behavior rating measures possess strong discriminant and
construct validity for social competence, limitations do exist (McConaughy& Ritter,
1995). For example, the Walker-McConnell Scales of Social Competence and School
Adjustment, which measures a set of specific behaviors related to social competence
in K-12 students (such as socialrelationships, sensitivity to others, empathy,
cooperation, classroom demeanor, and self-restraint) did not discriminate socially
disabilities from control subjects (Tur-Kaspa &Bryan, 1995). In addition, an
evaluation of the Walker-McConnell Scales manual revealed limited statistical
analyses ofvalidity (Demaray, etal. 1995), such asthe use of smallvaliditysample
sizes, non-representative standardization norms, and unclear presentation of
analyses.
The School Social Behavior Scales, another example of a behavior rating
scale of social competence,assesses several specificbehavior domains ofK-12
students, including skills in self-management, academic performance, and
interpersonal abilities, as well as antisocial behaviors such as hostility, aggression,
and disruptive behavior (Emerson, Crowley,&Merrell, 1994). Evidence suggests
that this scale of social competence has high internal consistency, and adequate
discriminant validity between regular education students, and students with
behavior disorders or other special education students (Emerson et al. 1994; Merrell,
1994). However, the School Social Behavior Scales does not measure and/or account
for behaviors such as anxiety ordepression,which may alsointerfere with adequate
social functioning (Merrell, 1994).
Observational Measures
Other measures of social competence or intelligence include the use of
observational techniques, which also have a variety of limitations that may directly
affect their validity. In addition, non-normative data on specified behaviors,
single-setting data, and poorly constructed measurement systems could limit the vailidity
ofthe results (Merrell, 1994). Measurable definitionsof the observed target
behaviors must be made clear, observer influence on subject must be minimized,
and observer training on the measurement techniques needs to be implemented in
The Behavioral Assertiveness Test (Eisler, Hersen, & Miller, 1973),an
observational technique used to assess social skills in an analog setting, requires
subjects to role-play specific interactions using both assertive and non-assertive
behaviors. These videotapes aresubsequently reviewedby brained raters for target
behaviors, specifically behaviors reflecting social skills or competence. Research on the Behavioral Assertiveness Test indicates strongconstruct validity in clinical settings, such as residential treatment facilities (Bornstein, Bellack, & Herson, 1977; Merrell, 1994), although it is not intended for observational use in the classroom
due to the analog format (Merrell, 1994).
The State-Event Classroom Observational System (SECOS; Saudargas & Slate, 1980) is another example of an observational technique used for measuring social competence. The SECOSutilizes a coding system for observable state and event classroom behaviors occurring within specified time intervals (Saudargas & Lentz, 1986). Researchon the SECOS suggests varying discriminantvalidity among
disabled and control groups. Despiteevidence indicating adequatediscriminant
validity between students withbehavior disorders, who exhibitacting-out or
inappropriate behaviors, from behaviors of regular peers (Slate & Saudargas, 1986a), the SECOS did not adequately discriminate students withlearning disabilities from average students (Slate &Saudargas, 1986b). Though research onlearning
disabilities has not been undertaken, the State-Event Behavior Observation Form
(SEBOF; Guild, 1997) mayreveal important differences because it utilizes a behavior coding system forboth targetand control subjects. This allows for directcomparison
of students within specific time and setting events.
Information-Processing Scales
information-processing scales such as the Profile ofNonverbal Sensitivity (PONS) tests, which assesses the ability to decode or understand various facets of nonverbal
communication, such as facial expressions and body language (Bryan, 1977).
Evidence suggests that thePONS adequatelydiscriminates the ability to comprehend
nonverbal communication among students with learning disabilities and subjects without learning disabilities, for both elementary level students (Bryan, 1977) and adolescents (Creasey &Jarvis, 1987). In addition, results from the PONS indicate that students with learning disabilities show improvement in their ability to decode nonverbal messages from age 11 to 17, yetthey continue to showless abilitythan
their non-disabled peers (Jackson, Enright, &Murdock, 1987). The PONSis related
to other purported measures of social competence orintelligence, such as the
Wechsler Intelligence Scale for Children-Revised (WISC-R) Comprehension and
Picture Arrangement subtest (Reiff&Gerber, 1990), butnot the Behavior Problems
Checklistscales ofSocial Competence (Stone& LeGreca, 1984).
The Minnesota Test ofAffective Processing (MN-TAP) is another
information-processing measure of social intelligence (Lai & Shapiro, 1990). This scale consists of three broad sections, or subscales, involving visual and auditory presentations of emotional expression. Pictures and videotapes offacial andbody
gestures are presented for the visual subscale, and audiotapes of spoken information
comprise the auditory subscale. Research reveals a strong relationship between
deficits on social skills ratings and MN-TAP scores. In children withlearning
disabilities, low MN-TAPscores and social skills ratingswere associated withscores
on the WISC-III Performance scale.
In addition to the use of behavior rating scales, observational measures, and
assess social intelligence or perception. The Wechsler Scales (Wechsler,1991;
Wechsler, 1974; Wechsler, 1949) include two specific subtests,Comprehension and
Picture Arrangement, which purport to measure understanding ofand an ability to
act upon everyday social situations (Sattler, 1992;Sattler, 1979). Bothofthese subtests
have been found tobe related to social perception (Reiff& Gerber, 1990),as well as
social intelligence andjudgment (Sipps, Berry,&Lynch, 1987; Kaufman, 1994;
Kaufman, 1979). The Comprehension subtest reportedly measures understanding of
social conventions (Allison, Blatt, & Zimmer, 1988; Sattler, 1992), common-sense
judgment of everyday situations (Glasser & Zimmerman, 1967; Kaufman, 1994;
Kaufman, 1979; Kellerman & Burry, 1997; Sattler, 1992;), interpersonal maturity
(Brannigan, 1975) and social competence (Krippner, 1964; Lipsitz, Dworkin, &
Erlenmeyer-Kimling, 1993; Lipsitz, 1992). The Picture Arrangement subtest ofthe
Wechsler scales has beenpurported to measure an ability to understand cause and
effect relationships in social interactions (Allison et al. 1988; Kaufman, 1994;
Kaufman, 1979; Sattler,1992; Sattler, 1982), knowledge of interpersonal relationships
(Kellerman & Burry, 1997), social alertness and awareness (Glasser & Zimmerman,
1967).
In addition to the specific abilities purportedly tappedby the Comprehension
and Picture Arrangement subtests, significantdifferences between subtestscores may
be indicative of a deficit in social intelligence or competence. A significantly higher
score on the Comprehension subtest as compared to the Picture Arrangement
subtest may indicate anunderstanding of social situations, but a deficit in acting
upon them in an acceptable manner (Allison, et al. 1967; Sattler, 1992; Sattler,1982).
A higher score on the Picture Arrangementsubtest as compared to the
disregard for accepted social conventions (Allison, et al. 1967; Sattler, 1992; Sattler,
1979). In other words, an individual mayaccurately interpretthe socialbehavior of
others, yet fail torespond in a socialy acceptable manner.
Although many in clinical practice accept that these measures tap social
intelligence, evidence supporting these hypotheses has been limited or
contradictory. A comparison of children classified as learning disabled and behavior
disordered revealed children with behavior disorders performed lower on both the
WISC-R Comprehension and Picture Arrangement subtests (Vance, Fuller, &Ellis,
1983). Additional WISC-R Comprehension and Picture Arrangment subtest
analyses revealed a greater rate ofbehavior problems instudents with learning
disabilities who has higher Picture Arrangement than Comprehension scores
(Wickers & O'Sheel, 1983). When compared to teacher ratings on a non-published
scale of social maturity, which included academic, interpersonal, and emotional
items, a negative relationship was found with the WISC Picture Arrangement
subtest (Brannigan, 1975). Similarly, whencompared to teacher ratings ofSocial Age
on the Vineland Social MaturityScale, a negative relationship was found with the
WISC Picture Arrangement subtest (Krippner, 1964). Scores onthe
Marlowe-CrowneSocial DesirabilityScale (Crowne & Marlowe, 1960), a measure thatindicates
the number ofsocially desirable responses, were not related to the Wechsler Adult
Intelligence Scale-Revised (WAIS-R) Picture Arrangement subtest (Nobo & Evans,
1986; Ramos &Die, 1986). In addition, thesubtest was not relatedto theJackson
Personality Inventory, whichpurportedly assesses conformity, social self-esteem,
and interpersonal skills (Nobo & Evans, 1986), nor to scores on non-standardized
Although the Comprehension subtest of the Wechsler scales maypossess
more characteristics ofsocial competence than the Picture Arrangement subtest
(Lipsitz, 1992), research results have been contradictory. When compared to the
Marlowe-Crowne Need For Approval scale (Crowne & Marlowe, 1960), a measure of
social skills, no significant relationship was found with scores on the WAIS
Comprehension subtest (Dickstein & MacEvitt, 1971). In support of thesefindings,
scores onthe JacksonPersonality Inventory indicated a lackof a positive
relationship with WAIS-R Comprehension subtest scores (Nobo & Evans, 1986).
In the current investigation, the relationship between social intelligence and
behavioral functioning in students with learning disabilities was investigated
utilizing the widely-used WISC-III Comprehension and Picture Arrangement
subtests. Specifically, the analyses of the relationship between the level of social
intelligence and the presence ofbehaviorproblems was investigated. Itwas
hypothesized that the presence of a deficit in social intelligence or perception would
increase the likelihood of parent and teacher-reportedbehavior problems. Research
suggesting a positive relationship between deficits in social intelligence and poor
social adjustment, as well as delinquency, (Cowen,Pederson, Babigan, Izzo, &Trost,
1973; Merrell, 1994; Strain, Guralnick, & Walker, 1986) supports this hypothesis.
The Wechsler Intelligence Scale for Children- Third Edition (WISC-III)
Comprehension and Picture Arrangement subtests were chosen as measures of
social perception. Reasons for this include the common practice of utilizing the
WISC-III in school settings, and the use ofthe Comprehension and Picture
Arrangement subtests as measures of social intelligence, perception, and judgment
(Kaufman, 1994; Kaufman, 1979; Reiff &Gerber, 1990; Sipps, Berry,&Lynch, 1987).
subtest as a measure of social intelligence. Adeficit in social intelligence was
definedas the existence of a significant discrepancybetween Comprehension and
Picture Arrangement subtestscores (Allison et al. 1967; Sattler,1992).
Behavioral functioning was measured using the Child Behavior Checklist
and Teacher ReportForm (CBCL & TRF, Achenbach, 1991). This behavior rating
scale includes a comprehensive checklist ofspecific behaviors, rated on a three-point
Likert scale,whichis completedby aparent (CBCL)or teacher (TRF). The Likert
scores are transferred to a graphdepicting a series ofspecificBroad-bandand Narrow-band classes ofbehavior. The two Broad-band scales include
Externalizing
(Aggressive and Delinquent behaviors), and Internalizing (Withdrawn, Somatic
Complaints, and Anxious-Depressed behaviors) factors. Narrow-band behaviors
include Withdrawal, Somatic Complaints, Anxious-Depressed, Social Problems,
Thought Problems, Attentional Problems, Delinquent Behavior, andAggressive
Behavior.
The Achenbach scales were chosenfor thisstudy because oftheir many
strengths, including the largeresearchbase available that supportsthe differential
validity ofthe specificscales and the large number ofpublishedjournal articles that provide a more comprehensive interpretation of scores than the CBCL and TRF manuals (Kamphaus & Frick, 1996). In addition, the scales possesshigh test-retest
reliability over short periods oftime (Erickson, 1992), include supplemental forms (Youth Self-Reportand Direct Observation) for multisource data collection
(Wodrich & Kush, 1990), possess excellent discriminant validity between clinical and
non-clinical samples (Knoff, 1986), and support cross-cultural validity (Degroot,
METHOD
Subjects
The subjects for this study included 79 individuals with learning disabilities
referred to a pediatric neuropsychology clinicin the Midwest. The sample included
61 males and 18females, rangingfrom sixto 16 years of age. The learning disability
classificationwas basedon thepresenceof a significantdiscrepancy (1.96xSED;
Anastasi, 1989) between overall cognitive ability, as measured by the WISC-III,and
academic achievement, asmeasured by standardized achievement tests. The range
ofWISC-m Full Scale Intelligence Quotients (FSIQ) was 80 to 120 (M =99.80,SD=
9.68). The mean for the normative sample is 100, with an associated standard
deviation of 15. Subjects were excluded fromthe study ifthere was a historyofbrain
trauma or any other medical condition which may have interfered with intellectual,
academic, or psychosocial functioning.
Procedure
Referrals to the clinic were made for the purpose of evaluating individual
cognitive and psychosocial functioning. Cognitive functioning was assessed with
the WISC-III and other neuropsychological measures, from which Comprehension
and Picture Arrangement subtest scores were obtained. Behavioral functioning was
evaluatedby the Child Behavior Checklist (CBCL) andTeacher Report Form (TRF)
scales, whichincludeeight narrow-band and two broad-band behavior factors.
Standardized achievement scores were obtained from the Woodcock-Johnson Tests
of Achievement-Revised (WJ-R) and Wechsler Individual Achievement Test
(WIAT). Subjects from the database were reviewed forinclusion in the studybased
upon the significant discrepancy between intellectual and achievement measures,
identification number to maintain confidentiality.
The data were entered into the Statistical Package for Social Sciences (SPSSX)
program, andincluded gender, age, grade in school, WISC-III results (including IQ,
factor, and subtestscores),and behavior ratingscores from the CBCL and TRF. Raw
CBCL andTRFscores were used to avoid the flooreffect associated withf-scores.
Differences in social intelligence were determined using Wechsler's (1991)
four-point discrepancy guideline between Comprehension (C) and Picture Arrangement
(PA) subtestscores. Subjects weredivided into the following three groups based
upon Wechsler'sguidelines: Group1 = C>PA (n =11 );
Group 2=PA>C(n =5);
andGroup3=C =PA (n = 45 ) (no 4-pointdifference).
RESULTS
Descriptive Statistics
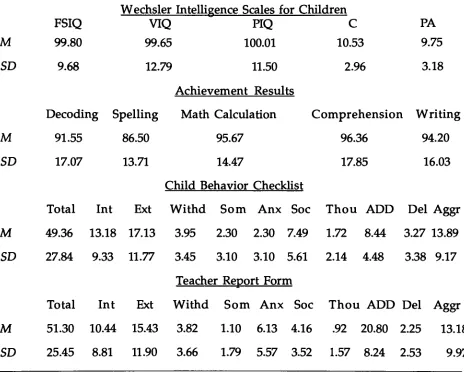
The means and standard deviations ofthe study measures are presented in
Table 1. The WISC-III results indicate the sample had overall average cognitive
ability based on the national standardization norms. Comprehension and Picture
Arrangement subtest scores also fell within the average range of cognitive ability
when comparedto same-aged peers (M =10,SD= 3). Achievement scores indicate the sample had overall average academic skills, with the exception ofspelling,
which indicate low average development of these skills. Both overall (Total) parent (CBCL) and teacher (TRF) reported mean behavior problems fell within the average
range (CBCLmean t = 49.36; TRF mean t =51.30) comparedto same-age peers (M=50, SD=10). However, large standard deviations for the ability and achievement
measures accountfor thevariability and discrepancybetween individual scores
c PA 10.53 9.75 2.96 3.18 Comprehension Writing 96.36 94.20 17.85 16.03 Table 1
Descriptive Statistics For Study Measures
Wechsler Intelligence Scales for Children
FSIQ VIQ PIQ
M 99.80 99.65 100.01
SD 9.68 12.79 11.50
Achievement Results
Decoding Spelling Math Calculation
M 91.55 86.50 95.67
SD 17.07 13.71 14.47
Child Behavior Checklist
Total Int Ext Withd Som Anx Soc Thou ADD Del Aggr
3.95 2.30 2.30 7.49 1.72 8.44 3.27 13.89
3.45 3.10 3.10 5.61 2.14 4.48 3.38 9.17
Teacher Report Form
Withd Som Anx Soc Thou ADD Del Aggr
3.82 1.10 6.13 4.16 .92 20.80 2.25 13.18
3.66 1.79 5.57 3.52 1.57 8.24 2.53 9.97
Note.FSIQ =Full ScaleIQ; VIQ = VerbalIQ;PIQ=PerformanceIQ;C =
Comprehension; PA = Picture Arrangement; Int = Internalizing; Ext =
Externalizing;
Withd = Withdrawn; Som = Somatic; Anx =
Anxious-Depressed;Soc = Social
Problems; Thou = Thought Problems; ADD = Attention Problems; Del =
Delinquency;Aggr = Aggression. M 49.36 13.18 17.13
SD 27.84 9.33 11.77
Total Int Ext
M 51.30 10.44 15.43
[image:21.569.51.515.164.536.2]Zero Order Correlations Between WISC-III and CBCL/TRF
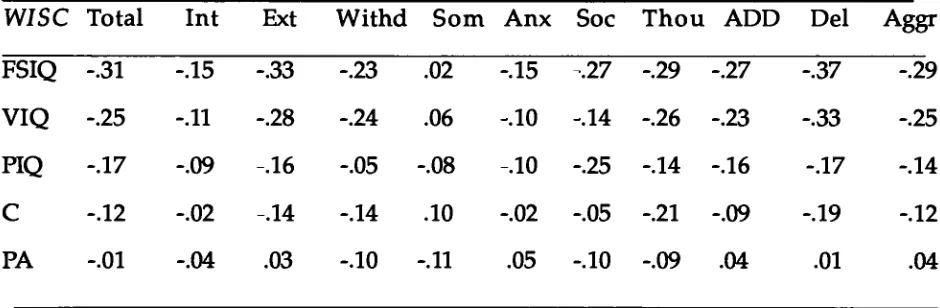
The relationships between parent-reported problems (CBCL), andWISC-III IQ,
C,andPA scores are presentedin Table 2. All ofthe significant correlations
indicated a negative relationship between cognitive ability and incidence of reported
behavior problems. This suggests that deficits in cognitive abilityare inversely
related to overall behavior problems. However, thesezero order correlations
[image:22.569.50.520.335.489.2]should be interpreted with cautionbecause ofthe increased likelihood of a Type I error.
Table 2
Two Tailed Zero Order Correlations for Wechsler Intelligence Scale for Children III
and Child Behavior Checklist
WISC Total Int Ext Withd Som Anx Soc Thou ADD Del Aggr
FSIQ -.31 -.15 -.33 -.23 .02 -.15 -.27 -.29 -.27 -.37 -.29
VIQ -.25 -.11 -.28 -.24 .06 -.10 -.14 -.26 -.23 -.33 -.25
PIQ -.17 -.09 -.16 -.05 -.08 -.10 -.25 -.14 -.16 -.17 -.14
C -.12 -.02 .14 -.14 .10 -.02 -.05 -.21 -.09 -.19 -.12
PA -.01 -.04 .03 -.10 -.11 .05 -.10 -.09 .04 .01 .04
Note. FSIQ = Full ScaleIQ;VIQ =VerbalIQ; PIQ=PerformanceIQ;C=
Comprehension; PA = Picture Arrangement; Int = Internalizing; Ext = Externalizing;
Withd = Withdrawn;Som = Somatic; Anx = Anxious-Depressed; Soc = Social
Problems; Thou = Thought Problems; ADD = Attention
Problems; Del =
Delinquency; Aggr = Aggression; Absolute Value Correlation Coefficients > .29
significantatp <.01; Absolute Value CorrelationCoefficients > .22 but < .28
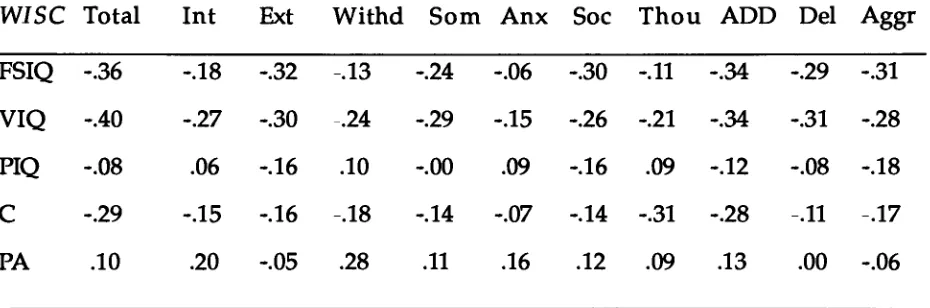
The relationships between teacher-reported behavior problems (TRF), and
WISC-IIIIQ,C,andPA-IIIIQ, C,andPA are presentedin Table 3. Similar to the
results in Table 2, all significantly related scores indicatea negative correlation.
However, one cannot determine the cause and effect relationship between these two
[image:23.569.52.517.279.433.2]variables using these statistics.
Table 3
Two Tailed Zero Order Correlations for Wechsler Intelligence Scale for Children III
and Teacher Report Form
WISC Total Int Ext Withd Som Anx Soc Thou ADD Del Aggr
FSIQ -.36 -.18 -.32 .13 -.24 -.06 -.30 -.11 -.34 -.29 -.31
VIQ -.40 -.27 -.30 .24 -.29 -.15 -.26 -.21 -.34 -.31 -.28
PIQ -.08 .06 -.16 .10 -.00 .09 -.16 .09 -.12 -.08 -.18
C -.29 -.15 -.16 -.18 -.14 -.07 -.14 -.31 -.28 -.11 -.17
PA .10 .20 -.05 .28 .11 .16 .12 .09 .13 .00 -.06
Note. FSIQ = FullScaleIQ;VIQ = VerbalIQ;PIQ=PerformanceIQ; C=
Comprehension; PA = Picture Arrangement; Int = Internalizing;Ext = Externalizing;
Withd = Withdrawn;Som = Somatic; Anx = Anxious-Depressed; Soc = Social
Problems; Thou = Thought Problems; ADD = Attention Problems; Del =
Delinquency; Aggr = Aggression; Absolute Value Correlation Coefficients >
.30
significant atp <.01; Absolute Value CorrelationCoefficients> .22 but < .29
significant atp < .05.
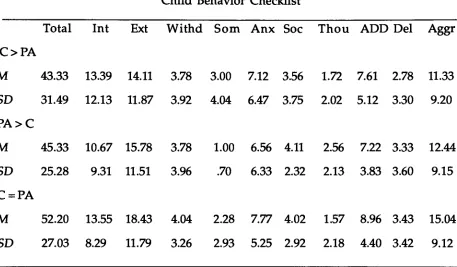
Comparison of CBCL Scores By Group
The comparison oftheCBCL scoresfor the three groups (GroupC>PA;
Group
PA>C;andGroupC=PA) is shown in Table 4. Multivariate
analysis of variance results revealed non-significant relationships between the level of social intelligence (Group) and incidence of parent-reported behavior problems
(CBCL). Therefore,only the descriptive information for theCBCL will be reported.
Table 4
Child Behavior Checklist by Group
Child Behavior Checklist
Total Int Ext Withd Som Anx Soc Thou ADD Del Aggr
C>PA
M 43.33 13.39 14.11 3.78 3.00 7.12 3.56 1.72 7.61 2.78 11.33
SD 31.49 12.13 11.87 3.92 4.04 6.47 3.75 2.02 5.12 3.30 9.20
PA>C
M 45.33 10.67 15.78 3.78 1.00 6.56 4.11 2.56 7.22 3.33 12.44
SD 25.28 9.31 11.51 3.96 .70 6.33 2.32 2.13 3.83 3.60 9.15
C=PA
M 52.20 13.55 18.43 4.04 2.28 7.77 4.02 1.57 8.96 3.43 15.04
SD 27.03 8.29 11.79 3.26 2.93 5.25 2.92 2.18 4.40 3.42 9.12
Note. C = Comprehension; PA = PictureArrangement; Int = Internalizing;Ext = Externalizing; Withd = Withdrawn; Som = Somatic; Anx = Anxious-Depressed; Soc
= Social Problems; Thou = ThoughtProblems; ADD= Attention
problems; Del =
Delinquency; Aggr = Aggression; No univariate or multivariate tests were
significant for Child Behavior Checklist
ANOVA for TRF Total Score
Analysis of variancefor the TRF Total score is presentedin Table5. The
[image:24.569.54.511.211.478.2]study. Thesesuggest differences betweenthe groups exist,but further posthoc
analyses were necessaryto interpret these statistics.
Table 5
Analysis of Variance for Teacher Report Form Total Score
SV df SS MS F p
403
1)23
Group 2 4743.33 2371.67
Error 58 34103.35 587.99
Total 60 38846.69
Note. SV= Source ofVariance
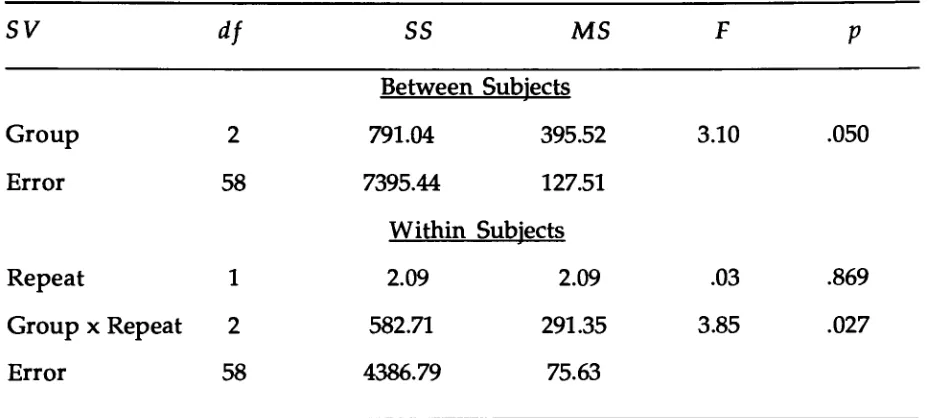
Repeated Measures MANOVA for TRF Internalizing and Externalizing Scales
The repeated measures MANOVA results for the TRF Internalizing and
Externalizing scales are shown in Table 6. A multivariate approach to the data was
used because of the violation ofhomogeneity and sphericity assumptions. The
between-subjects analyses revealed a significant main effect forGroup; however, no
significant differencewas found between the Internalizing and Externalizing scales
of the TRF. Within-subjects effects indicated a Group by Repeatinteraction,
suggesting significant differences were not uniform between the Internalizing and
Externalizing scales ofthe TRF.
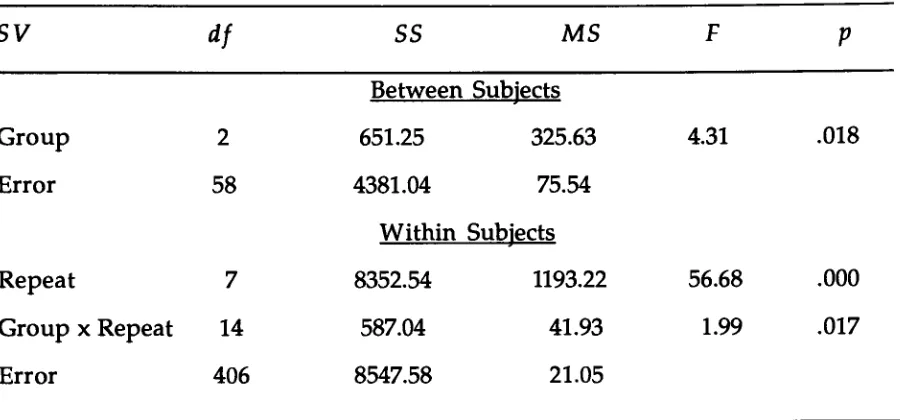
Averaged Repeated Measures MANOVA for the TRF Subscales
The averaged repeated measures MANOVAresults for the TRF subscales is
presented in Table 7. Significantmain effects between andwithin the groups
problem subscales.
Table 6
Repeated Measures MANOVA For Teacher Report Form Internalizing and
Externalizing Scales
SV df SS MS F V
Between Subjects
Group 2 791.04 395.52 3.10 .050
Error 58 7395.44 127.51
Within Subjects
Repeat 1 2.09 2.09 .03 .869
Group x Repeat 2 582.71 291.35 3.85 .027
Error 58 4386.79 75.63
Note. SV= Source ofVariance
Post-Hoc Analyses for TRF Results
Post-hocanalyses ofTRF subscales, usingTukey's Honestly Significant
Difference procedure,presented in Table8, revealed a series ofsignificant
relationships between the three groups. Group PA> Cexhibited a greaterincidence
of Internalizing, Withdrawn, Social,and Thought Problems than Group C > PA.
Additionally,Group PA> C also exhibited a higherrateofWithdrawn and Thought
Problems than Group C =PA, the control group. However, results indicated that
GroupC =PA showed a higherrate ofTotalreported behavior problems than Group
C>PA, and greater incidence ofDelinquencyBehavior thanboth Groups C > PA and
[image:26.569.47.512.177.386.2]Table 7
Average Repeated Measures MANOVA For Teacher Report Form Subscales
SV df SS MS F V
Between Subjects
Group 2 651.25 325.63 4.31 .018
Error 58 4381.04 75.54
Within Subjects
Repeat 7 8352.54 1193.22 56.68 .000
GroupxRepeat 14 587.04 41.93 1.99 .017
Error 406 8547.58 21.05
Note. SV= Source ofVariance
DISCUSSION
Social intelligencehas long been a subjectofstudyin psychology.
Measurement of this construct has been a challenge to researchers and results have
varied across studies. Having undergone scrutinyfor such a long period of time, the
definition and measurement of social intelligence has been tremendously refined.
Definitions of social intelligence have evolved frombeing broad, such as the ability
to recognize and identify the significance of the behavior of others (Johnson &
Myklebust, 1976) to veryspecific and measurable, such as the presence of a positive
relationship between social skills and social adjustment (Cowen, et al. 1973; Strain,
et al. 1986).
This study investigated the relationship between social intelligence and
[image:27.569.52.502.134.344.2]Table 8
Post Hoc Analyses for Teacher Report Form Results
Group Group Group
C>PA PA>C C=PA
Total Score
M 33.09 62.60 54.49a
SD 18.73 24.10 25.35
Internalizing
M 6.36 19.80a 10.40
SD 6.12 17.18 7.52
Externalizing
M 8.82 11.40 17.49
SD 6.21 5.51 12.82
Withdrawn
M 2.27 8.60a'c
3.67
SD 4.03 7.02 2.62
Somatic
M .46 2.20 1.13
SD .93 2.49 1.83
Anxious-Depressed
M 3.55 9.80 6.36
SD 3.05 9.47 5.37
Table 8 Continued
Group Group Group
C>PA PA>C C=PA
Social Problems
M 1.82 7.20a
4.40
SD 2.40 5.76 3.17
Thought Problems
M .64
3.00a'c
.76
SD 1.03 2.55 1.42
Attention Problems
M 15.64 23.60 21.04
SD 8.32 4.62 8.22
Delinquency
M .91 .80
273a,b
SD .94 .84 2.75
Aggression
M 7.91 10.60 14.76
SD 6.06 5.32 10.69
Note. a=
significantly> GroupC>PA;
b
=
significantly> GroupPA>C;c=
significantly >Group C=PA.
students is especially atrisk for academicand social deficits due toimpaired
measured by the WISC-III Comprehension (C) and Picture Arrangement (PA) subtests. Behavioral functioningwas assessed by the Child BehaviorChecklist (CBCL),completed bythe parent, andTeacher Report Form (TRF). Hypotheses
pertaining to the C andPA subtests as measures of social intelligence, perception,
and judgment are numerous (Allison, Blatt, & Zimmer, 1988;Glasser &
Zimmerman, 1967; Kaufman, 1994; Kaufman, 1979; Kellerman & Burry, 1997; Reiff &Gerber,1990; Sattler, 1992; Sipps,Berry,&Lynch, 1987). Itwas hypothesizedthat deficitsin social intelligence, basedupon a significant four-pointdiscrepancy (Wechsler, 1991)between CandPA subtests scores, would resultin differences in
teacher (TRF) and parent (CBCL) reportedbehavior problems. Relationship Between Groups and CBCL
In regards to the firstproposedhypothesis,the CBCLresults were
inconclusive. No group differences on any CBCL Broad orNarrow-band scores were
found. This suggests that deficits in social intelligence were not related to clinically
significant parent-reportedbehavior problems for the subject groups. A possible
reason for these results may be the alteration of the Picture Arrangementsubtest in
the WISC-HI from the WISC-R andWAIS-R (Kaufman, 1994). Wechsler (1991)
eliminated ormodified a number of the emotionally-laden items on the subtest for
the WISC-HI. For example, items such as "fight" and "burglar" were eliminated
from the subtest. These items could provide clinically significant information on
children's interpretation of social situations. In addition, the drawings were altered,
such as the "smoke" item. On the WISC-R "smoke"
item the boy is the source of the
problem, yet on the WISC-III he becomes the hero. Another example of the alteration of the pictures includes the "bench" item. On the WISC-R the men
may affect interpretation, and parent-reported behavior problems of the subject
groups maybe influenced. Future research could examine this hypothesis by using
the WISC-Rinstead of the WISC-III PA subtest. Because the WISC-R PA subtest
includes more emotionally-laden items different interpretations may result, with
the PA < C group demonstrating more problematicbehavior than was found in this
study.
TRF Internalizing Scale
Despite the negativefindings for the firsthypothesis, posthoc findings the
TRF are worth noting. PA > C subjectsdisplayed greater TRFInternalizing behavior
problemsthan C > PA subjects. These results suggest that children with learning
disabilities who exhibit deficits in verbal problem-solving abilities (using C as a
measure of verbal problem-solving ability) maybe at a greater riskfor internalized
psychosocial disturbance than children who exhibit deficits in nonverbal
problem-solving abilities (using PA as a measure of nonverbal problem-solving ability).
These children may exhibit internalized behaviors such as depression, anxiety,
withdrawal, and somatic complaints. This is in contrast to the evidence suggesting
that children with nonverbal learning disabilities may be at greater riskfor
psychopathology than children with verbal learning disabilities (Rourke et al. 1990).
In addition, the findings ofthis study indicatingthe presence of significantly more
internalizing behavior problems (PA> C) support previous researchsuggesting the
validity of the Comprehension subtest as a possible measure of social intelligence
(Brannigan, 1975; Krippner, 1964; Lipsitz, Dworkin, &Erlenmeyer-Kimling, 1993;
Lipsitz, 1992), and the likelihood ofindividuals with higher PA than C scores
TRF Thought Problems , Social & Withdrawn Behavior Scales
The higher teacher-reported Thought Problems for PA>C as comparedto
both Group PA>C andC> PAwarrants attention. The descriptive results of the
Thought Problems scale indicated agreat amount ofvariability for this group which
suggests that some children exhibited a much higher rate of pathology, while others
did not. Possible hypotheses to explain this variability may include that, although
low verbal skills, as measured by C, can result in more Internalizingbehaviors
(Brannigan, 1975; Krippner, 1964;Lipsitzetal. 1993; Lipsitz, 1992),thepresence of
thought disorders may also resultin similar problems.
The Comprehension and Picture Arragnement subtest requires both
crystallized (experience and education) and fluid (novel problem-solving) abilities
(Hale, 1994). Some children withlearning disabilitiesmay displaylow C scores
because of crystallized deficits, whereas othersmaynotperform wellbecause of of
fluid deficits. It isthe latter group which probablyrepresentsthose who were rated
higher on thought disorders. Children may exhibit these disordersby experiencing
visual or auditory hallucinations, engaging in self-abusive behavior,expressing fear in novel situations, engaging in repetitive behavior, orexpressingstrange ideasor
behaviors. This symptomology, in combination with fluid processing deficits, makes
it difficultfor these children to discernambiguous social situations and, as aresult,
they may struggle in such situations. However,as is the casewith the Personality
Inventory for Children Intellectual Screening scale (Wirt, Lacher, Klinedinst, & Seat,
1984), the Thought Problems scale could reflect poor academic abilityor
performance. Further research is needed to determine the the role offluid and
crystallized abilities on low Comprehension scores in conjunction with thought
The greaterrate ofwithdrawn and socialbehavior on Group PA>CthanC>
PAreported byteachers maybe related to thoughtdisorders. For example,
withdrawn individuals in this particular group (low verbal abilities) may feel
uncomfortable with verbal comprehension and expression, and instead rely on their
nonverbal skills to decipher social situations. As a result, withdrawing from social
interaction may occur. Relatedto this withdrawalmay be an increase in social
problems, such as loneliness, feelings ofworthlessness, being teased, and immature
behavior As a result, the individual, wouldbe likely to have difficulty using
appropriate social skills during interpersonal interactions (McFall, 1982).
TRF Total & Delinquency Problems Scales
A somewhat interesting finding ofthis study involves the significantly fewer
Totaland DelinquencyTRFbehavior problems exhibitedbybothGroupC > PA and
Group PA>Cas comparedtoGroupC=PA, the control subjects. These findings
suggest that the abilities measured by theComprehension and Picture Arrangement
subtests, when equally developed, may be necessaryfor developing externalizing
behaviors, such as delinquency or antisocial behavior. Individuals who exhibit
socialized delinquencymay possess equally developed verbal andnonverbal
problem-solving skills, such as the subjectsinGroup C = PA. In addition, these
individuals may exhibitbehaviors such as lying, cheating, stealing, swearing,
truancy, and socializing with similar peers. Such individuals often socialize with
peers who exhibit delinquentbehaviors, yet remainloyal to their group despite
engaging in negative behavior. A strongexample of such a group is agang (i.e.,
street gangs). Due to their repeated school failures and resultantlow self-esteem and
efficacy, theymay seek outnegative peer groups and engage in antisocial activities to
Basedupon theresults ofthis study, recommendations for practice in the
school setting are presented here. Practitioners shouldbe aware thatlow
Comprehension subtest scores in children with learning disabilities may reflect a
need for a thorough evaluation ofpsychosocial functioning, although results
should be interpretedwith caution. LowC scores onthe WISC-III are result of
several factors, including understanding of cause and effect relationships,
common-sense, social judgment, and verbal reasoning and concept formation (Kaufman,
1994). In addition, factors such as the development of crystallized andfluid
problem-solving abilities affect performance on the Comprehension subtest (Hale,
1994), as well asbehavior in social situations.
The most effective method of assessing social intelligence, competence, or
skills includes a multimodal approach using several sources, such as parents,
teachers, and other individuals involved with the child's daily academic and social
functioning (Sattler, 1992). In addition, the use of valid and reliable measures of
psychosocial functioning and systematic observation techniques will further assist
in the proper diagnosis and treatment of thepresenting problems. This process
enables the clinician to develop a comprehensive understanding of the student's
psychological functioning and make sound treatment recommendations based on a
REFERENCES
Achenbach, T.M. (1991).Manual for the CBCL/TRF 4-18 and 1991 Profile.
Burlington: University of Vermont, Department of Psychiatry.
Achenbach, T. M. (1991).Manual for the Teacher's Report Form.
Burlington: University of Vermont, Department of Psychiatry.
Allison, J., Blatt, S., &Zimet, C. N. (1988). The interpretation of psychological
tests. Washington: Hemisphere Publishing Corp.
Anastasi, A. (1988). Psychological testing (6th edition).New York: Macmillan.
Anderson, S., &Messick, S. (1974). Socialcompetence in young children.
Developmental Psychology, 10,282-293.
Bornstein,M. R., Bellack, A. S., &Herson, M. (1977). Social skills training for
unassertive children: A multiple-baseline analysis. Journal of Applied
Behavior Analysis, 10, 183-195.
Brannigan, G. G. (1975)Wechsler Picture Arrangement and Comprehension
scores as measures of social maturity. Journal of Psychology, 89,133-135.
Bryan, T. H. (1977). Learning disabled children's comprehension of nonverbal
communication. Journal of Learning Disabilities, 10,501-506.
Bursuck, W., &Asher, S. R. (1986). The relationship between social
competence and achievement in elementary school children. Journal of Clinical
Child Psychology, 15,41-49.
Cavale, T. A. (1990). Social adjustment, social performance and social skills: A
tri-component model of social compenence. Journal of Clinical Child
Psychology,19,111-122.
Creasey, G. L.,&Jarvis, E A. (1987). Sensitivity to nonverbal communication
DeGroot, A., Koot,H. M.,&Verhulst, F. C. (1994). Cross-cultural
generalizability of the CBCLcross-informantsyndromes. Psychological Assessment,
6,225-230.
Demaray, M. K., Ruffalo, S. L.,Carlson,J., Busse, R.T, Olson, A. E., McManus,
S. M., & Leventhal, A. (1995). Social skills assessment: A comprehensive evaluation
of six publishedratingscales. School Psychology Review,24,648-671.
Dickstein, L. S., & MacEvitt, M. (1971). Comprehension subtest of theWAIS
and need for approval. Psychological Reports, 28,482.
Dishion, T. J. (1990). The family ecology ofboys' peer relationsin middle
childhood. Child Development, 61,874-892.
Emerson, E.,Crowley, S., & Merrell, K. (1994). Convergentvalidity of the
School Social Behavior Scales with the Child Behavior Checklist and Teacher
Report Form. Journal of Psychoeducational Assessment, 12,372-380.
Erickson, M. T. (1992).Behavior disorders of children and adolescents:
Assessment, etiology, and intervention. EnglewoodCliffs,New Jersey: Prentice Hall.
Fombonne, E. (1992). Parentreports on behavior and competencies among
6-11-year-old French children. European Child and Adolescent Psychiatry, 1,
233-243.
Glasser, A.J., &Zimmerman, I. L. (1967). Clinical interpretation of the
Wechsler Intelligence Test for Children (WISC).New York: Grune & Stratton.
Green, K. D., Forehand, R., Beck, S. J., & Vosk,B. (1980). An assessment ofthe
relationships among measures of children's social competence and children's
academic achievement. Child Development, 51,1149-1156.
Gresham, F. A. (1983a). Socialvalidity in the assessment of children's social
Griffen, M. (1968). The role ofpsychiatryinlearning disabilities. In H. R.
Myklebust(Ed.)Progress in learning disabilities (pp. 75-97).NewYork: Grune &
Stratton.
Guild, G. (1997). The State Event Behavior ObservationForm (SEBOF).
Unpublished scale.
Hale,J. B. (1994). The relationship between latentfactors of the WISC-R and
behavioral functioning as measured by the Child Behavior Checklist
(Doctoral dissertation, Loyola University,1993). Dissertation Abstracts
International, 55, 1693B.
Hintze, J. M., &Shapiro, E. S. (1995). Systematicobservation of classroom
behavior. In A. Thomas & J. Grimes (Eds.), Best practices in school psychology (3rd
ed., 651-660). Washington: NASP.
Hops,H. (1983). Children's social competence andskill. Behavior Therapy,
14,3-18.
Jackson,S. C, Enright, R. D.,&Murdock,J. Y. (1987). Social perception
problems in learning disabled youth: Developmental lag or perceptual deficit?
Journal of Learning Disabilities, 20,361-364.
Johnson, D. J.,&Mykelbust,H. R. (1967).Learning disabilities: Education
principles and practices.NewYork: Grune & Stratton.
Kamphaus, R. W.,& Frick,P. J.(1996). Clinical assessment of child and
adolescent personality and behavior. Boston: Allyn & Bacon.
Kavale, K. A., & Forness, S. R. (1996). Social skill deficits and learning
disabilities: A meta-analysis.Journal of Learning Disabilities, 29,226-237.
Kellerman, H., & Burry,A. (1997). Handbook of psychodiagnostic testing:
Knoff,H. (Ed.) (1986). The assessment of child and adolescent personality.
New York: Guilford Press.
Krippner, S. (1964). WISC Comprehension and Picture Arrangement subtests
as measures of social competence. Journal of Clinical Psychology, 20,266-367.
Lai,Z. C,&Shapiro,E. S. (1990). Deficits in social skills and affect procesing
in learning disabled children. Presented at International Neuropsychological
Societymeeting, February 1990,OrlandoFL.
Lerner,J. W. (1976). Children with learning disabilities. Boston: Houghton
Mifflin.
McFall, R. M. (1982). Areview and reformulation of the concept of social
skills. Behavioral Assessment, 4, 1-33.
Merrell, K. W.(1994).Assessment of behavioral, social, and emotional
problems.New York: Longman.
Merrell, K. W,Cedeno, C. J., &Johnson,E. R. (1993). The relationship
between social behavior and self-conceptinschool settings. Psychology in the
Schools, 30,293-298.
Lipsitz,J. (1992).Wechsler subscales and social adjustment in childhood and
adolescence. Dissertation Abstracts International, 53 (6-8),3158-3159.
Nicol, A. R. (Ed.) (1985).Longitudinal studies in child psychology and
psychiatry: Practical lessons from research experience. NewYork: John Wiley &
Sons.
O'Neill,R. E., Ramsey, E., Shinn, M. R., Todis, B.,Walker, H.M., &Spira,D.
(1985) The target peer interaction code. Available from The Center on Human
Development, Clinical Services Building, University ofOregon, Eugene ,
Ramos, M. C, &Die, A. H. (1986). The WAIS-RPicture Arrangement subtest:
What do scores indicate? Journal of General Psychology, 113,251-261.
Reiff, H. B., & Gerber,P. J. (1990). Cognitive correlates of social perceptionin
students with learning disabilities. Journal of Learning Disabilities, 23,230-262.
Rosenthal, R., Hall,J., DiMatteo, M., Rogers, P., & Archer,D. (1979).
Sensitivity to nonverbal communication: The PONS test. Baltimore: The Johns
Hopkins University Press.
Saudargas,R. A., &LentzJr.,F. E. (1986). Estimating percentoftime and ratvia
observation: A suggested observational procedure and format. SchoolPsychology
Review,15,36-48.
Shinn, M. R., Ramsey, E., Walker,H. M.,Steiber, S.,&O'Neill, R. E. (1987)
Antisocial behavior in school settings: Initial differences in an at-risk and normal
population. Journal of Special Education, 21,69-84.
Slate,J. R., & Saudargas, R. A. (1986a). Differences in the classroom behaviors
of behavior disorderedand regular class children. Behavioral Disorders, 11,
45-53.
Slate,J. R.,& Saudargas, R. A. (1986b). Differences inlearning disabledand
average
students'
classroom behaviors. Learning Disabilities Quarterly, 9,61-67.
Simon, J. M., & Evans,J. R. (1980). WISC-R Picture Arrangementand peer
acceptance/rejection. Perceptual and Motor Skills, 51,588.
Stone, W. C, & LeGreca,A. M. (1984). Comprehension of nonverbal
communication: A re-examination of the social competencies of learning disabled
Strain, P. S., Cowen, E.L.,Pederson, A.,Babigan, H., Izzo,L. D.,&Trost,M. A.
(1973). Long-termfollow-up ofearly detected vulnerable children. Journal of
Consulting and Clinical Psychology, 41,438-446.
Strain, P. S., Guralnick, M.J., &Walker,H.M.(Eds.)(1986). Children's social
behavior: Development, assessment, and modification. Orlando: Academic
Press.
Tur-Kaspa,H., &Bryan, T. (1995). Teacher's ratings of the social competence
and school adjustment of students with learning disabilities in elementary and
junior high school. Journal of Learning Disabilities, 28,44-52.
Vance, H. B., Fuller, G. B.,& Ellis,R. (1983). Discriminant function analysis of
LD/BD children scores on the WISC-R. Journal of CLinical Psychology, 39, 749-753.
Vaughn, S., & Haager,D. (1991). Social competence as a multifaceted construct:
How do students with learning disabilities fare? Learning Disabilities Quarterly,
17,253-266.
Vaughn, S.,Hogan, A.,Lancelotta, G., Shapiro, S.,& Walker,J. (1992).
Subgroups of children with severe and mild behavior problems: Social competence
and reading achievement. Journal of Clinical Child Psychology, 21,98-106.
Wentzel, K. (1991). Relations between social competence and academic
achievement in early adolescence. Child Development, 62,1066-1078.
Wickers,F. C,&O'Sheel,M. R. (1983). Behavioral problems and differential
WISC-R characteristics of learning disabled children. (ERIC Document
Reproduction No. ED 249 720).
Wirt, R. D.,Lachar,D., Klinedinst,J. K,&Seat,P. D.(1984). Multidimensional
description of child personality: A manual for the Personality Inventory for
Wodrich,D. L.,&Kush, S. A. (1990). Children's psychological testing: A guide
for nonpsychologists (2nd edition). Baltimore: Paul H. Brookes Publishing.
Zigler, E.,&Trickett,P. K. (1978). IQ,social competence, and evaluationof