Outlook
and
appraisal
Overview
The basic picture continues to be one of
weak recovery with a further weakening
apparent towards the end of 2011, as the UK
economy contracted by 0.2%. Scottish GDP
is still -3.3%% below the pre-recession peak
nearly four years ago, while the figure for UK
GVA is -3.6%. However, while the depth of
the recession was greater in the UK, at
-7.2%, than in Scotland, -5.9%, the recovery
of UK GDP has been slightly faster than in
Scotland. The National Institute in London
has noted that the time taken in returning to
the pre-recession peak is now greater than in
the Great Depression in the 1930s. Our new
forecast suggests that overall Scottish GDP
will not return to its pre-recession peak - the
level of GDP the economy was at just before
it went into recession - until the third quarter
of 2014, just in time for the Commonwealth
Games in Glasgow (23rd July to 3rd August
2014). That is, six years after the recession
began.
The labour market in Scotland is now clearly
weaker than the UK. Recent employment
losses have taken the Scottish jobs market to
a position 3.9% below its pre-recession
employment peak. This is not that much
different from the trough of the recession
after employment had fallen by -4.8%. The
UK jobs market is in contrast creating net
jobs, all be it slowly and at an insufficient rate
to stop unemployment rising. The result is
that employment in the UK is now only
-1.38% below its pre-recession employment
peak. Of course that in itself is nothing to be
complacent about since recession in the UK
labour market began four years ago.
Moreover, the situation in the Scottish labour
market is worse than that implied by the
employment figures. This is because the
supply of labour is rising as working
recession. Hence unemployment has been
rising strongly recently to 231,247 or 8.6%
and above the UK rate of 8.4%. The number
unemployed is very close to number reached
at the trough of the recession in May-July
2010 when unemployment reached 236,819.
Within that total more than 100,000 young
people are estimated to be unemployed. This
is a personal and social tragedy, which on
most people's values should produce the
strongest policy response. Moreover, it is
also an economic tragedy because of the risk
that a generation of employees may lose, or
fail to gain, key employment skills that would
be of significant productive use to the
economy. Potential output will fall.
On a brighter note, the weakening in growth
in the economy towards the end of last year
does not appear to be as bad as many
feared. There are some indications that
growth is beginning to pick up and after a
weak first six months growth may pick up
towards the end of the year. The rate of
inflation is falling as last year's VAT increase
falls out of the statistic and the rise in import
prices especially commodities and energy
costs have moderated. Although the recent
rise again in the price of oil to above $120
per barrel, driven by events in Iran, leads one
to be cautious about the prospect for a rapid
fall in inflation. The mainstream view is that a
lowering of the inflation rate back to target
will give a relative boost to real incomes and
so encourage a rise in household demand.
But this view might be misplaced. If the
pressing need of households is to pay down
debt and present real incomes mean that
there actual saving is below the
precautionary saving desired to pay down
debt. Then a rise in real income could lead to
higher savings with little or no impact on
household demand. Let us hope it is the
former rather than the latter.
The situation in the Eurozone remains the
'elephant in the room' as regards future
growth prospects but the problem has eased
for two reasons. First, the agreement
secured by EZ finance ministers on the
much-postponed €130bn second bail-out for
Greece. Secondly, the role the ECB has
recently played in acting as
de facto
lender of
last resort. By buying securities from EZ
banks the banks have been able to use the
increased liquidity to fund some of the debt
of the peripheral sovereigns. These
developments offer only temporary respite to
the EZ balance of payments and debt crisis.
But there is still a risk of a disorderly Greek
default and exit from the EZ, which will put at
risk some of the other sovereigns such as
Portugal and Spain. Moreover, the balance
of payments financing and adjustment issues
have hardly been tackled even if some
progress has been made on debt.
Against this back ground we have revised
down our forecast of GDP growth for 2012 to
0.4% from 0.9%. But we expect growth to be
a little stronger in 2013 at 1.7% instead of
1.6%. By 2014 we predict a stronger
recovery with growth of 2.6% taking us back
to that pre-recession GDP peak by the third
quarter. We expect Scottish growth to
continue to be weaker than the UK but
growth in the two jurisdictions is now
expected to be much closer together, in line
with the evidence from the recovery to date.
For employment, our central forecast is for
net jobs to fall by -1.8% in 2011, and by
-0.7% in 2012, rising by 1.0% in 2013 and by
1.7% in 2014. The number of employee jobs
in Scotland is forecast to decline during 2012
by just less than 16,000 jobs. Through 2013
and 2014 we forecast increases in employee
jobs in our central forecast, with annual
increases of over 23 thousand and 38
thousand respectively. There are job
increases across all the main sectors.
However, we forecast a “rebalancing” of
employment within the service sectors
towards non-public activities as fiscal
consolidation continues. Construction
employment is forecast to increase in 2013
and 2014 as spending on (private)
investment projects returns with renewed
confidence in the recovery.
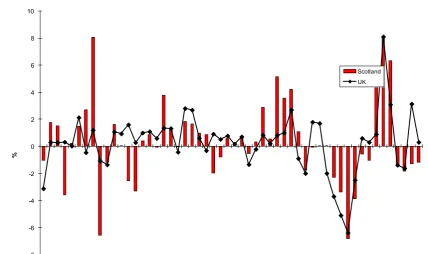
Figure 1: Scottish and UK Quarterly GDP Growth
Figure 2: GVA in recession and recovery Scotland and UK to 2011q3 (Relative to pre-recession peak) -2.5
-2.0 -1.5 -1.0 -0.5 0.0 0.5 1.0 1.5 2.0 2.5
P
erc
en
t
Scotland UK
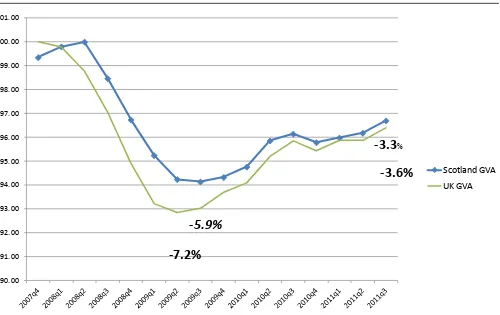
90.00 91.00 92.00 93.00 94.00 95.00 96.00 97.00 98.00 99.00 100.00 101.00
Scotland GVA UK GVA
-7.2%
-5.9%
-3.3
% [image:3.595.40.540.420.735.2]preferred ILO measure unemployment is
predicted to reach 265,250 by the end of this
year, or 9.8%. That is a rise of 34 thousand
from the level reached at the end of 2011. As
with our last forecast, we are expecting the
unemployment position to improve through
2013, and are now forecasting
unemploy-ment at the end of that year of 253,950,
9.3%, falling further to 234,300, 8.8%, by the
end of 2014.
Recent GDP performance
GDP grew by 0.5% in the third quarter identical to UK growth, compared to 0.2% in both the second and first quarters - see Figure 1. Over the year, GDP grew by less in Scotland, 0.9%, than in the UK 1.3%. It is also evident from Figure 1 that since the recession the Scottish economy has tracked the UK economy more closely than before.
While this rate of growth is close to the trend rate of growth it is weak for the recovery phase of the business cycle. It is suggested by the National Institute for Economic and Social Research (NIESR), through their Director Jonathan Portes, that the time taken in returning to the pre-recession peak is now greater than in the Great Depression in the 1930s.
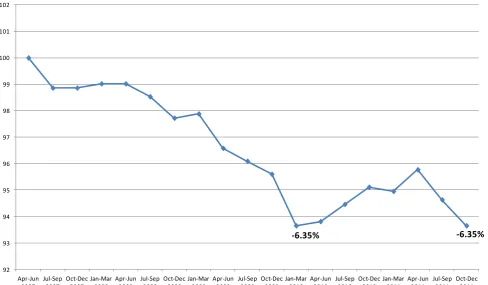
Figure 2 shows that Scottish GVA now stands at -3.3% below the pre-recession peak nearly four years ago, while the figure for UK GVA is -3.6%. However, although the depth of the recession was greater in the UK, at -7.2%, than in Scotland, -5.9%, the recovery of UK GDP has been slightly faster than in Scotland.
At the broad sectoral level, services (0.9%) and
manufacturing (0.6%) were the main drivers of third quarter growth. Indeed, the Scottish performance was stronger than in UK services (0.7%) and UK manufacturing (0.1%).
So, some comfort from a Scottish standpoint can be drawn from the latest data. But the performance of both services and manufacturing was weaker in Scotland over the year. The UK service sector grew by 1.2% over the year but Scottish services could only manage 0.3%. This underlines the weakness of the recovery in Scottish services, which is revealed in Figure 5.
Despite experiencing a smaller drop in output in the recession of -4.7% compared to a fall of -5.4% in the UK service sector, Scottish services GVA was still -2.8% below its pre-recession peak compared to -1.8% in the UK. Figure 6 charts recession and recovery in manufacturing. As with services the loss of output in recession was less than in the UK, but the recovery has been weak but comparable. GVA in manufacturing dropped by -10.1% in Scotland compared to -13.4% in the UK. In the most recent quarter manu-facturing GVA in Scotland stood at -5.2% below its pre-recession peak compared to -7.3% in the UK. A driver of the
recovery in manufacturing is exports, which appears to have faltered in 2011. Manufacturing exports grew by 0.2 per cent in real terms during the third quarter of 2011. But this represented a weaker performance than the second quarter, which in turn was weaker than the first quarter.
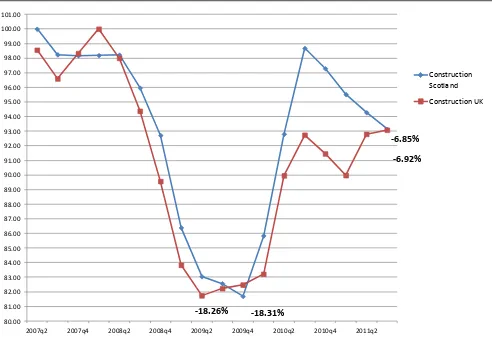
The construction sector was much weaker in Scotland in the third quarter contracting by -1.2% compared to an increase of 0.3% in the UK - see Figure 7. It is worth noting, though, that over the year the performance of Scottish construction was slightly better with growth of 5.9% compared to 5.4% in the UK. Figure 8 shows that the picture during the recession and recovery is more complicated. The drop in output in the recession was large and identical in Scotland and the UK at -18.3%. But Scottish construction bounced back more strongly than its UK counterpart, then contracted for 4 successive quarters, while UK construction contracted for 2 quarters and then grew over the last 2 quarters. The result was that by 2011q3, construction GVA in Scotland and the UK was broadly in the same place in relation to its pre-recession peak, at -6.9%.
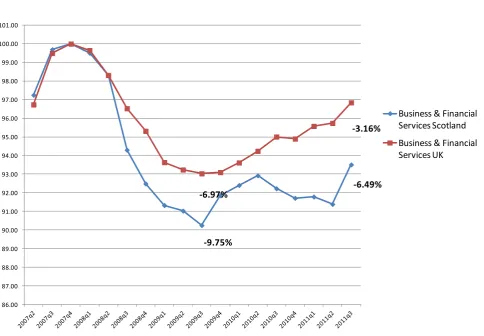
Within services, the most important sector by contribution to GDP, business and financial services - 26% of overall GDP and 36% of service sector GVA - grew by 2.3% in Scotland and 1.2% in the UK during the latest quarter. However, over the year the sector contracted by -0.3% in Scotland but grew by 1.9% in the UK. Figure 9 shows the path of GVA in the sector during the recession and recovery relative to its pre-recession peak. What is clear from the chart is the greater recession in Scotland and weaker recovery. GVA fell by -7.0% in UK business and financial services during the recession whereas in Scotland the contraction was -9.8%. By the latest quarter the sector in the UK was -3.2% below its pre-recession peak while its Scottish counterpart was -6.5% below, which is not much different from the trough of the recession in the sector in the UK. Elsewhere in services Distribution, Hotels and Catering grew more quickly in Scotland in both the recent quarter and over the year. Growth was 0.7% in the quarter compared to 0.2% in the UK, while over the year the Scottish sector grew by 2.6% while its UK counterpart grew by 0.3%. In contrast, both Transport, Storage, Information & Communication and Government & Other Services grew more quickly in the UK. The Transport et al sector contracted by -0.3% in the quarter while the sector in the UK grew by 0.3%. Over the year, the sector contracted by -0.8% in Scotland while expanding by 1.3% in the UK. Similarly, in the government & other services sector growth was flat in the quarter but was positive at 0.6% in the UK. Over the year, the sector was largely stagnant in Scotland with growth of only 0.1% but exhibited growth of 1% in the UK. These slower rates of growth of government activity are likely in part to reflect the strengthening of the programme of fiscal consolidation.
Figure 3: Scottish and UK Services GVA Growth at constant basic prices 1998q2 to 2011q3
Figure 4: Scottish and UK Manufacturing GVA Growth at constant basic prices 1998q2 to 2011q3
-2.0 -1.5
-1.0
-0.5 0.0
0.5
1.0 1.5
2.0
2.5
P
er
ce
n
t
Scotland UK
-8.0 -6.0 -4.0 -2.0 0.0 2.0 4.0
P
erc
en
t
[image:5.595.41.522.441.702.2]Figure 5: Services: Recession and Recovery to 2011q3
Figure 6: Manufacturing: Recession and Recovery to 2011q3 93.00
94.00 95.00 96.00 97.00 98.00 99.00 100.00 101.00
Services Scotland Services UK
-2.83% -1.82%
-4.65%
-5.35%
85.00 86.00 87.00 88.00 89.00 90.00 91.00 92.00 93.00 94.00 95.00 96.00 97.00 98.00 99.00 100.00 101.00
Manufacturing Scotland Manufacturing UK
-13.43% -10.13%
-5.23%
[image:6.595.39.532.392.758.2]Figure 7: Scottish and UK Construction GVA Volume Growth 1998q2 - 2011q3
main sectors driving manufacturing growth of 0.9% in the third quarter were Engineering & Allied and Food & Drink, with growth of 1% and 1.9%, respectively. The Metals sector grew strongly with GVA rising by 3% during the quarter. However, metals accounts for half the weight of the other two sectors. Most of the main manufacturing sectors grew quite strongly over the year, which hopefully augurs well for future growth. Figure 10 shows the growth performance of manufacturing exports over the past eight years. The quarterly data are smoothed as a four-quarter moving average to remove some of the quarterly fluctuations to which the series is prone, in part because of the 'lumpy' nature of export orders and sales (The series is already seasonally adjusted.) Recovery from recession is clearly evident but the faltering nature of the recovery is also clear.
The labour market
The latest labour market data for the Scottish economy were not encouraging. However, the picture for the UK labour market was a little brighter. Unemployment (on the preferred ILO measure) rose during the final quarter of 2011 by 16,000 to 231,247 or 8.6%, higher than the UK rate of 8.4%. This figure is close to the recession peak of unemployment in May-July 2010 when unemployment reached 236,819. For a detailed consideration of the Scottish labour market see Overview of the Labour Market in this Commentary below.
Employment fell by 20,000 to take the Scottish jobs market to a position 3.9% below its pre-recession employment peak
- see Figure 11. This is not that much different from the trough of the recession after employment had fallen by -4.8%. The position in the UK on the jobs front is better, however. Net jobs were created during Oct-Dec, by 60,000 even though unemployment rose by 48,000. The inactivity rate also fell quite markedly in the UK whereas in Scotland there was only a slight fall.
All this suggests that with more encouraging data on the output front, the UK labour market might be beginning to turn round although unemployment may rise for a little while yet. This does not disguise the fact that unemployment remains high by historical standards. Jonathan Portes,
Director of NIESR, demonstrates that the 'unemployment gap' between actual unemployment and the rate of unemployment that is estimated to be associated with non-accelerating inflation is exceptionally high and of long duration by historical standards. The 'unemployment gap' if positive indicates the amount of unemployment due to a deficiency of demand and hence a failure of macro-economic management. With a large element of this gap being made up of 'youth' unemployment - more than 100,000 estimated in Scotland - the risk of hysteresis, with a generation of employees losing, or failing to gain, key employment skills, is high.
In Scotland, the labour market is now clearly weaker than the UK. There is no better indicator of this than a
comparison of the amount of employment on offer with the available labour supply. As Figure 12 reveals the amount of jobs on offer compared to the available labour supply is now identical to the trough of the recession.
-8 -6 -4 -2 0 2 4 6 8 10
%
Figure 8: Construction: Recession and Recovery to 2011q3
Given that the growth of output remains weak it is likely that unemployment will continue to rise in Scotland for some time yet. Moreover, Scotland's position compared to the other regions of the UK, which has also been weakening, may continue to worsen - see Figure 13.
Re-balancing the Scottish economy
The shock to the economy of the Great Recession continues to reverberate. Not only has the recovery been weak, there are fears that a large proportion of supply has been permanently lost, and that there has been a desired permanent shift in the composition of demand away from one set of productive activities to another set. There are activities such as investment banking, containing both tradable and non-tradable elements - see below, which it is arguable have been permanently reduced in the UK following the boom and slump. In general terms, the IMF has found that downturns associated with significant disruption to the financial sector are often characterised by large and persistent output losses1.
On the demand-side, Ben Broadbent – External Member of the Bank of England Monetary Policy Committee (MPC) - has argued that the large fall in sterling in 2007-08 “...reflects the need to rebalance UK supply – away from non traded goods and services, and towards the production of tradables – in order to match an equivalent shift in the composition of demand”2. Broadbent's argument is that first,
debt financed spending on housing, in particular, and perhaps other forms of property, has fallen for the
foreseeable future. In addition, the loss of tax revenues as a result of the recession has been significant. Broadbent points out that tax revenues in 2009-10 were £109bn lower than expected in early 2007, equal to almost a third of current government spending on public services. The government has started a major and seemingly permanent cutback in government consumption, rightly or wrongly, as a result of the loss of tax revenues and rising debt. The main impact of this lowered spending will be on the demand for non-tradables. While in the short-to-medium term the government sees switching from public to private demand, household to export demand, and consumption to
investment demand, there is a sense that, in the longer term, the required sustained switch is one from non-tradables to non-tradables. Exports, in particular, will have to play a greater role in the growth of both UK and Scottish economies.
To the extent this argument is correct, the future course of the economy i.e. growth and its composition, will depend on how successful and how quickly the economy can adjust away from the non-tradable activities that are less in demand towards tradable activities. And the most important tradable activities are manufacturing and tradable business and financial services.
.
80.00 81.00 82.00 83.00 84.00 85.00 86.00 87.00 88.00 89.00 90.00 91.00 92.00 93.00 94.00 95.00 96.00 97.00 98.00 99.00 100.00 101.00
2007q2 2007q4 2008q2 2008q4 2009q2 2009q4 2010q2 2010q4 2011q2
Construction Scotland Construction UK
-18.26% -18.31%
Figure 9: Business & Financial Services: Recession and Recovery to 2011q3
Figure 10: Scottish Manufacturing Export Growth 2003 to 2011 - Percent, four quarter moving average
86.00 87.00 88.00 89.00 90.00 91.00 92.00 93.00 94.00 95.00 96.00 97.00 98.00 99.00 100.00 101.00
Business & Financial Services Scotland
Business & Financial Services UK
-9.75%
Figure 11: Scottish and UK jobs, 16 and over, compared to pre-recession peak
Figure 12: Scottish Employment to Working Population ratio compared to pre-recession peak in April-June 2007 to Oct-Dec 2011
-4 -3 -2 -1 0 1 2 3
94 95 96 97 98 99 100 101
Apr-Jun 2007
Jul-Sep 2007
Oct-Dec 2007
Jan-Mar 2008
Apr-Jun 2008
Jul-Sep 2008
Oct-Dec 2008
Jan-Mar 2009
Apr-Jun 2009
Jul-Sep 2009
Oct-Dec 2009
Jan-Mar 2010
Apr-Jun 2010
Jul-Sep 2010
Oct-Dec 2010
Jan-Mar 2011
Apr-Jun 2011
Jul-Sep 2011
Oct-Dec 2011
-4.77%
-3.91%
Scotland
UK
-2.41%
[image:10.595.61.537.398.710.2]All this begs several questions when it comes to Scotland. First, what evidence is there on changes in the demand and supply for non-tradables and tradables as a consequence of the recession in Scotland, both absolutely and relative to the rest of the UK? Secondly, what are the prospects for the growth of the Scottish tradables sector in the medium to long-term?
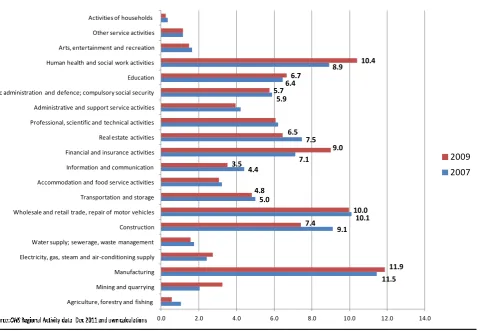
[image:11.595.45.534.83.368.2]Data are limited but we do have the latest ONS Regional activity data that were published in mid December. The Regional Accounts data provide information on sectoral GVA up to 2009 and overall 'regional' GVA to 2010. Figure 14 shows the sectoral GVA shares before - 2007 - and during/after the recession - 2009 - in Scotland.
Figure 14 offers some support for the view that switching between non-tradables and tradables began during the recession. Of the typical non-tradable sectors, construction's share of Scottish GVA dropped from 9.1% to 7.4%,
wholesale and retail etc, dropped marginally from 10.1% to 10%, real estate activities fell from 7.5% to 6.5%, and transportation and storage reduced its share from 5% to 4.8%. However, public sector activities that embrace the three sectors, Human health etc, Education, and Public Administration etc., increased their share of GVA slightly between 2007 and 2009 from 21.3% to 22.8%. The rise in public non-tradable activities would appear to be the inevitable initial consequence of a private sector recession. The government maintained its own demand in the recession as it traditionally now does. But once fiscal consolidation finally works through then it is likely that the share of public sector activities will fall.
Turning now to the largely tradable activities, there is some suggestion of rising GVA shares, although by 2009 the increase was small. Manufacturing's share of overall GVA rose from 11.5% to 11.9% and this despite a large drop in real manufacturing GVA as measured by the Scottish government's own GVA index. Also, the share of financial services and insurance in overall GVA rose from 7.1% to 9%. This is in many respects surprising, given the source of the recession in a banking crisis, where one might have expected demand to fall disproportionately in financial services and perhaps even some supply to have been lost. The rise in the share might indicate that the effects of a relative price shift in demand towards tradable elements of financial services outweighed the income effect in reducing demand but I doubt it. What needs to be allowed for is the extent to which the sector was able to maintain and increase its 'market' share by raising prices. It is possible that the lack of competition in the sector, particularly in areas such as business finance, enabled this to happen. It certainly chimes with anecdotal evidence about the behaviour of the banks during and after the recession in terms of charges for new lending and re-financing. Moreover, the rise in the share of financial services following the recession was not simply a Scottish phenomenon and was evident right across the UK as Figure 15 shows.
In contrast, the rise in the share of manufacturing in overall GVA was much more a Scottish phenomenon. Indeed, as Figure 16 shows, the share of manufacturing in UK GVA fell between 2007 and 2009, from 11% to 10.3%.
Only in Scotland and Northern Ireland did the manufacturing share of GVA rise. But in regions such as the North East and the West Midlands, the drop in the manufacturing share was large from 15.3% to 13.2% in the former and 14.6% to 12.8% in the latter.
So, we have tried to offer some answers to our first
question: what evidence is there on changes in the demand and supply for non-tradables and tradables as a
consequence of the recession in Scotland, both absolutely and relative to the rest of the UK? The evidence appears to show that a shift in demand away from non-tradables towards tradables has occurred. However, there is clear evidence of a relative fall in some non-tradable sectors but weaker evidence of a relative rise in sectors considered to be largely tradable. The picture appears also to be confused by the income effect of the recession, which caused demand to fall for all goods and services, although the incidence of the drop in demand varied across sectors. What we can say is that manufacturing, the principal traded sector, held up relatively well in Scotland. This could mean that, in answer to our second question, the Scottish economy may be well placed to take advantage of the expected sustained switch in demand in favour of tradables in the future.
However, the prospects depend on the supply response of the Scottish economy. That is, how easily the economy
allows existing resources to switch from non-tradable activities in reduced demand, along with the allocation of new resources, to manufacturing. We saw above that while manufacturing exports from Scotland are recovering the recovery to date is fitful.
We have undertaken a detailed analysis of Scottish exports over the past 10 years using data from the recently
published Global Connections Survey, the Index of Manufacturing Exports, and the Scottish Input-Output tables. Some of the results from this exercise are presented in Box 1 of the Forecasts of the Scottish economy section in this Commentary below. What this analysis suggests, in broad terms, is that the rest of the UK (RUK) became more important as an export destination and service sector exports rose as a proportion of total exports and so
increased in importance relative to manufacturing. However, these findings need to be hedged with one or two
qualifications.
First, the growth in importance of RUK exports as a proportion of total exports reflected the strong growth in service and financial service sector exports up to 2007 just prior to the start of the recession. Between 2008 and 2010, the annual rate of growth of total exports declined
[image:12.595.41.542.407.762.2]considerably from the period 2002 to 2007. This was very
Figure 13: Unemployment rate % (ILO measure) UK Regions Oct-Dec 2011
11.2 10.0
9.9 9.3 9.3 9.0 8.6 8.4 8.2 7.2
7.0 6.3 6.1
0 2 4 6 8 10 12
much the result of a drop in exports to RUK, which fell from 9.9% per annum to 0.6% per annum, still managing some positive growth3. Exports to the rest of the world (ROW), in contrast, went from 0.5% annual growth in 200207 to -0.6% in 2008-10, i.e. they were falling over the whole period.
Secondly, we cannot get a proper appreciation of the underlying performance of manufacturing exports and contribution to exports as a whole, unless we remove the electronics sector. Because of the world-wide recession in ICT in 2000 and thereafter, electronics production in Scotland halved and the sector's contribution to exports fell considerably. With the removal of electronics, the annual growth rate of manufacturing exports to RUK pre-recession and then during recession falls from 4.0% per annum to 1.4%. Over the same period service sector exports to RUK fell from 13.4% per annum to -0.9%. So exports of
manufactures (ex electronics), and manufacturing overall, to RUK held up better than service exports. Moreover,
manufacturing (ex electronics) exports to ROW were growing quite strongly in the pre-recession period by 4.4% per annum but less than service exports to ROW, which grew strongly by 8.9% per annum. In the recession manufacturing exports (ex electronics) fell to -1.4% per annum while service exports to ROW although contracting considerably managed to record some positive growth of 1.4% per annum.
So, we can conclude by making the following points:
It appears likely that the future growth of the Scottish economy will depend more on tradables than non-tradables than it has done in the past. Policy needs to recognise this. Although, recent evidence suggests that the rebalancing process is already underway.
The growing importance of tradable service exports suggests that export promotion policies should not simply assume that manufacturing is the only source of strong export growth.
Equally, the weak performance of Scottish exports to the ROW and the weak performance of
manufacturing exports within that total, should not produce a counsel of despair.
The weak Scottish export performance to ROW over the past 8 to 10 years is mainly down to the significant loss of electronics production at the beginning of the period and the effects of recession at the end of the period.
[image:13.595.53.534.417.748.2] Policy needs to recognise the importance of the RUK market as a legitimate target for 'export' promotion policy.
Figure 14: Sectoral Shares (%) of Scottish GVA: 2007 and 2009
11.5 9.1
10.1 5.0
4.4
7.1 7.5 5.9
6.4
8.9
11.9 7.4
10.0 4.8
3.5
9.0 6.5
5.7 6.7
10.4
0.0 2.0 4.0 6.0 8.0 10.0 12.0 14.0
Agriculture, forestry and fishing Mining and quarrying Manufacturing Electricity, gas, steam and air-conditioning supply Water supply; sewerage, waste management Construction Wholesale and retail trade, repair of motor vehicles Transportation and storage Accommodation and food service activities Information and communication Financial and insurance activities Real estate activities Professional, scientific and technical activities Administrative and support service activities Public administration and defence; compulsory social security Education Human health and social work activities Arts, entertainment and recreation Other service activities Activities of households
Figure 15: Financial Sector GVA Shares in UK Regions before and in recession, 2007 and 2009
Figure 16: Manufacturing GVA Shares UK Regions 2007 and 2009 0.0
5.0 10.0 15.0 20.0 25.0
However, the continuing weakness of UK household demand might also suggest that the recent shift in the balance of exports in favour of the rest of the UK could hamper the necessary rebalancing of Scottish industry in favour of the production of tradables and exports.
Forecasts
Background
Real GDP in the UK economy contracted by 0.2% in the final three months of last year. A key question is whether this fall in GDP is a portent of worse to come, or will this weakening in an already weak recovery be temporary? The question cannot be answered with much certainty. As we noted above GDP is around 4% below its pre-recession peak. It is the production sector and construction that is displaying the greatest weakness, with manufacturing (-0.9% in the quarter) contributing most to the decline, while the service sector slowly recovers. But mining and quarrying also contracted by -1.1% in the quarter and the ONS cites the drop in North Sea Oil production as a key factor. Indeed, the sustained weakness of oil production in the UK is shown to be a contributory factor in the weakening UK trade position. The near term prospects for production output, which contributes 15% to overall UK GDP do not look promising. Most of the broad product groupings are either exhibiting a downward trend or flat growth. Moreover, both consumer durable and non-durables are contributing little to
growth, with no sign of an upturn. This clearly reflects the state of UK consumer demand as households continue to pay down debt and deal with declining real incomes.
The situation in services in the UK is a little more
reassuring. The performance of business services & finance is encouraging and should support future growth. But with fiscal consolidation beginning to bite the still positive contribution to growth from Government & other services might be expected to diminish.
We noted above that the recovery was meant to be based on a switch from domestic to external sales, from
consumption to investment, and from public to private activity. There is little evidence of this occurring much in the latest statistics. What the outturn data suggest is that we might expect to see more negative GDP growth in the UK in the first half of this year, or at best stagnation. But it is not all gloom. Net jobs are being created in the UK labour market even though unemployment and particularly youth unemployment is unforgivably high. The rate of inflation is falling as last year's VAT increase falls out of the statistic and the rise in import prices especially commodities and energy costs have moderated. Although the recent rise again in the price of oil to above $120 per barrel, driven by events in Iran, leads one to be cautious about the prospect for a rapid fall in inflation. Moreover, while the mainstream view is that a fall in the inflation rate back to target will give a relative boost to real incomes and so encourage a rise in
13.7
15.3 14.6
11.5
11.0 15.2
13.2 12.8
11.9
10.3
0.0 2.0 4.0 6.0 8.0 10.0 12.0 14.0 16.0 18.0
Manufacturing Share 2007
household demand, the view might be misplaced. If the pressing need of households is to pay down debt and present real incomes mean that there actual saving is below the precautionary saving desired to pay down debt. Then a rise in real income could lead to higher savings with little or no impact on household demand. Nevertheless, if this is any comfort, the latest Markit Household Finance Index shows household finances still worsening but deteriorating at their slowest rate since December 2010. The survey also suggests that household debt may have stabilised, which I assume means has stopped rising.
Other UK survey evidence is a little more encouraging. The Markit/CIPS UK Services PMI showed that UK service sector growth improved in January to the strongest level since March last year. New orders were up and business orders rose considerably leading Markit's Chief Economist Chris Williamson to comment that "... (t)he surprisingly strong upturn in the service sector follows a similar improvement in manufacturing and ongoing growth in construction, which all points to a resounding revival of UK economic growth in January. The situation is certainly a lot brighter than seen in the final quarter of last year, when the economy contracted 0.2%, and a slide back into recession is now looking increasingly unlikely."
However, we would still argue that the scale and speed of the UK Coalition's fiscal austerity programme is a mistake, and that there is sufficient 'fiscal capacity' to slow the process down. We are not alone in this view. For example, the Oxford macro-economist Simon Wren Lewis argues that "the speed of fiscal tightening .... is too rapid. In the UK in 2010, for example, there was a clear risk that private sector demand would not pick up in 2011. The risk coming from the Eurozone was also apparent. In these circumstances, the prudent policy option was not to scale back public spending too rapidly, because there was no insurance policy in place if these risks materialised. They did materialise, and UK growth stalled. The Eurozone is making exactly the same mistake, in perhaps a bigger way." 4 Wren Lewis then
comments on the risks of rising debt and loss of market confidence "(O)ne simple point is worth making again and again. If the recession reflects additional net saving by the private sector, they want to hold more assets. Furthermore, given the character of the recession, they want to hold relatively safe assets. There is a literature on the current shortage of safe assets. Budget deficits provide those assets, but still interest rates on debt are falling outside the Eurozone because there are not enough of them. This too points to budget deficits being cut too quickly."5
The so-called 'elephant in the room' remains the situation in the Eurozone (EZ). On Tuesday 21st February, the EZ finance ministers secured agreement on a much-postponed €130bn second bail-out for Greece. This was secured after private holders of Greek bonds were cajoled into taking a greater loss of 53.5 per cent on the face value of their bond holdings compared to the 50 per cent agreed in October. In net present value terms the size of the 'haircut' amounts to a
loss of 70%. The revised arrangements followed a report prepared for the EZ finance ministers which suggested that the current proposal would on a 'downside scenario' be likely to result in a Greek debt to GDP ratio 160 per cent by 2020 instead of the desired 120 per cent. The figure of 120 per cent is considered to be the maximum level that would make the Greek public finances sustainable. All the i's have not been dotted nor the t's crossed on the deal, so it could yet collapse.
Moreover, one reason why the report considered that the previous proposal would not get the debt ratio to 120 per cent was the effect of austerity in lowering Greek GDP. This problem still remains and many economists believe that there is little likelihood of Greece getting on to a sustainable public finance track under the present strict austerity conditions required by the EZ. A disorderly default continues to have a high probability. In addition, it is very unlikely that austerity and the use of demand reduction to force an internal devaluation to improve Greek competitiveness will work at all. So, even if financing is delivered in the short-to medium term, the problem will return because of the lack of adjustment in the competitiveness of the Greek economy. Another reason why a Greek exit from the EZ has a high probability. Despite these caveats, the markets have given the EZ the benefit of the doubt and yields on the main peripheral country bonds have fallen over the last few weeks, helped considerably by the ECB's significant injection of liquidity into the banking system. The ECB has
de facto been acting as a lender of last resort, with the banks using the increased liquidity to fund some of the debt of the peripheral sovereigns. The problems posed by the EZ member country balance of payments and debt crisis have eased, for the moment.
Yet growth continues to be weak in the EZ and this amongst other factors is affecting growth in the Scottish economy. We noted in the previous Commentary that more than half of Scotland's exports outside the UK are to EU economies mostly within the EZ. In the present Commentary below in the section on the Forecasts of the Scottish Economy a weak growth forecast for the EZ is noted as well as the downside risk: a central forecast of 0% in 2012 and 1.4% in 2013, with the downside scenario a forecast of -2.1% in 2012 and -1.2% in 2013. It is noted that this is a remarkable range (2.6 percentage points in absolute terms) between the alternative scenarios at such a forecast horizon, and clearly highlights the risk to growth in the EZ if there is a major deterioration in the financial crisis.
Government resource (current) spending is forecast to reduce in real terms over the next three years at an increasing rate as departmental cuts outlined in the CSR from Autumn 2010 are implemented. The IFS in January 2012 outlined that some 88% of planned DEL reductions have yet to be implemented. This will continue to exert a downward pressure on domestic demand. Moreover, the data appear to suggest that government spending has fallen faster in real terms in Scotland than in the UK as a whole.
The prospects for Scottish exports remain very uncertain. Growth prospects in the rest of the UK – Scotland’s largest
export market – remain low. Scottish export prospects to the rest of the UK are strongly correlated with UK economic growth, so weak growth is likely to be bad for Scottish exports. Yet as the latest data from the CPB Netherlands Bureau for Economic Policy Analysis show the growth of world trade may be picking up again after slowing for much of last year. But given that 67% of Scottish exports go to the rest of the UK it what happens to the growth of income there that really matters.
[image:17.595.39.548.230.358.2]Some light on the most recent performance of the Scottish
Table 1: Forecast Scottish GVA Growth, 2011-2014
GVA Growth (% per annum) 2011 2012 2013 2014
Central forecast 0.7 0.4 1.7 2.6
November forecast 0.4 0.9 1.6 na
UK median independent new (February)
Mean Absolute Error % points
0.9
+/- 0.153
0.5
+/- 0.548
1.8
+/- 1.216
economy can be shed from survey data - see Review of Business Surveys section below. Surveys of Scottish business up to January continued to highlight concerns about the implications of the sovereign debt crisis in the EZ. Business confidence was also dampened by continuing fears of recession in the UK and internationally, and fears about pressures on household spending. However, the surveys since January particularly the UK wide surveys suggest that activity, may be beginning to pick up. We noted above the findings of the UK PMI for January which reported an increase in the service sector, at the fastest rate since March 2011. What remains unclear is whether this
represents only a temporary improvement, as was the case last year in the first quarter which faded later in the year as the headwinds facing the UK economy became clearer, or represents the first signs of a more permanent upward trend.
GVA Forecasts
For our latest GVA forecasts we continue the presentational procedure adopted in the previous Commentary. We present only a central forecast but use estimated forecast errors to establish the likely range that the true first estimate of the growth of Scottish GVA will lie between. In this forecast, we extend the forecast horizon to include 2014
Table 1 presents our forecasts for Scottish GVA - GDP at basic prices - for 2011 to 2014. The forecasts are presented in more detail in the Forecasts of the Scottish Economy
section of this Commentary below.
Table 1 shows that we have revised our forecast for all years. For 2011, we have raised our forecast from 0.4% to 0.7%. The increase in output measured for the third quarter of 2011 was stronger than we expected (a 0.5% increase), and broadly tracked the UK growth in that quarter. This upwards revision has brought our forecast in line with our earlier forecast from June 2011, where we forecast 0.8% growth during 2011. In March 2011 we had forecast annual growth of 1.0% in 2011. Our forecast of 0.4% for 2012 is not inconsistent with one, or possibly two, quarters of negative through 2012. Indeed, we note that the Bank of England’s Governor, Mervyn King, had remarked on the possibility of a “zigzagging” phase for growth over the coming year. Continuing weakness in household consumption and investment are the key reasons for the downward revision. In November 2011, we forecast growth in 2013 of 1.6%, so our latest forecast is revised up slightly. This is the first instance that we have forecast growth in 2014. By then a significant recovery is expected to be present, with growth above trend.
Our GVA forecasts are compared with the median of latest independent forecasts for the UK in 2011, 2012 and 2013 that are published by the UK Treasury. These show that we expect Scottish growth to continue to be weaker than the UK but growth in the two jurisdictions is now expected to be much closer together, in line with the evidence from the recovery to date.
2011 2012 2013 2014
Upper -37,377 -4,816 47,244 63,745
November forecast 11,150 18,850 41,100
Central -40,401 -15,988 23,213 38,023
November forecast 4,900 8,750 16,200
Lower -43,437 -27,695 -1,853 12,126
[image:18.595.33.547.271.381.2]November forecast -1,550 -1,350 -9,250
Table 3: ILO unemployment rate and claimant count rate measures of unemployment under each of the three forecast scenarios 2011-2014
2011 2012 2013 2014
ILO unemployment
Rate (ILO un/TEA 16+) 8.6% 9.8% 9.3% 8.8%
Numbers 231,200 265,250 253,950 234,300
Claimant count
Rate (CC/CC+total job) 5.3% 6.1% 6.5% 6.1%
So, we are now forecasting growth of 0.7% in 2011, 0.4% in 2012, 1.7% in 2013, and 2.6% in 2014. Given our previous forecast errors the lower and upper bounds for growth in 2011 are expected to be 0.5% and 0.9%. for 2012, -0.1% and 0.9%, and for 2013, 0.5% and 2.9%.
Production and manufacturing output are projected to continue to be the main sectoral drivers of growth, with Production forecast to grow by 1% this year compared to service sector and construction growth of 0.3% which are
largely flat-lining. In 2013, production continues to be the main sectoral driver of growth with growth of 4%. Stronger growth is projected for services and construction of 1.1% apiece but the two sectors will still be recovering slowly. It is not until 2014 that we see much pick-up in growth, a year later than previously forecast. GDP is forecast to rise by 2.6%, while production growth rises appreciably to 6%, service sector growth moves up to 1.9% and the growth of construction GVA reaches 1.7%.
One significant implication of these GVA forecasts is that they suggest that overall Scottish GDP will not return to its pre-recession peak - the level of GDP the economy was at just before it went into recession - until the third quarter of 2014, just in time for the Commonwealth Games in Glasgow (23rd July to 3rd August 2014). That is, six years after the recession began.
Employment Forecasts
Table 2 presents our forecasts for net employee jobs for the 4 years 2011 to 2014 in terms of a central and upper and lower forecasts.
Table 2 indicates that our year-end employee jobs forecast have been reduced further from the forecasts presented in the November Commentary. The lower forecasts reflect the weaker than expected outcomes in the labour market in the final quarter of last year, data revisions and the reduced forecast for GVA in 2012. On the central forecast, net jobs grow by -1.8% in 2011, -0.7% in 2012, 1.0% in 2013 and by 1.7% in 2014. The number of employee jobs in Scotland is forecast to decline during 2012 by just less than 16,000 jobs. Within the sectors, however, we are forecasting a reduction in jobs in the service sectors of over sixteen thousand jobs. Public sector reductions in employee jobs are forecast to be around 7 thousand over the year. We are also forecasting
reductions in jobs in Retail and Wholesale but increases in employment in the Business Services sector. Through 2013 and 2014 we forecast increases in employee jobs in our central forecast, with annual increases of over 23 thousand and 38 thousand respectively. There are job increases across all the main sectors. However, as in 2012 we forecast a “rebalancing” of employment within the services sectors towards non-public activities as fiscal consolidation continues. Construction employment is forecast to increase in 2013 and 2014 as spending on (private) investment projects returns with renewed confidence in the recovery.
Unemployment Forecasts
The key unemployment forecasts are summarised in Table 3 .
The ILO rate is our preferred measure since it identifies those workers who are out of a job and are looking for work, whereas the claimant count simply records the unemployed who are in receipt of unemployment benefit. It appears from the latest data that employment growth has been weaker in Scotland than other regions, reducing the pull of labour into employment. Our forecast for unemployment on the ILO measure at the end of 2012 is now 265,250, up 34 thousand from the level seen at the end of 2011. As with our last forecast, we are expecting the unemployment position to improve through 2013, and are now forecasting unemployment at the end of that year of 253,950. We are forecasting that the rate of unemployment at the end of 2012 will be 9.8%, up significantly from our earlier forecasts. However, as previous quarters have demonstrated there is considerable
uncertainty around the unemployment forecast due to the extent to which output change map into job change, changes in working population and independent variations in activity rates. In addition, we note the uncertainty around some of the employment estimates. We are concerned that some of the reported employee jobs series e.g. the series for Health, social work and care sector, may overestimating the growth through 2011. If these are subject to later downward revision then employment levels could be much worse than our current statistics suggest.
Brian Ashcroft 24 February 2012
Endnotes
1See IMF, 2009, "What’s the Damage? Medium-term Output Dynamics After Banking Crises" World Economic Outlook,
October.
2 "Rebalancing and the Real Exchange Rate" – speech by Ben Broadbent , 26 September 2011 3This doesn't sit too well with the Regional Activity