WIND DIRECTION ERROR IN THE LILLGRUND OFFSHORE
WIND FARM
Xi Yu
*,
David Infield*,
Eoghan Maguireᵜ*Wind Energy Systems Centre for Doctoral Training, University of Strathclyde, R3.36, Royal College Building, 204 George Street, Glasgow, G1 1XW, UK
ᵜVattenfallResearch & Development, The Tun Building, Holyrood Road, Edinburgh, Eh8 8AE,UK
Keywords: direction sensor error, yawing problem, wake
losses, offshore.
Abstract
The reduction of wake effects and maximisation of wind farm power output are always of interest to wind researchers [2][3]. However, one of the research challenges is to distinguish sensor errors from wake losses and losses due to poor yaw alignment. SCADA data from Lillgrund, the Swedish offshore wind farm, shows significant differences between the wind direction as measured at the met mast and as indicated by the nacelle directions measured at the individual wind turbines. Various possibilities might explain this data, the most likely being poor yaw control at particular wind turbines and/or sensor error. Both of these make power performance assessment and wake analysis problematic.
In this paper, animations presented have been proved useful in the initial identification of turbines with potential problems. These anomalous turbines are then subject to a range of analyses designed to distinguish the different potential issues.
1 Introduction
Lillgrund is an 110MW offshore wind farm located off the coast of Sweden. It consists of 48 Siemens SWT-2.3-93 turbines and 1 meteorological mast. This wind farm is owned by Vattenfall, a Swedish power company, and has been running since 2008. [2]
Wake losses and yawing performance are topics of interest to wind turbine researchers. The historical data show a significant discrepancy between wind direction measured by the met mast and the nacelle yaw direction of each turbine. This potential wind direction error complicates and is complicated by the wake structure within the wind farm. Potential yaw errors need to be confirmed and new analysis techniques, as developed here, are required to do this.
When the wind incoming direction is parallel to the row in which the turbine of study is located, the wake losses of this turbine should be maximum. However, compared with this specific direction, the power output history shows a significant deficit for up to tens of degrees on either side.
In this paper, the turbines with real or apparent abnormal behaviour are identified, the type of problem is analysed, and the variation of the wind direction measured by the met mast and the nacelle direction measured by problematic turbine is quantified.
1.1 Wind farm Layout and turbines
As shown in figure 1 [2], Lillgrund wind farm consists of 48 turbines, placed in 8 rows with an angle to southwest. These turbines have been numbered from 1 to 48. The separation between each turbine in the row is 3.3×D (where D is the diameter of the turbine) and the separation between each row is 4.3×D. The turbines are of Siemens SWT-2.3-93, whose rotor diameter is 92.6m, hub height is 65m and the rated power output is 2.3WM. A meteorological mast is set approximately 250m southwest of wind turbine generator 23 (WTG23) and WTG30. This meteorological mast has anemometers and wind direction sensors at different heights. The direction of the map follows the geological direction, in which the top corresponds to 0 degree, right represents 90 degrees, bottom indicates 180 degrees, and left represents 270 degrees.
In term of the direction, the turbine direction is the turbine rotor facing direction and the wind direction is the wind incoming direction. Ideally, the rotor facing direction is opposite (180 degree difference) to the wind incoming direction.
Figure 1 [1]. Layout of Lillgrund wind farm
1.2 SCADA data
[image:1.595.333.522.544.680.2]stamps. However, sensing or data transition errors take up over 80% the length of the data recorded. The time stamps for which there is a SCADA error at the wind mast are removed. This means whether or not there is any error at the turbines, this row of data is excluded. (For different turbines under analysis, further refinement is applied.)
Meanwhile, the wind speed lower than 6m/s is considered not strong enough to generate proper power. Therefore data with wind speed lower than 6m/s are sorted out.
After the initial sorting process, the length of valid data is around 10000. The relative measurements are: wind directions and wind speeds at 65m measured by met mast, nacelle direction, wind direction and power output measured by each turbine.
2 Problem overview
In order to have a general view of the directional responses of the turbines regarding to the wind, two types of animations are made: the first to present yawing dependence on wind direction; the second to examine yawing dynamics.
2.1 Yawing dependence on wind direction
In this animation, the basic layout of the whole wind farm is kept and all data from SCADA are sorted into 1 degree bins and the mean value calculated regardless the actual time stamps. The total achievable direction range is from 20 to 339 degree; however, considering the prevailing wind direction of this area, the analysed direction range focuses from 190 to 330 degree.
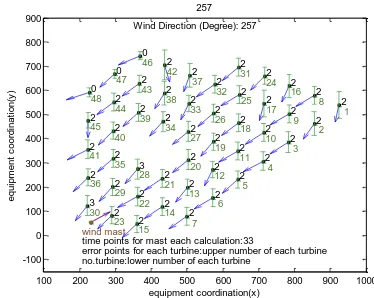
Figure 2 is a snapshot of the animation when the wind direction is 257 degree showing the typical apparent nacelle direction performance. Turbines and the wind mast are represented by points. The arrow in red of the wind mast indicates the wind incoming direction, whereas the blue arrows of the turbines represent the turbine facing directions—which are ideally opposite to the wind direction. The wind mast direction is considered as the wind incoming direction.
The green number shown on the right bottom of each point (each turbine) is the turbine serial number. The black number on the right top of each point is the number of SCADA errors of each turbine after the general sorting. These error time points are not taken into account of the total calculation. The error bar of each point represents the standard deviation of the mean direction of each turbine.
For the wind mast, the number of data used in calculation of the mean wind direction value for each direction step is shown in words under the abstract wind farm map (33 in this case). The different number of SCADA errors and the data sorted in each direction bin makes the number of data of each direction step varies.
100 200 300 400 500 600 700 800 900 1000 -100 0 100 200 300 400 500 600 700 800 900 2 2 2 2 2 2 2 2 2 2 2 2 2 2 2 2 2 2 2 2 2 2 2 2 2 2 2 3 2 3 2 2 2 2 2 2 2 2 2 2 2 2 2 2 2 0 0 0
time points for mast each calculation:33
error points for each turbine:upper number of each turbine no.turbine:lower number of each turbine
1 2 3 4 5 6 7 8 9 10 11 12 13 14 15 16 17 18 19 20 21 22 23 24 25 26 27 28 29 30 31 32 33 34 35 36 37 38 39 40 41 42 43 44 45 46 47 48 wind mast
Wind Direction (Degree): 257 257 e q u ip m e n t c o o rd in a ti o n (y ) equipment coordination(x)
Figure 2. Typical snapshot of animation for static nacelle direction responding to wind direction in 1 degree step
2.2 Yawing dynamics
In this animation, each frame indicates the rotor facing direction as well as the wind incoming direction at one time stamp.
Figure 3 is a typical snapshot of the animation when the time stamp is 8023. The green number shown on the right bottom of each point (each turbine) is the turbine serial number. The black number on the right top of each point is the yaw angle (degree). The time stamp when SCADA error of wind met mast data occur has been sorted out (general sorting), however the SCADA error of each turbine has been kept and shows the number ‘-999’.
100 200 300 400 500 600 700 800 900 1000 -100 0 100 200 300 400 500 600 700 800 900 221.611 217.506 215.533 209.556 193.629 207.887 208.609 209.198 213.328 208.21 209.042 178 188.505 207.241 198.17 196.816 212.652 203.874 188.678 217.086 207.364 213.999 196.434 193.719 208.446 198.722 216.31 199.183 191.373 196.04 196.934 207.095 175.043 217.941 201.301 196.451 222.399 218.342 195.095 192.971 210.037 95.61 216.593 173.58 155.852 202.915 154.555 206.254 1 2 3 4 5 6 7 8 9 10 11 12 13 14 15 16 17 18 19 20 21 22 23 24 25 26 27 28 29 30 31 32 33 34 35 36 37 38 39 40 41 42 43 44 45 46 47 48 wind mast 212.967 black number:direction(degree) green number:number of each turbine
time step: 8023 ( 27262 )
[image:2.595.329.516.85.234.2]e q u ip m e n t c o o rd in a ti o n (y ) equipment coordination(x)
Figure 3. Typical snapshot of animation for yawing dynamics
2.3 Results and discussion of the animations
From the direction based responding animation, it shows that some turbines have abnormal yaw behaviour; and at some direction angles, most turbines show a big standard deviation. WTG42 and WTG45 show every different yawing direction compared to other turbines and the wind direction.
The time based responding animation also shows, at some time stamps, these turbines behave irregularly.
WTG45 shows poor direction match almost all the time, while WTG42 behaves normally most of the time but abnormally approximately the last 10% of the time.
[image:2.595.328.517.437.579.2](1) The wind turbine points in the right direction and generates proper power, but the direction sensor has problems due to:
a) bias error (wake effect involved) b) poor resolution or measurement noises
(2) The wind turbine points in the wrong direction and generates lower power than it should do. The direction sensor is in a good condition. There are 2 types of possible turbine direction problems:
a) wind vane offset—there’s a big difference between wind direction and yaw direction
b) noisy or poor control system
(3) The wind turbine points in the wrong direction (power generated is low), and the direction sensor has problems.
(4) A combination of the above.
3 Basic analysis tools and theory
3.1 Cosine-cubed law
Cosine-cubed law [4] results from a simple analysis of yawed wind turbine performance but is reasonably accurate. It gives the relationship between the yaw error angle and the power output:
∙P (1)
where δ is the yaw angle relative to the opposite of the wind direction and P is the wind turbine power with flow perpendicular to the rotor.
This expression gives reasonable estimate of how yaw error affects the power output. If the difference between the nacelle direction and the wind direction as measured at the met mast is large, but the power output drop is not correspondingly high, it is suspected that this is a direction sensor error.
3.2 Power curve
A power curve [4] presents the relationship between the power output and the wind speed, as shown in Figure 4. Three specific points are: in speed, rated output speed, and cut-out speed.
Figure 4. Typical steady wind speed Power curve
Within the wind farm, turbines in line with other turbines encounter wakes. These wakes change the wind speed to a certain degree. The local wind speed varies from the wind speed measured by the wind mast. However the relationship between wind speed as measured by the nacelle anemometer and the power output of this individual turbine should not change, assuming the turbine is healthy. Therefore the wind speed used to plot the power curve of the individual turbine for comparison purposes should be the one measured from the wind anemometer set on the nacelle, rather than measured from the wind mast.
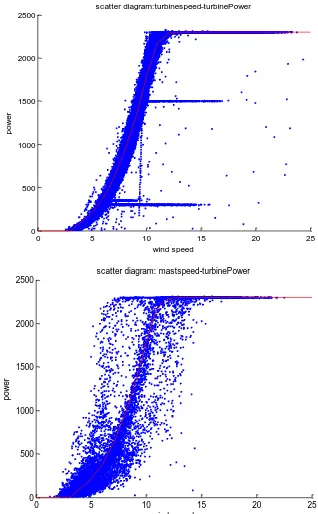
Figure 5 is a comparison of scatter plots of speed-power relationship using wind speed from turbine anemometer and wind mast. In both diagrams, a red curve representing the nominal power curve is plotted. The upper diagram is the local-wind-speed plot, whereas the lower one uses wind speed from the wind mast. The points in local-wind-speed plot are more concentrated and shape better to fit the nominal power curve when compared to the lower plot. It shows that the local wind speed gives a better description of the turbine power performance. The straight lines parallel to the rated region line are the product of the de-rated operation.
0 5 10 15 20 25
0 500 1000 1500 2000 2500
scatter diagram:turbinespeed-turbinePower
wind speed
p
o
w
e
r
0 5 10 15 20 25
0 500 1000 1500 2000 2500
scatter diagram: mastspeed-turbinePower
wind speed
p
o
w
e
[image:3.595.344.503.381.638.2]r
Figure 5. Comparison of scatter plots of speed-power relationship using wind speed from turbine anemometer and wind mast.
3.3 Correlation analysis of yaw dynamics
The cross-correlation coefficient [1] has the expression as
(2)
[image:3.595.92.245.650.760.2]to have the same length as the longer one). When x and y are the same vector, it turns to be the auto-correlation.
The auto-correlation of the yaw position indicates how quickly the yaw direction changes in time. If for a small amount of time lags the autocorrelation drops dramatically, it means the yaw direction changes quickly. To compare the auto-correlation of yaw direction for each individual turbine and the auto-correlation of wind direction is a tool to examine turbine speed of yawing and could indicate faulty yaw control.
In addition, the cross-correlation of the yaw direction with wind direction measures how quickly the turbine yaw direction responds to changes in wind direction.
4 Detail analyses of selected problems
From the problem overview, WTG45 and WTG42 show abnormal performance. Therefore in this session, these two turbines together with turbines in the same row are analysed using the tools described in Section 3.
4.1 Turbine dynamics
[image:4.595.307.547.82.108.2]4.1.1 Yaw dynamics
Figure 6 shows the yaw dynamics of WTG42, 43, 44 and 45, and the wind direction measured by the met mast. The number of time stamps after sorting is 10610. From the figure, WTG43 and 44 show a good agreement with the met mast. WTG45 shows a direction offset all along the time stamps, and WTG42 shows a direction offset at the last 7% (~800) time stamps.
0 2000 4000 6000 8000 10000 12000
180 200 220 240 260 280 300 320 340
measure points
d
ir
e
c
ti
o
n
(
d
e
g
)
WTG42 WTG43 WTG44 WTG45 windmast
Figure 6. Yaw dynamics of WTG42-45 and the wind direction dynamics
The mean direction values of all the selected turbines and wind met mast are shown in table 1. It indicates that WTG45 has an offset of -53.7 degree, and WTG42 has 30.6 degree for the last 7% time, compared with the wind direction.
Device WTG42 WTG42(last 7% time)
WTG43
Nacelle direction (˚)
270.3 305.1 278.9
Device WTG44 WTG45 Wind
Nacelle direction (˚)
261.2 220.7 274.4
Table 1. Mean direction of WTG42-45 and wind direction in whole time stamps and of WTG42 in last 7% time stamps
4.1.2 Power dynamics
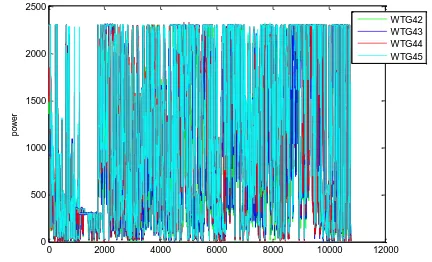
WTG43 and 44 have similar display of yaw direction with the wind, thus if WTG42 and WTG45 have yaw problems, they will show different power output from WTG43 and WTG44. Figure 7 shows the power dynamics of WTG42-45. It indicates that all the 4 turbines have a similar power output.
0 2000 4000 6000 8000 10000 12000 0
500 1000 1500 2000 2500
p
o
w
e
r
WTG42 WTG43 WTG44 WTG45
Figure 7. Power dynamics of WTG42-45
This figure confirms that WTG45 and WTG42 display abnormal yaw performance, but have roughly same power output dynamics as WTG43 and WTG44. The dynamics are further analysed by the correlation analysis. The power performance is further analysed by the power curve.
4.1.3 Wake losses alignment analysis
Wind can come from any direction due to the monsoon and other geographic reasons, however, when wind comes in line of a row in which a turbine of study is located, the wake loss should be the most significant. Comparing this direction and the actual wind direction measured by the turbine of study shows the potential yawing problem or sensor errors.
WTG48 is set as a reference turbine; the relative power outputs of WTG43-45 are calculated and plotted against wind direction measured at each turbine. In theory, when wind comes in the line of WTG48 and the turbine of study, as shown in figure 8, the power loss should be maximum. These theoretical wind directions are shown in table 2.
[image:4.595.323.539.227.358.2] [image:4.595.69.273.490.610.2]Figure 8. Thereotical wind incoming directions which cause the largest power drop of WTG43-45
245 250 255 260 265 270 275 280 285 290 295 300 305 310 315
0.2 0.3 0.4 0.5 0.6 0.7 0.8 0.9 1
wind direction(degree)
re
la
ti
v
e
p
o
w
e
r
H04 to G03 H04 to G05 H04 to G04 H04
272.3 248.9
302.3
Figure 9. Relative power output of WTG43-45 compared to WTG48 against wind direction
turbine WTG43 WTG44 WTG45
Theoretical wind direction(˚)
255.75 300.58 181.23
Actual wind direction (˚)
272.3 302.3 248.9
[image:5.595.79.258.83.211.2]difference(˚) 16.55 1.72 67.67
Table 2. The wind direction when the largest relative power losses occur in theory and reality
4.2 Correlation analysis
4.2.1 Angular processing
All angles used in recording the yaw or wind direction in SCADA system are between 0 and 360 degree, in which the low frequent (long term) fluctuation of the direction dynamics is not of interest, whereas the short term oscillation is relevant to how the yaw direction response to the wind.
To eliminate the impact of the fact that wind direction tends to rotate with the passing of weather systems, all angles showing a rotational direction change that crosses the 360/0 line have been added up as a slope, which means after the angle of 360 degree, the next angle, for example 1 degree is added to be 361 degree, and so on. A process of detrending is then applied to the result to eliminate the long term trend.
The upper two subplot of Figure 8 shows the angular processing. The top subplot shows the accumulative trend, whereas the middle subplot shows the detrended fluctuation.
4.2.2 Autocorrelation
Autocorrelation calculations are applied to all selected yaw direction dynamics and the wind dynamics using the detrended data. It shows how the direction changes with different time lags.
The bottom subplot of Figure 10 shows the autocorrelation. It shows that WTG45 changes its yaw direction even more rapidly than the wind, and it has fluctuations at all time lags. Other turbines which include WTG42 have a smoother trend of yaw changing.
0 1 2 3 4 5 6
x 104 0
1 2 3x 10
4 turbine42 43 44 45 accumulated direction
0 1 2 3 4 5 6
x 104
-2000 0 2000
detrended direction
-5 -4 -3 -2 -1 0 1 2 3 4 5
x 104 -0.5
0 0.5 1
time(s)
c
o
rr
e
la
ti
o
n
c
o
e
ff
e
c
ie
n
t
WTG42 WTG43
[image:5.595.63.273.246.384.2]WTG44 WTG45 wind
Figure 10. Processed direction dynamics and autocorrelation of dynamics of WTG42, 43, 44 and 45, and wind
4.2.3 Cross-correlation
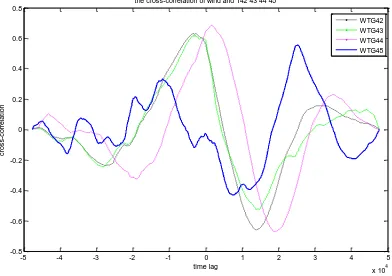
Figure 11 is the cross-correlation which shows how yaw direction changes with the wind direction. In this figure, WTG43 and WTG44 are the comparisons. Since all turbines have their geological positions in the wind farm, the short term response time to the wind which is measured from one met mast is not the same. This explains the different time lags of the response peaks of these turbines. Apart from the different response time lags, they all show a basically smooth trend, which include WTG42.
In contrast, WTG45 shows abnormal fluctuations at all the time lags. This exposes that this turbine has problematic direction yawing or sensor error.
-5 -4 -3 -2 -1 0 1 2 3 4 5
x 104
-0.8 -0.6 -0.4 -0.2 0 0.2 0.4 0.6 0.8
the cross-correlation of wind and T42 43 44 45
time lag
c
ro
s
s
-c
o
rr
e
la
ti
o
n
[image:5.595.321.554.257.401.2] [image:5.595.329.525.616.754.2]Figure 11. Cross-correlation diagram of wind and WTG42-45
4.3 Power curve
Power curve here is to show the relationship between the wind speed and the power output. As described in Section 3, all power curves plotted here use local wind speed measured by the nacelle anemometer. A nominal power curve for this type of turbine is plotted to be the comparison. In addition, the power losses are compared with results calculated from the cosine-cubed law.
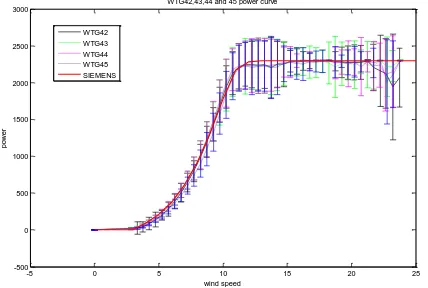
As shown in figure 11, all four turbines show a good agreement with the nominal power curve. Between the cut-in speed and the rated speed, all four curves have high similarity of the nominal curve. After the rated speed, because of the de-rated operation, there are fluctuations. However, all four turbines show a high similarity with each other, among which WTG43 and WTG44 are considered to the reference healthy turbines. This indicates that WTG42 and WTG45 have normal power output.
-5 0 5 10 15 20 25
-500 0 500 1000 1500 2000 2500 3000
WTG42,43,44 and 45 power curve
wind speed
p
o
w
e
r
WTG42 WTG43 WTG44 WTG45 SIEMENS
Figure 11. Power curve of WTG42-45 and nominal power curve from SIEMENS
The cosine-cubed law indicates that when the angle error is as much as 53.7 ( 45, as calculated in 4.1), the power drops 87.7 . n the similar way, when the angle error is 3 .6 , the power drops 32.2%. These results are inconsistent with what the power curve shows. None of the power curves show drops of over 15.7% (the lowest point of WTG45 at 23.2 m/s as 1940 kW, compare to the rated power 2300 kW).
From these technical analyses, a conclusion can be initially drawn as WTG42 and WTG45 have direction sensor errors and actually behave normally in terms of yawing and power generation.
Conclusion
The maximisation of power output and reduction of the wake effects are important for good wind farm operation. In this context, a research challenge is to distinguish sensor error from yawing problems that degrade power production. In this paper, a particular wind farm—Lillgrund wind farm— has been analysed. To identify the potential problem turbines in this wind farm, two types of animations have been made. From these animations, WTG42 and WTG45 have been
found to behave severely abnormally. Four hypothesises to explain this behaviour have then been outlined. To check the validity of these hypothesises a series of analysis tools have been developed and applied. Yaw and wind dynamics have roughly showed when and to what degree these two turbines perform differently. The power dynamics has showed similar power output of each turbine. The wake losses alignment analysis has provided a different angle to qualitatively measure the sensing or yawing problem. The correlation analyses have confirmed the first half of the first hypothesis. An angular processing has been applied to the original direction data for distinguishing the trend and the oscillation. A comparison of power curves has been then undertaken for confirmation of the last half of this hypothesis. These power curves have been got from data of WTG42, 43, 44, and 45 and the nominal power curve from SEIMENS. From this comparison, WTG42 and WTG45 have shown normal power outputs against the local wind speed. Therefore, it can be concluded as WTG42 and WTG45 have direction sensor error but don’t have generation problem. From the dynamics analysis, WTG42 shows a mean bias of 30.6158 degree for the last 7% time and WTG45 shows a mean bias of -53.7044 degree of all the time, which is roughly the same as the result from wake losses alignment analysis of 67.67 degree.
Acknowledgements
We would like to thank Dr Alasdair McDonald, who had introduced and also supervised this project.
We would also like to extend our thanks to Vattenfall Research & Development more widely for making the SCADA data available for this research.
References
[1] Croxton, F. E. et al, Applied general statistics, Prentice-Hall, 1967
[2] Jan-Ake Dahlberg, Assessment of the Lillgrund
Windfarm, Powre Performance, Wake Effects, Lillgrund
Pilot Project, 10 Sep 2009
[3] R.J. Barthelmie et al, Flow and wakes in large wind
farms: Final report for UpWind WP8, Feb 2011
[image:6.595.60.274.317.461.2]![Figure 1 [1]. Layout of Lillgrund wind farm](https://thumb-us.123doks.com/thumbv2/123dok_us/1670124.120536/1.595.333.522.544.680/figure-layout-lillgrund-wind-farm.webp)