City, University of London Institutional Repository
Citation:
Phillips, J. P., Langford, R. M., Chang, S. H., Kyriacou, P. A. and Jones, D. P.
(2011). Photoplethysmographic measurements from the esophagus using a new fiber-optic
reflectance sensor. Journal of Biomedical Optics (JBO), 16(7), 077005. doi:
10.1117/1.3598858
This is the published version of the paper.
This version of the publication may differ from the final published
version.
Permanent repository link:
http://openaccess.city.ac.uk/8128/
Link to published version:
http://dx.doi.org/10.1117/1.3598858
Copyright and reuse: City Research Online aims to make research
outputs of City, University of London available to a wider audience.
Copyright and Moral Rights remain with the author(s) and/or copyright
holders. URLs from City Research Online may be freely distributed and
linked to.
City Research Online:
http://openaccess.city.ac.uk/
publications@city.ac.uk
Photoplethysmographic measurements
from the esophagus using a new
fiber-optic reflectance sensor
Justin P. Phillips
Richard M. Langford
Serene H. Chang
Journal of Biomedical Optics 16(7), 077005 (July 2011)
Photoplethysmographic measurements from the
esophagus using a new fiber-optic reflectance sensor
Justin P. Phillips,aRichard M. Langford,bSerene H. Chang,bPanayiotis A. Kyriacou,aand Deric P. Jonesa
aCity University London, School of Engineering and Mathematical Sciences, Northampton Square, London, EC1V 0HB,
United Kingdom
bSaint Bartholomew’s Hospital, Barts and The London NHS Trust, Anaesthetic Laboratory and Department, London,
EC1A 7BE, United Kingdom
Abstract. A prototype fiber-optic reflectance-mode pulse oximetry sensor and measurement system is developed for the purposes of estimating arterial oxygen saturation in the esophagus. A dedicated probe containing miniature right-angled glass prisms coupled to light sources and a photodetector by means of optical fibers is designed and used to record photoplethysmographic (PPG) signals from the esophageal epithelium in anesthetized patients. The probe is inserted simply by an anesthesiologist in all cases, and signals are recorded successfully in all but one of 20 subjects, demonstrating that esophageal PPG signals can be reliably obtained. The mean value of the oxygen saturation recorded from the esophagus for all subjects is 94.0 ± 4.0%. These results demonstrate that SpO2may be estimated in the esophagus using a fiber-optic probe.C2011 Society of Photo-Optical Instrumentation Engineers
(SPIE). [DOI: 10.1117/1.3598858]
Keywords: pulse oximetry; esophagus; fiberoptic; photoplethysmography; oxygen saturation.
Paper 11053R received Feb. 3, 2011; revised manuscript received May 3, 2011; accepted for publication May 19, 2011; published online Jul. 18, 2011.
1 Introduction
Pulse oximeters are reported to fail in patients with compromised peripheral perfusion.1,2 Pulse oximetry is a pulse-dependent technique, and any significant reduction in the amplitude of the pulsatile component of the photoplethysmographic (PPG) signal can lead to inaccuracies in the reported blood oxygen saturation (SpO2) values.3When peripheral perfusion is poor, as in states of hypovolemia, hypothermia, and vasoconstriction, oxygenation readings have been shown to become unreliable or, in severe cases, cease completely.4–6In a retrospective study where 9203 computerized anesthesia records were reviewed, gaps in pulse oximetry data of at least 10 min were reported in 9.18% of cases.7Developments in pulse oximetry technology, in particular, Masimo signal extraction technology (SET) have demonstrated improved performance in low-perfusion states.8 However, in the complete absence of any peripheral pulse, or in patients with severe burns or other external injuries, peripheral probes would be inapplicable.
To overcome the problems associated with the measurement of SpO2at peripheral sites, an optical fiber-based oximetry sys-tem was designed for estimating the oxygen saturation (SpO2) in internal tissue from photoplethysmographic signals obtained using red and infrared light sources. The esophagus was cho-sen as a suitable internal measurement site because it is well supplied with arterial blood and its internal surface is readily accessible in anesthetized patients. Kyriacouet al. previously described a non-fiber-optic esophageal pulse oximetry system.9 A reflectance-mode esophageal probe comprising two infrared and two red light-emitting diodes [(LEDs), of peak emission
Address all correspondence to: Justin Phillips, City University London, School of Engineering and Mathematical Sciences, Northampton Square, London, EC1V 0HB, United Kingdom; Tel: 07515–352629; Fax: 020–7040-8568; E-mail: justin.phillips.1@city.ac.uk.
880 and 655 nm, respectively] arranged adjacent to a photode-tector was designed to fit into a size 20 French gauge plastic transparent disposable stomach/esophageal tube.10
An initial clinical study was performed in healthy patients un-dergoing general anesthesia requiring tracheal intubation. After induction of anesthesia, the probe was placed into the esoph-agus until the end of the probe was between 25 and 30 cm from the upper incisors. A finger probe containing an identical arrangement of optoelectronic components was placed on the finger for comparison. It was found that the amplitudes of the esophageal PPGs were on average approximately three times larger than those obtained simultaneously from a finger for both wavelengths.
A follow-up clinical study11,12 investigated and compared esophageal and finger PPG signals and SpO2 in 49 patients undergoing hypothermic cardiothoracic bypass surgery. Photo-plethysmographic signals were observed at various depths in the esophagus and esophageal SpO2values were compared to those measured using a commercial finger pulse oximeter. Measur-able PPG traces at red and infrared wavelengths were obtained in the esophagus in all 49 patients.11The bias (commercial pulse oximeter minus esophageal pulse oximeter) was−0.3% and the standard deviation was 1.5%. Of the 49 patients included in the study, it was found that five patients had one or more periods of at least ten consecutive minutes, during which the commercial finger pulse oximeter failed to display PPG signals and SpO2 values, despite being correctly positioned on the finger. Con-versely, the esophageal pulse oximeter operated successfully throughout these periods. Use of the esophageal pulse oximeter has also been successfully demonstrated in patients suffering from major burns.13 Another study using a smaller version of the esophageal pulse oximetry probe showed that reliable signals could be obtained from neonatal and paediatric patients.14
Phillips et al.: Photoplethysmographic measurements from the esophagus...
Although the non-fiber-optic probe performed satisfactorily, the use of an optical fiber-based probe was suggested because the use of fibers confers several benefits and advantages. As well as permitting miniaturization of the probe, silica glass optical fibers are inert and thus are inherently biocompatible and steril-izable. In addition, the fibers are insulators; thus, the patient is electrically and thermally isolated from the optoelectronic com-ponents that are confined to the instrumentation unit. The use of optical fibers for tissue illumination and to transmit photo-plethysmographic signals from tissue has been demonstrated in clinical applications, notably in pulse oximeters used in mag-netic resonance imaging scanners.15 In the research domain, fiber-optic photoplethysmographic probes have been used for cerebral oximetry,16,17spinal cord perfusion monitoring,18and intraoperative assessment of splanchnic perfusion.19
2 Methods
2.1 Fiber-Optic Sensor
In the present study, a fiber-optic sensor for use in the esophagus20was designed and evaluated in 20 patients undergo-ing surgery requirundergo-ing tracheal intubation and mechanical ven-tilation. The esophageal sensor contains a pair of fibers, each coupled to a prism that has the function of changing the path of the light through an angle of 90 deg. The light is thus trans-mitted and received in a direction perpendicular to the axis of the fiber, unlike a bare fiber, which transmits and receives light in a cone whose axis is aligned with the cylindrical axis of the fiber. Once in position within the esophageal lumen, the probe illuminates the mucosal wall of the esophagus along an axis
Fig. 1 Photographs of (a) a prism attached to an optical fiber prior to
fabrication of the esophageal probe and (b) the finished probe.
Fig. 2 Simplified diagram of the fiber-optic esophageal oximetry
probe. Approximate dimensions shown in millimeters.
normal to the wall of the esophagus, and is similarly sensitive to light backscattered normally from the esophageal wall.
The esophageal probe was constructed from a pair of optical fibers each with a core diameter of 600μm. The distal ends were polished flat using grade 5 followed by grade 3 sandpaper. A right-angled triangular glass prism (Edmund Optics, York, United Kingdom) of dimensions 2×2×2 mm was affixed to the ends of each optical fiber using 144-M glass adhesive (Dymax Inc., Torrington, Connecticut), as shown in Fig.1(a). The re-flecting face (the hypotenuse face) of each prism was covered with OP-19 optical blocking adhesive (Dymax Inc.) and the fibers, with the prisms attached, were placed in a hemicylindri-cal mold. A two-part biomedihemicylindri-cally compatible epoxy resin was then injected into the mold and left to set. The blocking adhesive was then removed, and successive layers of epoxy were added taking care to keep the reflecting surfaces of the prisms free of epoxy, which was achievable by injecting the liquid epoxy using a syringe and needle. The viscosity of the epoxy prevented it from flowing onto the outer reflecting face of each prism. Each layer of epoxy was allowed to set until the probe was almost cylindrical in shape. The probe was filed with emery board until almost perfectly cylindrical as shown in Fig.1(b). A diagram of the finished probe is shown in Fig.2.
The probe was designed for insertion into a size 18 French gauge stomach feeding tube. The stomach tube keeps the probe isolated from body fluids; thus, the probe may be reused with a new tube without the risk of cross-contamination between pa-tients. The stomach tube has two perforations close to the distal end that were blocked using a silicone bung inserted through one of the perforations and advanced proximally prior to use (see Fig. 3). The tube was also marked using a nontoxic sterile
Fig. 3 Esophageal probe inserted into a size 18 French gauge stomach
feeding tube.
[image:4.630.328.566.72.226.2] [image:4.630.76.294.453.728.2] [image:4.630.328.565.655.731.2]Phillips et al.: Photoplethysmographic measurements from the esophagus...
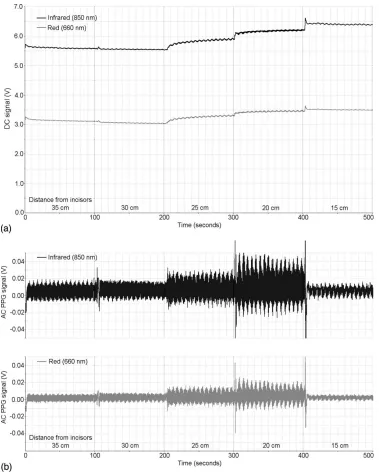
Fig. 4 Example of a 100-s recording of the dc (a) and normalized ac PPG (b) infrared and red signals at all five measurement depths for one patient
(patient number=17).
permanent marker at 5-cm intervals to enable accurate position-ing in the esophagus. As a further precaution, the probe itself was decontaminated in a 70% propan-2-ol solution between patients.
2.2 Data Acquisition System
The data acquisition system for this study17has been developed and evaluated in our laboratory and is based on a fiberoptic probe comprising two optical fibers, one of which is used to transmit light to the tissue and the other to return a fraction of the backscattered light to a photodetector. A signal process-ing system consistprocess-ing of a circuit interfaced with a notebook computer has been implemented for calculation of clinical
vari-ables from the measured light intensities and is subsequently described.
[image:5.630.127.506.71.543.2]Phillips et al.: Photoplethysmographic measurements from the esophagus...
Fig. 5 Thirty-second samples of the normalized ac PPG waveforms obtained at each measurement depth. The waveforms were obtained from the
same data set shown in Fig.4. All traces are plotted on the same vertical scale.
Corporation Ltd.). The photodetector is coupled directly to the receiving optical fiber.
An instrumentation unit is used for the control of the light sources and acquisition of signals from the tissue. This hardware is interfaced to a 16-bit DAQCard-AI-16XE-50 data acquisition card (National Instruments Inc., Austin, Texas) installed into a notebook computer. The LEDs are driven by a pair of switchable regulated current sources, one for each wavelength, supplying 25 and 14 mA to the red and infrared LEDs, respectively. Timing signals are provided by a programmable counter and timer built into the data acquisition card.
The photodiode is connected to a differential transimpedance amplifier. The output of the transimpedance amplifier is fed into a demultiplexer, and the signals are separated into three com-ponents, representing the infrared and red light intensities. The total intensities of the red and infrared signals are obtained by filtering to remove high-frequency switching noise from the
demultiplexer using second-order low-pass Butterworth filters, each with a cutoff frequency of 16 Hz (at –3 dB). A further high-pass filter stage with a cutoff frequency of 0.4 Hz is in-corporated into each channel to separate the PPG (or ac) signal from the total (ac+dc) signal. The instrumentation is powered by two 12-V 1.2-Ah sealed lead-acid batteries (Yuasa Battery Inc., Laureldale, Pennsylvania). The signals are all fed into the analog-to-digital converter built into the data acquisition card installed in the notebook computer running a LabVIEW (Na-tional Instruments Inc., Austin, Texas) Virtual Instrument (VI). The VI reads the digitized signals at a rate of 100 samples per second and records the signals in a spreadsheet file.
2.3 Patient Measurements
The study was approved by the local Independent Ethics Com-mittee and permission was given to conduct the study in 20
[image:6.630.124.512.261.517.2]Phillips et al.: Photoplethysmographic measurements from the esophagus...
Fig. 6 Graphs showing mean (± SEM) dc signal levels (a) and the unnormalized mean (±SEM) peak-to-peak amplitudes of the ac PPG signals (b)
plotted against depth in the esophagus for all 19 patients.
patients. The instrumentation was also approved for safety by the Medical and Healthcare Products Regulatory Agency (MHRA). Patients undergoing minor general surgical procedures requir-ing tracheal intubation and ventilation were deemed suitable for this study. Adult patients aged (18–70) and deemed “low risk” by the American Society of Anesthesiologists (score of 1–3) were identified from the elective operating lists at Barts and The London NHS trust. Any patients with esophageal pathologies, or those in whom difficulty or increased risk of probe placement was anticipated, were excluded.
After induction of anesthesia and immediately after tracheal intubation, the probe contained within a sterile stomach tube was inserted into the esophagus by the anesthetist, via the pa-tient’s mouth, under direct vision with a laryngoscope. The tip of the probe was placed at a depth of 35 cm in the esophagus as measured from the front incisors. Once the probe was in posi-tion, the light sources were switched on and signals recorded for 100 s. A 100-s measurement period was chosen to allow suffi-cient data collection without unnecessarily prolonging the pa-tient’s anesthesia. The probe was then withdrawn 5 cm at a
Fig. 7 Graph showing normalized mean (±SEM) peak-to-peak
ampli-tude of ac red and infrared PPG signals measured from the esophagus in 19 patients.
time and signals were recorded for a further 100 s at each position until the probe was at a depth of 15 cm. The arte-rial oxygen saturation was measured using a commercial finger pulse oximeter (Datex-Ohmeda, Helsinki, Finland). The probe was removed at the end of the measurement period, before the patient was moved from the anesthetic room to the operating theater, and surgery commenced. Each patient was reviewed, postoperatively, to check for any adverse events.
2.4 Signal Processing
The ac PPG signals were normalized by dividing the signal by the simultaneously recorded ac+ dc signals. The peak-to-peak amplitudes of the normalized PPG signals were calculated for each heartbeat using a peak-and-valley detection algorithm in-corporated into a LabVIEW virtual instrument. The mean value ofRRfor each data stream (100 s) for each wavelength thus,
RR=
n
i=1
Ai,R
/n
n
i=1
Ai,IR
/n
(1)
where theAi,RandAi,IRare the peak-to-peak amplitudes of the
i’th red and infrared normalized PPG cycle in the data streams, respectively, andnis the total number of PPG cycles (heartbeats) in the data stream. The ratio of ratiosRRwas thus averaged over a 100-s time period. The mean value ofRRwas used to estimate the arterial oxygen saturation (SpO2) by substituting in
SpO2=110−25RR (2)
[image:7.630.143.491.73.237.2] [image:7.630.72.289.535.721.2]Phillips et al.: Photoplethysmographic measurements from the esophagus...
3 Results
Signals were obtained successfully from 19 patients, with one failure attributable to a technical fault. Examples of the dc and ac signals recorded at all five measurement depths for a typical patient are shown in Fig.4. These signals represent a continu-ously recorded data stream. The probe was repositioned within a few seconds between measurements, by simply withdrawing it by 5 cm at the mouth, causing minimal interference to the traces.
It can be seen from Fig.4(a)that moving the probe to each monitoring position caused a small change in dc signal level. Furthermore, in some cases there was a small “settling-in” time during which the signal level changed slowly. In the example shown, there was significant drift in the signal during the entire time the probe was at the 25-cm position. The dc signal also exhibited a small amount of periodic modulation occurring at the respiratory frequency. Figure4(b)shows that the amplitude of the ac PPG signal varied considerably with measurement depth, and there was also respiratory modulation present in this signal. Note that the dc and ac PPG waveforms have been com-pressed horizontally so little detail can be discerned in either case.
Figure5shows 30-s samples of the waveforms obtained at each depth for the same patient. The waveforms in this plot were also normalized by dividing the ac signal by the simul-taneously recorded dc signal. In all cases, the most significant periodic feature occurred at a frequency consistent with the car-diac frequency, but the waveform also contained a low-frequency modulation at∼0.18 Hz, equal to the frequency of artificial ven-tilation. This modulation affected the position of the peaks and “valleys” (i.e., the waveform’s peak-to-peak amplitude) and the position of the “baseline” was also modulated. It can be seen that the morphology of the PPG waveform varied considerably with the depth of measurement. As well as the change in am-plitude with depth, the ventilator modulation varied in ampli-tude relative to the periodic cardiac variation. Between 35 and 25 cm, for example, there was significant baseline modulation but at depths of 20 cm or less, modulation of the peak-to-peak amplitude appeared to dominate the signal.
Figure6shows graphs of the mean dc signal levels and mean ac PPG peak-to-peak amplitudes of the signals calculated over the 100-s measurement periods for all 19 patients. The average dc signal level was calculated for each depth for each patient, and the mean (±SEM) values were calculated for all patients. The average un-normalized ac signal amplitudes were calculated for each depth and each patient, and again the mean (±SEM) values calculated for all 19 patients. It can be seen that the dc signals showed a slight trend of increasing signal level with increasing depth, although the differences in signal levels between depths were not statistically significant. As with the individual example shown in Figs.4and5, the mean ac signal amplitudes showed considerable variation with depth. Specifically, the ac signals recorded from the mid to lower esophagus (depths of 20 cm or greater) had considerably larger mean amplitudes at both wavelengths than those in the upper esophagus (15 cm).
Figure7 shows a graph of the mean (±SEM) of the nor-malized ac PPG amplitudes at red and infrared wavelengths at the five monitoring depths. The signals were normalized by di-viding the ac signal by the simultaneously recorded dc signal
level before calculating the mean values. Such normalized ac PPG amplitudes may be used in Eq.(1)to calculate the ratio of ratios (RR). The maximum mean esophageal amplitude for both wavelengths occurred at the depth of 20 cm. The amplitudes of the red and infrared normalized PPG signals obtained at 15 cm were significantly smaller (P<0.001) than those obtained at all other depths, as evaluated by a paired Student’st-test. There was no significant difference between amplitudes at other adjacent depths (i.e., 20–25, 25–30, and 30–35 cm).
The mean ratio of ratios for each patient, at each measure-ment depth was calculated from the normalized PPG amplitudes, using Eq.(1)and the estimated oxygen saturation calculated us-ing Eq. (2). The estimated oxygen saturations obtained from each depth are presented in Table1. In some cases, it was not possible to calculate the ratio of ratios because the signal qual-ity was very poor. It can be seen that there is considerable
Table 1 Arterial oxygen saturation SpO2derived from PPG signals
obtained at all five depths in the esophagus for each patient.
SpO2estimated at each esophageal depth (%)
Patient # 15 cm 20 cm 25 cm 30 cm 35 cm CV%
1 * 93.9 91.1 90.9 85.5 3.89
2 * 92.7 93.6 92.2 * 0.76
3 97.6 92.9 97.4 100.6 103.2 3.93
4 96.2 98.0 84.0 79.1 77.2 11.1
5 * 90.0 93.4 96.7 101.1 4.97
6 * 95.1 100.0 89.9 * 5.32
7 * 94.4 94.2 100.0 84.4 6.95
8 87.4 93.3 91.5 88.3 99.5 5.24
9 95.1 95.6 96.7 88.7 98.1 3.82
10 89.3 91.9 91.7 94.1 93.9 2.12
11 77.3 90.2 87.0 95.2 92.7 7.85
12 98.3 91.9 94.7 93.5 91.9 2.81
13 79.4 92.4 92.0 98.0 92.9 7.58
14 94.4 92.7 96.4 94.5 69.4 12.6
15 * 89.9 93.6 89.3 92.2 2.20
16 91.5 92.5 96.5 83.8 97.4 5.85
17 94.8 93.7 89.4 93.0 94.6 2.35
18 95.9 94.0 90.9 95.8 97.4 2.63
19 88.8 91.4 89.0 95.7 97.0 4.11
CV% 7.31 2.16 4.17 5.76 9.49
*No value could be calculated due to poor signal quality.
[image:8.630.327.569.332.746.2]Phillips et al.: Photoplethysmographic measurements from the esophagus...
Table 2Mean heart rate, mean normalized peak-to-peak amplitudes, mean ratio-of-ratios and SpO2derived from PPG signals obtained at the best
depth in the esophagus for each patient. Finger SpO2values from a commercial pulse oximeter are also shown. Note that the best depth giving the
maximum esophageal PPG signals varied from patient to patient and was usually between 20 and 30 cm.
Patient “Best” depth Mean heart rate Normalized PPG amplitudes Mean ratio- Mean esoph. SpO2 Finger SpO2
No. (cm) (min−1) Red (/10−3) Infrared (/10−3) of-ratios (%) (%)
1 30 65.6 10.7 14.0 0.76 90.9 99
2 20 72.5 11.6 16.8 0.69 92.7 99
3 30 92.4 1.03 2.74 0.38 100.6 100
4 25 63.2 7.14 6.86 1.04 84.0 99
5 25 64.5 16.5 24.8 0.67 93.4 98
6 25 88.1 4.94 12.4 0.40 100.0 100
7 30 81.7 3.72 9.33 0.40 100.0 99
8 25 61.9 4.82 6.52 0.74 91.5 99
9 20 75.0 3.22 5.58 0.58 95.6 99
10 35 88.6 2.68 4.16 0.64 93.9 99
11 30 76.8 4.85 8.21 0.59 95.2 98
12 35 68.4 3.98 5.51 0.72 91.9 99
13 30 77.9 3.73 7.80 0.48 98.0 100
14 30 77.1 4.14 6.68 0.62 94.5 99
15 25 77.1 2.57 3.91 0.66 93.6 100
16 25 85.5 3.66 6.78 0.54 96.5 100
17 20 71.4 5.59 8.59 0.65 93.7 99
18 25 58.9 6.08 7.95 0.76 90.9 99
19 25 60.6 1.67 1.99 0.84 89.0 100
variation both in the estimated oxygen saturation between pa-tients and, in many cases, between depths for a particular patient.
To compare the signals between patients, a “best” depth was chosen for each patient (i.e., the depth at which the infrared PPG amplitude was greatest). This depth was found by man-ual measurement of the amplitudes from printouts of the PPG waveforms. Table2summarizes several variables derived from the signals for each patient obtained at the best depth. It can be seen that, even if the largest PPG amplitudes obtained for each patient are compared, there is considerable variability in the val-ues of the amplitudes. The mean value (±SD) of the best depth oxygen saturation for all patients was 94.0% (±4.0%), while the mean (±SD) oxygen saturation recorded from the finger with the commercial pulse oximeter was 99.2% (±0.6%). The bias between the two measurements (esophageal and finger) was thus –5.2%.
4 Conclusion
Phillips et al.: Photoplethysmographic measurements from the esophagus...
PPG signals at 15 cm were significantly smaller than those at all other depths. These findings were similar to those of Kyriacou et al., who compared PPG signals at the same depths with their non-fiber-optic probe, except that, in the case of the red wavelength, they found no significant difference between the amplitudes at depths of 15 and 35 cm.11
The oxygen saturations estimated at all depths showed that there was large variation in values between patients and between depths for many patients. At some depths, the signal quality was poor; thus, a saturation value could not be produced. A best depth value was therefore chosen for each patient. The mean value of the best depth oxygen saturation was 94 ±4.0%, 5.2% lower than that recorded from the finger using the commercial pulse oximeter. The negative bias may be attributable to the use of an algorithm [Eq.(2)] for calculation the SpO2, which was de-veloped from experimental measurements using transmittance mode probes on a different measurement site (the finger rather than the esophagus). Kyriacouet al. found their esophageal mea-surements to be, on average, 6.5% lower than those measured from a commercial finger pulse oximeter.9
Another possible source of inaccuracy is the mechanical arte-fact induced by the patient’s heartbeat and ventilation due to the proximity of the probe to the heart and lungs. It has been observed that the PPG signals are sensitive to movement of the fiber tips relative to the tissue surface as well as to move-ment of the fibers themselves. Periodic (ac) modulation could be induced in the detected signals with cardiac and/or respira-tory frequency components. The respirarespira-tory frequency modu-lation was observed in the signals (see Figs.4and5), whereas cardiac frequency modulation would be impossible to distin-guish from the “real” PPG. It may be supposed that this induced movement modulation would be similar in magnitude for both wavelengths. This would result in the calculated ratio of ra-tios being higher than in the case with no movement because, in a hypothetical situation of movement present, with no PPG, the ratio of ratios would be equal to 1. The oxygen saturation would be underestimated, (because, for arterial blood, the ratio is normally<1).
This study aimed to investigate whether PPG signals could be obtained from internal vascularized tissue using a fiber-optic probe. Other than by commercial pulse oximetry (which is not considered a gold standard method), accurate measurements of the arterial oxygen saturations were not recorded; thus, further analysis of oxygen saturation in these patients was not deemed appropriate for this pilot study. The purpose of this study was merely to demonstrate that signals could be acquired in the majority of patients and that the oxygen saturation values de-rived from an approximate algorithm were in the expected range we might expect in this patient population under experimental conditions. These esophageal measurements demonstrated that PPG signals may be reliably obtained from internal tissue using a reflectance mode fiber-optic probe. A controlled study in a greater number of patients is planned, where readings from the esophageal pulse oximeter will be compared to CO-oximetry ar-terial blood samples. Esophageal Doppler blood flow will also be recorded. A separate animal study is also planned, where esophageal saturation will be recorded during induced hypox-emia. The data from these studies should allow a new esophagus-specific algorithm for calculation of oxygen saturation from the esophageal signals.
This study, as well as previous studies by Kyriacou
et al.,9–12,14have demonstrated that the esophagus has potential as an alternative monitoring site for pulse oximetry. The finger and earlobe will almost certainly remain the location of choice for pulse oximetry measurement in almost all cases, by virtue of the ease of access and noninvasiveness of these sites. Further-more, there is a very small possibility of gastresophageal injury, such as esophageal tear associated with placement of esophageal probes, whereas the risk of injury from a finger probe is neg-ligible. In certain clinical situations, such as extremely low-perfusion states where even SET-type pulse oximeters fail, or in patients in whom such sites are not available, the esophagus could provide a viable option because the central organs are preferentially perfused. A disposable fiber-optic probe similar to that described in this paper could perhaps be incorporated into gastric feeding tubes or similar medical equipment used in the intensive care unit (ICU). Such a device could also find application in neonates or small infants who are unwilling to tolerate a finger probe.
Acknowledgments
This work was supported by a grant from the Heptagon Fund.
References
1. J. W. Severinghaus and M. J. Spellman, Jr., “Pulse oximeter failure thresholds in hypotension and vasoconstriction,”Anesthesiology.73, 532–537, 1990.
2. J. T. Moller, N. W. Johannessen, R. Espersen, O. Ravlo, B. D. Pedersen, P. F. Jensen, N. H. Rasmussen, L. S. Rasmussen, T. Pedersen, and J. B. Cooper, “Randomized evaluation of pulse oximetry in 20802 patients: II. perioperative events and postoperative complications,” Anesthesiol-ogy.78, 445–53 (1993).
3. T. Kawagishi, N. Kanaya, M. Nakayama, S. Kurosawa, and A. Namiki, “A comparison of the failure times of pulse oximeters during blood pressure cuff-induced hypoperfusion in volunteers,”Anesthes. Analges.
99, 793–796 (2004).
4. H. Palve and A. Vuori, “Pulse oximetry during low cardiac output and hypothermia states immediately after open heart surgery.[see com-ment],”Crit. Care Med.17, 66–69 (1989).
5. H. Palve and A. Vuori, “Minimum pulse pressure and peripheral tem-perature needed for pulse oximetry during cardiac surgery with car-diopulmonary bypass,” J. Cardiothorac. Vasc. Anesth. 5, 327–330 (1991).
6. H. Palve, “Reflection and transmission pulse oximetry during compro-mised peripheral perfusion,”J. Clin. Monit.8, 12–15 (1992). 7. D. L. Reich, A. Imcenko, C. A. Bodian, J. Kraidin, J. B. Hofman,
M. Deperio, S. N. Konstadt, T. Kurki, and J. B. Eisenkraft, “Pre-dictors of pulse oximetry data failure,”Anesthesiology84, 859–864 (1996).
8. J. M. Goldman, M. T. Petterson, R. J. Kopotic, and S. J. Barker, “Masimo signal extraction pulse oximetry,”J. Clin. Monitor. Comput.16, 475– 483 (2000).
9. P. A. Kyriacou, A. R. Moye, D. M. Choi, R. M. Langford, and D. P. Jones, “Investigation of the human esophagus as a new monitor-ing site for blood oxygen saturation,”Physiol. Meas. 22, 223–232 (2001).
10. P. A. Kyriacou, A. R. Moye, A. Gregg, D. M. Choi, R. M. Langford, and D. P. Jones, “A system for investigating esophageal photoplethys-mographic signals in anaesthetised patients,”Med. Biol. Eng. Comput.
37, 639–643 (1999).
11. P. A. Kyriacou, S. Powell, R. M. Langford, and D. P. Jones, “Investi-gation of esophageal photoplethysmographic signals and blood oxygen saturation measurements in cardiothoracic surgery patients,”Physiol. Meas.23, 533–545 (2002).
Phillips et al.: Photoplethysmographic measurements from the esophagus...
12. P. A. Kyriacou, S. L. Powell, D. P. Jones, and R. M. Langford, “Evalua-tion of esophageal pulse oximetry in patients undergoing cardiothoracic surgery,”Anaesthesia58, 422–427 (2003).
13. S. K. Pal, P. A. Kyriacou, S. Kumaran, S. Fadheel, R. Emamdee, R. M. Langford, and D. P. Jones, “Evaluation of esophageal reflectance pulse oximetry in major burns patients,”Burns31, 337–341 (2005). 14. P. A. Kyriacou, A. Wardhaugh, D. P. Jones, R. M. Langford, and A. J.
Petros, “Investigation of photoplethysmographic signals in neonatal and paediatric patients,”Intens. Care Med.28(Suppl. 1), S111 (2002). 15. I. P. West, R. Holmes, and G. R. Jones, “Optical fibre based pulse
oximeter for monitoring in magnetic resonance scanners,”Proc. SPIE
2360, 94–97 (1994).
16. J. P. Phillips, R. M. Langford, S. H. Chang, K. Maney, P. A. Kyriacou, and D. P. Jones, “Cerebral arterial oxygen saturation measure-ments using a fiber–optic pulse oximeter,”Neurocrit. Care12, 278–285 (2010).
17. J. P. Phillips, R. M. Langford, P. A. Kyriacou, and D. P. Jones, “Pre-liminary evaluation of a new fibre-optic cerebral oximetry system,” Physiolog. Meas.29, 1383–1396 (2008).
18. J. P. Phillips, K. J. George, P. A. Kyriacou, and R. M. Langford, “Inves-tigation of photoplethysmographic changes using a static compression model of spinal cord injury,” inProc. of Annual Int. Conf. of IEEE Eng. in Med. & Biol. Soc., pp. 1493–1496 (2009).
19. M. Hickey, N. Samuels, N. Randive, R. M. Langford, and P. A. Kyria-cou, “Measurement of splanchnic photoplethysmographic signals using a new reflectance fiber optic sensor,”J. Biomed. Opt.15, 027012 (2010). 20. J. P. Phillips, R. M. Langford, S. H. Chang, K. Maney, P. A. Kyriacou, and D. P. Jones, “Evaluation of a fiber-optic esophageal pulse oxime-ter,” inProc. of Annual Int. Conf. of IEEE Eng. in Med. & Biol. Soc., pp. 1509–1512 (2009).