City, University of London Institutional Repository
Citation
:
Pelosini, L., Hull, C., Boyce, J. F., McHugh, D., Stanford, M. R. and Marshall, J. (2011). Optical Coherence Tomography May Be Used to Predict Visual Acuity in Patients with Macular Edema. Investigative Ophthalmology & Visual Science, 52(5), pp. 2741-2748. doi: 10.1167/iovs.09-4493This is the accepted version of the paper.
This version of the publication may differ from the final published
version.
Permanent repository link:
http://openaccess.city.ac.uk/5098/Link to published version
:
http://dx.doi.org/10.1167/iovs.09-4493Copyright and reuse:
City Research Online aims to make research
outputs of City, University of London available to a wider audience.
Copyright and Moral Rights remain with the author(s) and/or copyright
holders. URLs from City Research Online may be freely distributed and
linked to.
City Research Online: http://openaccess.city.ac.uk/ publications@city.ac.uk
1 Optical Coherence Tomography maybe used to predict Visual Acuity in patients
with Macular Oedema
Lucia Pelosini1, Christopher C Hull2, James F Boyce1, Miles R Stanford1, John
Marshall1
1
Department of Ophthalmology, Kings College London, Rayne Institute, St
Thomas’ Hospital, London, Lambeth Palace Road, London, SE1 7EH
2
Department of Optometry & Visual Science, City University, London
Grant information: The present study was funded by a grant of The Royal College
of Surgeons, London, United Kingdom
Disclosure:
JM is a paid consultant for OTI (Ophthalmic Technologies Inc., Toronto, Canada)
None of the other authors have a financial interest in the subject of the
presentation.
Word count:
Key words: cystoid macular oedema; optical coherence tomography (OCT);
2 Abstract
Purpose: To determine whether the volume of retinal tissue passing between the
inner and outer retina in macular oedema could be used to predict visual acuity.
Methods: Diabetic and uveitic patients with cystoid macular oedema (81 subjects,
129 eyes) were recruited. Best corrected LogMAR visual acuity and spectral optical
coherence tomography (OCT/SLO OTI, Toronto) were performed for all patients.
Coronal OCT scans obtained from a cross-section of the retina between the plexiform
layers were analyzed using a grid of 5 concentric radii (500µ, 1000µ, 1500µ, 2000µ,
2500µ centred on the fovea). The images were analyzed to determine the amount of
retinal tissue present within each ring. A linear regression model was developed to
determine the relationship between tissue integrity and LogMAR visual acuity.
Results: The volume of retinal tissue between the plexiform layers in ring 1 and 2 (up
to 1000 µ from the foveal centre) predicted 80% of the change in visual acuity using a
linear model. By contrast, central macular thickness within the central 1000 µ
predicted only 14% of the change in visual acuity.
Conclusions: This study showed that the cross-sectional area of retinal tissue between
the plexiform layers in cystoid macular oedema, as imaged by OCT, is a much better
predictor of visual acuity at baseline than central macular thickness. Further
prospective treatment trials are required to investigate this parameter as a predictor of
3 Introduction
Macular oedema results from abnormal accumulation of fluid in the central retina and
indicates compromised function in one or both of the blood retinal barriers. It is a
common sequel of many ocular conditions and the main cause of visual loss in
diabetic retinopathy1-5.
Any abnormal pooling of extracellular fluid may result in displacement of the spatial
relationships between retinal neuronal components. Small amounts of fluid may lead
to an increase in overall retinal thickness, whilst larger amounts may give rise to cell
free spaces as seen in cystoid macular oedema5.
Observations from histology and optical coherence tomography (OCT) give a false
impression of multiple cysts delineated by tissue structures in the Z-plane of the retina
(Figure 1). However, scanning electron microscopy shows that more commonly a
single cystic space is present within which a number of structures extend from the
inner to the outer retina (Figure 2). Such structures consist of columns of Muller’s
fibres together with the axonal elements of bipolar cells passing between the two
plexiform layers6. Empirical studies have demonstrated that the two plexiform layers
together with the outer limiting membrane form a physical resistance barrier to fluid
movements7. Thus, extracellular fluid may be contained within layers defined by
these resistance barriers. In diabetic retinopathy, cystic spaces may occur either
between the inner and the outer plexiform layers or between the outer limiting
membrane and the outer plexiform layer. In the former location, there is a potential to
displace bipolar cells leading to cell loss or compromised function, whilst in the latter,
only photoreceptor cells are at risk8, 9.
Given the fundamental role of bipolar cells in being the sole communication pathway
4 cells will compromise visual function10, 11. It follows that the more the retinal
thickness increases, the more such axons will be stretched and as a consequence some
will break. This is probably the mechanism underlying the apparent relationship
between increasing retinal thickness and decreasing visual acuity. By contrast, those
bipolar cells whose axons are closely adjacent to Muller’s fibres will have a greater
chance of surviving displacement because of the greater physical strength and support
provided by the adjacent Muller’s fibres11-16
.
Theoretically, a useful indicator of the visual acuity and potential visual outcome in
eyes with macular oedema would be to analyze the residual volume of tissue passing
between the two plexiform layers, as only such areas would allow passage of bipolar
axons between photoreceptors and ganglion cells. The impact of
photoreceptor-ganglion cell connectivity on visual acuity would further depend upon the location of
surviving axons within the central visual field17. Thus an optimal measurement of
potential function would be an evaluation of the number of vertical elements passing
between the plexiform layers, their diameter and eccentricity from the fovea.
This study had two objectives: 1) to assess new hardware for imaging retinal glial
tissue in cases of cystoid macular oedema 2) to investigate whether the amount of glia
and by association residual bipolar cells could be used as indicator of visual function
5 Methods
Experimental design
Patients with macular oedema were prospectively recruited from both diabetic and
uveitic outpatient clinics over a period of nine months. The study involved a baseline
assessment of visual function, ophthalmoscopy and OCT imaging at a single
timepoint. The research conformed to the tenets of the Declaration of Helsinki with
informed consent being obtained from the subjects subsequent to explanation of the
nature of the study. The protocol of the study was approved by the local ethics
committee (Protocol number: 06/Q0702/175).
Patient information was anonymized at the time of patient recruitment to allow
indipendent data analysis.
Inclusion criteria for the study were a clinical diagnosis of cystoid macular oedema
(CMO), confirmed either by OCT alone or by OCT and fundus fluorescein
angiography (FFA) at the time of enrolment. For each patient either one or both eyes
were included in the study.
Patients with coexisting ocular pathologies were excluded. Exclusion criteria included
the presence of media opacity affecting the quality of the OCT scan and angiographic
or clinical evidence of ischaemic maculopathy.
Subjects and clinical procedures
Each patient underwent a complete anterior segment examination by slit-lamp
biomicroscopy and best corrected visual acuity assessment using a LogMAR chart at
3 metres distance. All patients were then dilated using Phenylephrine 2.5% and
Tropicamide 1% and examined by indirect fundoscopy with a 78D lens. In the
6 of the study in order to assess retinal circulation and to allow exclusion of patients
with subclinical foveal ischaemia.
Optical Coherence Tomography
Optical coherence tomography was carried out using a Spectrum-OTI spectral domain
OCT/SLO system (Spectral OCTSLO model E, Spectrum-Ophthalmic Technologies
Inc., Toronto, Canada). This device is an optical imaging system, combining a
Confocal Scanning Ophthalmoscope and Optical Coherence Tomography. Both the
confocal fundus SLO image and the OCT image are generated through the same
optics and displayed simultaneously on the computer screen with pixel to pixel
correspondence. The system uses light generated from an infrared broadband super
luminescent diode (SLD) with a wavelength between 790nm and 950nm.
Cross-sectional images of the retina along the x-y plane (B-Scan), such as single line, radial
and raster scans, could be obtained as well as coronal images within the z plane
(C-scan).
In preliminary studies, scans were obtained using three different modes of operation.
First, a series of 24 radial scans over 360 degrees were automatically initiated
intersecting at the centre of the patient’s fixation. Secondly, a single scan mode was
selected whose orientation and location within the fundus was determined by the
operator. Thirdly, the system was used to generate a raster scan of the macula from
the superior to the inferior arcade with 64 scans, again centred by the patient’s
fixation.
Three dimensional views of the macula were obtained by selecting the topography
mode where images were viewed as surface maps and these were extracted manually
by slicing the 3-D picture using the device based image analysis software. The
7 thickness in different areas of the posterior pole by using the ETDRS macular grid.
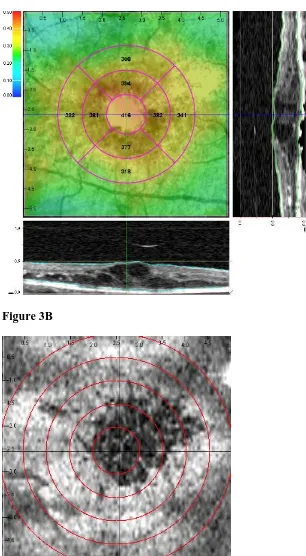
Coronal scans (C-scans) were fundamental to the present study and obtained by
selecting the mid point between the ganglion cell layer and the innermost aspect of the
outer plexiform layer, in most cases to mid depth of the cysts. In practice this was
obtained by adjusting the section plane to an appropriate level parallel with the retinal
surface in the B scan displayed on the x-axis of the coronal image (Figure 3A).
Image analysis
To investigate the purpose of this study, three pieces of information were required
from each patient: 1) the number of columns of tissue present 2) their cross-sectional
area at their narrowest point 3) their eccentricity from the foveal centre.
An image analysis system was created to extract each of these datasets. Data were
collected from a series of concentric rings of 500 µm, 1000 µm, 1500 µm, 2000 µm,
2500 µm radii respectively (Figure 3B). Thus, within each ring, the area of surviving
tissue as opposed to cystic space was extracted by first compressing the greyscale
such that tissue became white and oedema black18. The second part of the program
counted the number of white pixels present within each ring thus giving a measure
proportionate to the potential number of connections passing between the two
plexiform layers. The number of pixels of spared tissue within each annulus was
converted to an area in mm2 by scaling the ratio of the number of pixels of spared
tissue to the total number of pixels in the annulus by the area in mm2 of the annulus.
Outcome measures
This study had three primary outcomes: 1) Best corrected Log MAR visual acuity; 2)
retinal tissue integrity evaluated as number of pixels corresponding to the tissue
8 fovea in segmented images of OCT/SLO coronal scans; and 3) central macular
thickness measurement obtained from the OCT/SLO retinal thickness map.
Statistics
All data organization and manipulation was carried out in Microsoft® Office Excel
2003 (Microsoft, Redmond, WA) and statistical analysis was performed using SPSS
16.0 for Windows (SPSS Inc, Chicago, IL) and MINITAB Release 13.30 (MINITAB
Inc, State College, PA). Following tests for normality, (Kolmogorov-Smirnov test; P
< 0.05 considered statistically significantly different from normal), correlation
coefficients were calculated to evaluate the association between visual acuity and the
other 6 outcome measures.
A linear regression model was developed to assess if the amount of glia could be used
to predict visual acuity. The data set of 129 eyes were randomised and split into two
data sets, one of 100 eyes and the other of 29 eyes. A stepwise linear regression was
performed on the data set of 100 eyes with logMAR visual acuity as the dependent
variable and the other 6 outcome measures as predictors. The criterion for entry into
the model was P = 0.05 and P = 0.10 for removal. Stepwise linear regression is an
extension of simple linear regression where the dependent variable is predicted by a
linear equation involving one outcome or independent variable and a constant. In
stepwise linear regression, multiple variables can be linearly combined in the model.
They are entered automatically by the statistics software provided they make a
statistically significant improvement in the model. Stepwise linear regression has been
used in a large number of areas19.
The remaining 29 eyes were used to test the model by assessing the agreement
9 Results
A total of 81 participants enrolled, 36 males and 45 females. The average age was 63
years (range 26-87 years) (Table 1).
Most patients (73%, 59 subjects) underwent fluorescein angiography, whereas in the
remaining group an angiographic study could not be performed (27%, 22 subjects)
due to previously documented adverse reaction to the dye (9 subjects), refusal to the
investigation (8 subjects) or technical difficulty to obtain a satisfactory venous access
(7 subjects). Typical patient contact time was 40 minutes of which only 5 minutes
were required for OCT imaging.
Relationship between tissue integrity and visual function
The scatter plots in figure 4 (b & c) show a linear relationship between the amount of
spared tissue within rings 1 and 2 and Log MAR visual acuity. The correlation falls
progressively for rings 3, 4 and 5 (Figure 4 d,e & f). Not all variables were normally
distributed (P = 0.000 to 0.200) therefore Spearman rank correlation coefficients were
calculated21 Their values, together with the associated statistical significance and the
R2 values are given in table 2. R2 values are reported since they give the percentage of
the variation in visual acuity explained by the outcome measures (central macular
10 Relationship between macular thickness and visual function
The relationship between central macular thickness (CMT) and visual acuity is shown
in the scatter plot in Figure 4(a). The correlation between CMT and LogMAR visual
acuity was moderate (rs = 0.407). The coefficient of determination (R2 value)
demonstrates that CMT only explains 16.6% of the change in visual acuity using a
linear model (Table 2).
Linear Regression Model
The linear regression model following stepwise linear regression was given by
2 289 0 1 548 0 271
0 091
1 CMT T T
MAR . . . .
log (1)
where CMT was the central macular thickness in mm and T1 and T2 were the areas of
tissue sparing in mm2 in rings 1 and 2 respectively. This model had an R2 value of
80.7% indicating that equation (1) accounted for over 80% of the variation in
LogMAR visual acuity. It was noteworthy that the most predictive variable was T2
and this alone could predict 74.4% of the variation in LogMAR visual acuity using a
linear model. The significance of this result will be commented on further in the
discussion.
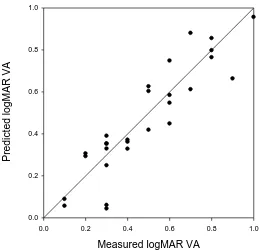
Figure 6 shows the results of testing the model and is a scatter plot of the measured
Log MAR visual acuity plotted against the estimated LogMAR visual acuity using
equation (1). A line of equality is shown along which all data points would be
expected to lie in presence of perfect agreement. Clearly this was not the case, as
expected from most clinical measures.
Figure 7 shows the Bland-Altman mean-difference plot for our data. It demonstrates a
11 Discussion
This study has demonstrated that there is a strong correlation between visual acuity in
patients with cystoid macular oedema and the volume of tissue passing between the
two plexiform layers in the central retina as determined by OCT. It is the first time
that a predictive measure of visual performance has been derived from imaging of
macular oedema.
The results demonstrate that good visual acuity only occurred in those patients with
an adequate volume of tissue running between the inner and the outer plexiform
layers in the central 1000-2000µ of retina (Figure 4 and 5). Given that foveal cones
have inner connecting fibres that may be up to 500µm in length17 foveolal cones may
connect to bipolar cells displaced 500µm radially from the inner and outer segments.
Thus this lateral displacement of connections between foveal cones and ganglion cells
explains the dependency of visual acuity on the tissue integrity in both rings 1 and 2.
While there was still reasonable correlation within ring 3, presumably due to signals
derived from photoreceptors at the extreme edges of the fovea, correlation was lost
within rings 4 and 5. In these locations, although large amounts of tissue volume may
be spared, the connectivity is predominantly with extrafoveal photoreceptors.
These findings are in keeping with both an anatomical study looking at displacement
of retinal ganglion cells subserving cones in the human fovea17 and a pathological
study measuring laser damage to foveal photoreceptor cells21. Sjostrand et al
measured the radial offset produced by cone fibres within the layer of Henle and
demonstrated that at the foveal border (0.5-0.8 mm or 1.8-2.9 deg eccentricity) the
mean offset due to fibres of Henle and mean total lateral displacement was at a
maximum of 0.32±0.03 mm and 0.37±0.03 mm respectively, thereafter steeply
12 anatomical finding confirms that structural damage involving the neural retina up to
1mm from the foveal centre might have implications for loss of information generated
within the fovea.
In order to estimate the number of axonal elements necessary to maintain potential for
visual function, more information is needed with regard to the spatial arrangement of
bipolar and Muller fibres in the residual columns and their relative ratio. From
electron microscopy studies it is known that bipolar axons are surrounded by Muller
fibres in the human retina22. Given that the approximate diameter of bipolar axons is
0.5µ and the diameter of Muller fibres is between 5µ and 10µ, we can estimate that in
normal conditions for each Muller fibre there are approximately 34 to 68 adjacent
bipolar neurones around their circumference.
By contrast, in pathological conditions such as macular oedema, accumulation of
intracellular fluid may reduce the total number of Muller fibres but may also result in
an increase in the diameter of those remaining up to 15-20µ. This would allow an
increase in the potential number of surrounding bipolar axons to approximately 97 to
128 (Figure 2).
Furthermore, from the linear regression model, it appears that a minimum of 50% of
preserved retinal tissue within ring 1 is necessary in order to maintain a visual acuity
of 0.4 LogMAR or better (Figure 4, scatter plot b), whereas at least 70% of the retinal
tissue within ring 2 is necessary for a level of visual acuity of 0.4 LogMAR or better
(Figure 4, scatter plot c).
Even though the total number of bipolar axons traversing the space between the
plexiform layers may be significantly reduced, both horizontal and amacrine cells will
contribute to image processing and VA by integrating signals over a number of
13 The major source of error in the present study is the potential loss of information
implicit in compression of greyscale during the image analysis. At extremes, potential
connectivity may be lost if too few pixels are present in a given element within the
primary image to be resolved as tissue. By contrast, some discontinuous elements
which do not really traverse the interplexiform space may be interpreted as intact
elements. Further work is therefore required to optimize the image analysis process
and to give further maximal and minimal correlates for axonal elements potentially
associated with the glial tissue.
In the present paper, no attempt has been made to determine degradation of visual
information resulting from fluid accumulation either beneath the retinal pigment
epithelium or beneath the interphotoreceptor matrix. Clearly, the potential visual
acuity of any given patient relates to both the quality of the image presented to the
photoreceptor cells and the ability to transmit such resolved information from the
photoreceptors to the ganglion cells.
The former may well be degraded by the presence of fluid in the outer retina, whilst
the latter will be less dependent upon fluid distribution in the inner retina and more
dependent on the number of viable bipolar axons.
Recovery or improvement of visual acuity may be dependent on changes induced in
both these components. First, some improvement may occur resulting from removal
of fluid from the outer retinal layers as a consequence of changing fluid and ionic
environment in the inter-photoreceptor matrix thus potentially enhancing
transduction. Secondly, whilst no current therapeutic regime will replace lost
neurones, drainage of the cystoid fluid will remove tension on the axons passing
through the cysts and at the same time change the ionic environment around the axons
14 transretinal transport of ions23, changes to their environment maybe of particular
importance.
Several studies have investigated the value of various objective parameters derived
from images of macular oedema as indicators of visual function24-29. Using
fluorescein angiograms, Arend at al investigated the relationship between the mean
area of the cysts and number of cystic spaces in cystoid macular oedema with
measures of visual acuity, demonstrating a significant correlation (R2 0.61 and 0.48
respectively) 29. Other authors investigated patterns of fluid distribution in macular
oedema as a predictor of visual funtion with little success 30.
At present, the measurement of retinal thickness with OCT represents the accepted
standard despite its incredibily poor correlation with visual function (R2 values
ranging from 0.08 to 0.54) compared with the results presented in the current paper31.
The relationship between macular thickness and visual acuity has also shown poor
consistency across different studies31-37.
The apparent correlation between the increase in retinal thickness and the decrease in
visual acuity may be explained by the results of the present paper whereby increase in
thickness will be associated with increase in loss in viable axons. The more direct
approach to assessing neuronal survival in the present study would also explain why
the correlation values are so much better.
The present study validates retinal tissue integrity as a measure of preserved axonal
connections and indicator of visual function. The strength of the relationship between
preserved tissue and visual function, as expected, decreases at increasing
eccentricities from the centre of the fovea.
It will be of interest to apply the current analysis to future trials of regimens designed
15 prior to the commencement of any treatment trial will be highly beneficial in that it
will allow exclusion of those individuals who could not in anyway benefit from
intervention. A longitudinal treatment trial is necessary in order to validate the
assessment of retinal structural integrity at baseline and to relate this parameter to the
16 References
1. Gass JD, Anderson DR, Davis EB. A clinical, fluorescein angiographic, and
electron microscopic correlation of cystoid macular edema. Am J Ophthalmol.
1985;100:82–86.
2. Gass JDM, Norton EDW. Cystoid macular edema and papilledema following
cataract extraction: a fluorescein fundoscopic and angiographic study. Arch
Ophthalmol. 1966;221–224.
3. Yanoff M, Fine BS, Brucker AJ, Eagle RCJr. Pathology of human cystoid
macular oedema. Surv Ophthalmol. 1984;28:505-511.
4. Fine BS, Brucker AJ. Macular edema and cystoid macular edema. Am J
Ophthalmol. 1981;92:466-481.
5. Antcliff R, Marshall J. The pathogenesis of edema in diabetic maculopathy.
Seminars in Ophthalmology. 1999;14:223-232.
6. Marshall J. The effects of ultraviolet radiation and blue light on the eye.
Macmillan Press, Ltd. The Susceptible Visual Apparatus. London, 1991,
54-92
7. Antcliff RJ, Hussain AA, Marshall J: Hydraulic conductivity of fixed retinal
tissue after sequential excimer laser ablation: barriers limiting fluid
distribution and implications for cystoid macular edema. Arch Ophthalmol.
2001;119:539–544.
8. Hee MR, Puliafito CA, Duker JS et al. Topography of diabetic macular edema
with optical coherence tomography. Ophthalmology. 1998;105:360–370.
9. Hee MR, Puliafito CA, Wong C et al. Quantitative assessment of macular
oedema with optical coherence tomography. Arch Ophthalmol.
17 10.Yamada E. Some structural features of the fovea centralis in the human retina.
Arch Ophthalmol. 1969;82:151-159.
11.Gass JDM. Muller cell cone, an overlooked part of the anatomy of the fovea
centralis. Arch Ophthalmol. 1999;117:821-823.
12.Otani T, Kishi S, Maruyama Y. Patterns of diabetic macular edema with optical
coherence tomography. Am J Ophthalmol. 1999;127(6):688-931.
13.Kim BY, Smith SD, Kaiser PK. Optical coherence tomographic patterns of
diabetic macular oedema. Am J Ophthalmology. 2006;142(3):405-412.
14.Gibram SK, Khan K, Jungkim S, Cleary PE. Optical coherence tomographic
pattern may predict visual outcome after intravitreal triamcinolone for diabetic
macular edema. Ophthalmol. 2007;114:890-894.
15.Goebel W, Kretzchmar-Gross T. Retinal thickness in diabetic retinopathy: a study
using optical coherence tomography (OCT). Retina. 2002;22:759–67.
16.Hee MR, Puliafito CA, Wong C, et al. Quantitative assessment of macular edema
with optical coherence tomography. Arch Ophthalmol. 1995;113:1019–29.
17.Sjostrand J, Popovic Z, Conradi N, Marshall J. Morphometric study of the
displacement of retinal ganglion cells subserving cones within the human fovea.
Graefe’s Arch Clin Exp Ophthalmol. 1999;237:1014-1023.
18.Barman SA, Hollick EJ, Boyce JF, Spaton DJ, Uyyanonvara B, Sanguinetti G,
Meacock W. Quantification of posterior capsular opacification in digital images
after cataract surgery. Invest Ophthalmol Vis Sci. 2000;41(12):3882-3892.
19.Altman DG, “Practical Statistics for Medical Research,” Chapman & Hall,
London, 1991.
20.Bland JM, Altman DG. Measuring agreement in method comparison studies. Stat
18 21.Marshall J, Hamilton AM, Bird AC. Histopathology of ruby and argon laser
lesions in monkey and human retina. A comparative study. Br J Ophthalmol.
1975;59:610-630.
22.Hogan MJ, Alvarado JA, Weddell JE. Histology of the human eye: an atlas and
textbook. WB Saunders, Philadelphia, 1971.
23.Biedermann B, Skatchkov SN, Brunk I, Bringmann A, Pannicke T, Bernstein HG,
Faude F, Germer A, Veh R, Reichenbach A. Spermine/spermidine is expressed by
retinal glial (Mueller’s) cells and controls distinct K+ channels of their membrane.
Glia.1998;23(3):209-220.
24.Smith RT, Lee CM, Charles HC, Farber M, Cunha-Vaz JG. Quantification of
diabetic macular edema. Arch Ophthalmol. 1987;105:218-22.
25.Puliafito CA, Hee MR, Lin CP, Reichel E, Schuman JS, Duker JS, Izatt JA,
Swanson EA, Fujimoto JG. Imaging of macular diseases with optical coherence
tomography. Ophthalmology. 1995;102:217-29.
26.Ko TH, Fujimoto JG, Schuman JS et al. Comparison of ultrahigh- and
standard-resolution optical coherence tomography for imaging macular pathology.
Ophthalmology. 2005;112:191–197.
27.Catier A, Tadayoni R, Paques M et al. Characterization of macular edema
from various etiologies by optical coherence tomography. Am J Ophthalmol.
2005;140:200–206.
28.Massin P, Duguid G, Erginay A et al. Optical coherence tomography for
evaluating diabetic macular edema before and after vitrectomy. Am J
Ophthalmol. 2003;135:169 –177.
29.Arend O, Remky A, Elsner AE, Betram B, Reim M, Wolf S. Quantification of
19 30.Otani T, Kishi S. Correlation between optical coherence tomography and
fluorescein angiography findings in diabetic macular oedema. Ophthalmology.
2007;114(1):104-107.
31.Diabetic Retinopathy Clinical Research Network. Relationship between optical
coherence tomography-measured central retinal thickness and visual acuity in
diabetic macular oedema. Ophthalmology. 2007;114:525-536.
32.Nussenblatt RB, Kaufman SC, Palestine AG et al: Macular thickening and visual
acuity. Measurement in patients with cystoid macular edema. Ophthalmology.
1987;94:1134–1139.
33.Larsson J, Zhu M, Sutter F, Gillies MC. Relation between reduction of foveal
thickness and visual acuity in diabetic macular edema treated with intravitreal
triamcinolone. Am J Ophthalmol. 2005;139(5):802-806.
34.Massin P, Erginay A, Haouchine B et al. Retinal thickness in healthy and diabetic
subjects measured using optical coherence tomography mapping software. Eur J
Ophthalmol. 2002;12:102–108.
35.Yang CS, Cheng CY, Lee FL et al. Quantitative assessment of retinal thickness in
diabetic patients with and without clinically significant macular edema using
optical coherence tomography. Acta Ophthalmol Scand. 2001;79:266–270.
36.Schaudig UH, Glaefke C, Scholz F et al. Optical coherence tomography for
retinal thickness measurement in diabetic patients without clinically significant
macular edema. Ophthalmic Surg Lasers. 2000;31:182–186.
37.Browning DJ, Glassman AR, Aiello LP et al. Optical coherence tomography
measurements and analysis methods in optical coherence tomography studies of
20 Legends
Figure 1: Light microscopy and optical coherence tomography (OCT/SLO, OTI,
Toronto) images of human retina affected by cystoid macular oedema (CMO).
Examples of early (top photo) and late CME (bottom photo) are represented.
Intraretinal fluid appears contained in cystic spaces separated by walls.
Figure 2: Scanning electron microscopy of cystoid macular oedema. Columns of
tissue are standing up in a continuous space of fluid pooling. Retinal elements along
the z-plane are represented by bipolar axons and Muller fibres (Prof J Marshall’s
collection).
Figure 3: (3A) Macular thickness map of a patient with macular oedema representing
subfield mean thicknesses as from ETDRS study; (3B) Grayscale coronal OCT scan
with superimposed grid dividing the macula in 5 areas of increasing eccentricity
(radii:500µ, 1000µ, 1500µ, 2000µ, 2500µ).
Figure 4: Scatter plots showing the relationship between a) Central macular thickness
versus LogMAR VA (rs = 0.407*); b) Tissue integrity within circle 1 versus LogMAR
VA (rs = -0.832*); c) Tissue integrity within circle 2 versus LogMAR VA (rs =
-0.841*); d) Tissue integrity within circle 3 versus LogMAR VA (rs = -0.624*); e)
Tissue integrity within circle 4 versus LogMAR VA (rs = -0.277*); f) Tissue integrity
within circle 5 versus LogMAR VA (rs = -0.134). *correlation is significant at the
0.05 level (2-tailed)
Figure 5: Variation in R2 values, representing the association between visual acuity
and retinal spared tissue at increasing eccentricity as well as visual acuity and central
macular thickness (CMT)
Figure 6 Scatter plot, with line of equality, for measured versus predicted LogMAR
21 Figure 7 Bland-Altman mean-difference plot demonstrating agreement between
measured and predicted LogMAR visual acuity
Table 1: Baseline clinical characteristics of study subjects
Table 2: Regression values and Spearman correlation coefficients describing the
relationship between the outcome measures and LogMAR visual acuity for all 129
22 Figure 1
[image:23.595.92.505.405.733.2]23 Figure 3A
24 Figure 4
(a)
Central Macular Thickness (mm) 0.1 0.2 0.3 0.4 0.5 0.6 0.7
logMA R V A 0.0 0.2 0.4 0.6 0.8 1.0 1.2 (b)
Tissue Spared in ring 1 (mm2) 0.0 0.2 0.4 0.6 0.8 1.0
logMA R V A 0.0 0.2 0.4 0.6 0.8 1.0 1.2 (c)
Tissue spared in ring 2 (mm2) 0.0 0.5 1.0 1.5 2.0 2.5
logMA R V A 0.0 0.2 0.4 0.6 0.8 1.0 1.2 (d)
Tissue spared in ring 3 (mm2) 1.0 1.5 2.0 2.5 3.0 3.5 4.0 4.5
logMA R V A 0.0 0.2 0.4 0.6 0.8 1.0 1.2 (e)
Tissue Spared in ring 4 (mm2) 2.5 3.0 3.5 4.0 4.5 5.0 5.5 6.0
logMA R V A 0.0 0.2 0.4 0.6 0.8 1.0 1.2 (f)
Tissue spared in ring 5 (mm2) 2.0 3.0 4.0 5.0 6.0 7.0 8.0
25 Figure 5
0.02 0.09
0.75 0.74
0 0.1 0.2 0.3 0.4 0.5 0.6 0.7 0.8
0 500 1000 1500 2000 2500 3000 3500
R square Eccentricity from the fovea (microns)
0.43
26 Figure 6
Measured logMAR VA
0.0 0.2 0.4 0.6 0.8 1.0
Predicted logMAR V
A 0.0 0.2 0.4 0.6 0.8 1.0 Figure 7
Mean logMAR VA ((predicted + measured)/2)
0.0 0.2 0.4 0.6 0.8 1.0 1.2
Dif ference i n l ogMA R V A (predicted - m eas ured ) -0.3 -0.2 -0.1 0.0 0.1 0.2 0.3
Upper limit of agreement
[image:27.595.91.350.106.356.2]27 Table 1
Patients 81 Diagnosis Unilateral 33 Bilateral 48
60 DMO 14 cases 46 cases
12 Uveitis 10 cases 2 cases
6 RVO 6 cases 0 cases
2 Irvine Gass 2 cases 0 cases
1 Tractional 1 case 0 cases
Table 2
Variable rs P (2-tailed) R2 (%)
CMT +0.407 <0.001 16.6%
Tissue spared in ring 1 (500µ) -0.832 <0.001 69.2%
Tissue spared in ring 2 (1000µ) Tissue spared in ring 3 (1500µ)
-0.841 -0.624
<0.001 <0.001
70.7% 38.9%
Tissue spared in ring 4 (2000µ) -0.277 0.001 7.7%