Abstract— In this paper, we provide detailed descriptions of a proposed new algorithm for video summarization, which are also included in our submission to TRECVID’08 on BBC rush summarization. Firstly, rush videos are hierarchically
modeled using the formal language technique. Secondly, shot detection are applied to introduce a new concept of V-unit for
structuring videos in line with the hierarchical model, and thus junk frames within the model are effectively removed.
Thirdly, adaptive clustering is employed to group shots into clusters to determine retakes for redundancy removal. Finally,
each most representative shot selected from every cluster is ranked according to its length and sum of activity level for
summarization. Competitive results have been achieved to prove the effectiveness and efficiency of our proposed
techniques, which are also fully implemented in the compressed domain. Our work does not require high-level semantics
such as human object detection and audio signal analysis for summarization which provides a more flexible and general
solution for this topic.
Index Terms— video rushes summarization, hierarchical modelling, adaptive clustering, TRECVID.
Hierarchical Modeling and Adaptive Clustering
for Real-time Summarization of Rush Videos
Jinchang Ren and Jianmin Jiang
Digital Media & Systems Research Institute, University of Bradford, BD7 1DP, U.K.
I. INTRODUCTION
Video summarization, in which original videos are represented by either still-image based storyboard or short-clip based dynamic skimming, plays essential roles in efficient content-access, browsing and retrieval of large video databases [1-5]. In principle, the essential strategy is to choose the most meaningful parts of video to form the summary while ignoring the less important ones, which are often referred to as content of interests (COI). Consequently, how to define suitable COIs is inevitably dependent on both the application domain and the users upon whom the video is summarized. Due to the nature of its attractiveness and wide commercialization, sports video summarization has been intensively investigated among the existing efforts, covering soccer, baseball etc. [10, 13-14, 25, 34]. Other typical applications can be also found in news [32, 48], surveillance [6], movies [5, 21, 40, 42], home videos [28], and even stereoscopic sequences [45] as well as videotaped presentations [44]. Some general methodologies that can be applied to multiple application domains are also reported [8, 32]. To address the users’ preferences, existing work also covered personalized and user-adaptive summarization techniques [10-11, 28]. Recent literature surveys on relevant techniques have been extensively reported in a number of sources [2, 17, 20, 36].
A. Related Work in Video Summarization
In general, existing attempts on video summarization can be characterized by four main steps, including i) video segmentation, ii) key frame extraction, iii) similarity-based clustering and iv) summary generation. Segmentation is used to partition original videos into small clips (shots and sub-shots) and then ranking these clips for summarization [6, 12-13]. To measure the similarity of clips, a group of most representative frames are extracted as key frames whilst many techniques have been proposed for key frame extraction [5-8, 11, 38, 44-45]. Meanwhile, the similarity between frames is measured by using simple histogram distance [1, 30, 32, 39-40, 42] and mutual information etc. [8]. In addition, selection of COIs including objects and events can be solved by introducing user-attention model and domain knowledge [3, 6, 41, 47]. In some work, graph theory [1, 46, 50] and dynamic programming [4, 9, 48] are applied for either video segmentation or optimal (suboptimal) clustering for summarization. In generating the summarized video, representative techniques include combination of key frames, video segments, or even a complex layout of these frames whose sizes are determined by their contained information [48].
Typically, video summarization is extracted by only using the information extracted from the video, called “internal summarization”[17]. In contrast, “external summarization” techniques employ additional information for interactive processing. The additional information includes manual annotation of the video such as those in MPEG-7 descriptors [31-32, 41] and knowledge about the users to achieve personalized summarization [10-11, 28]. For internal summarization, audio information is often utilized together with image features [14-15, 20, 26, 32, 34-35, 40-42], among which camera motion [8, 12, 16] and object motion [1, 7, 13, 44, 47] are frequently employed to model the significance of frames for summarization. Some work using text information overlaid to help with the video summarization is also reported [10].
In addition to these low level features, high level semantics are also extracted for more effective summarization. These semantics provide more accurate description of objects and events at higher level, in which representative techniques include object detection, tracking and event classification [6, 8, 13, 17, 45]. Since the defined objects and events are solely application dependent, such as human objects under surveillance environment and normal or abnormal events at an airport etc., it is normally difficult to extend these techniques to the task of general video summarization.
B. Summarization of Rush Videos in TRECVID
between or within these retakes there are junk frames which refer to unwanted and meaningless short clips, such as color bars, monochrome frames in white or black, etc. As a result, to complete video summarization for TRECKVID’08 rushes, retakes of the same shot need to be clustered and junk clips need to be eliminated.
As for video segmentation, shot boundary detection is usually employed [1, 8]. Since unedited rush videos are dominated by cuts, shot boundary detection becomes relatively easier. Normally, histogram and frame differences are measured and decision is then made via simple thresholding or complex classifying techniques for shot boundary detection. In thresholding, techniques reported include single threshold, multiple thresholds, or even adaptive thresholding, and classifiers can be SVM (support vector machine), or SOM (self-organizing maps neural network), etc. In addition, features can be extracted from pixel domain for accuracy or from compressed domain for efficiency.
To remove retakes, clustering of shots is applied by using KNN (k-nearest neighbors), PCA (principal component analysis), SIFT (scale invariant feature transform), agglomerative clustering, etc [18]. In most of these techniques, the similarity of two shots is measured by a combined similarity of each pair of their associated key frames. These key frames are representative images for each shot and they can be extracted either by sampling in a shot evenly, or targeted selection via certain criteria. The principle of those criteria are to choose frames of high differences from the two boundary frames in the shot or frames being midpoints between each pair of high curvature points from cumulative frame differences, etc. Since key frames are only separate points in a temporal clip of shots, this kind of clustering need to be further enhanced in order to achieve stronger robustness.
To rank segmented clips for summarization, detection of some high-level features is employed which include event detection, video object extraction, object tracking, face detection, and audio analysis [6, 14, 17-18]. Generally, clips of more human objects are considered to have more importance and hence assigned with higher ranks. Certain feature analysis can be used to remove junk frames, as these unwanted small clips are found of some fixed pattern in audio-visual appearances. It is worth noting that audio information can be useful in many aspects in this application, such as shot detection, filtering junk frames as well as clustering of retakes.
C. Contributions and Structure of the Paper
In this paper, we propose a new algorithm for video summarization, which is included in our submission for TRECVID’08 on BBC rush summarization. Firstly, input videos are modeled hierarchically where videos are structured with shot, sub-shots and other level of contents. Secondly, active or inactive segments in each sub-shot are attained on the basis of our defined activity level extracted from inter-frame difference. In addition, junk frames within each shot and between shots are also modeled and removed, and key frames are extracted. Based on these determined key frames, adaptive clustering is then applied to group retakes for redundancy removal. Finally, the most representative shot in each cluster is selected, and both its length and activity level are considered in determining the quota of distributed size for vide summarization.
The remaining part of this paper is organized as follows. In Section II, rush videos are modeled into a list of shot clusters including three categories of junk frames. Techniques on video structuring are presented in which shot and sub-shot are detected. Analysis and filtering of these junk frames are discussed in Section III. In Section IV, extraction of key frames from each shot and adaptive clustering of shots into clusters to filter retakes are described. How to generate summarized results is discussed in Section V. Experimental results and discussions are given in Section VI, and finally brief conclusions are drawn in Section VII.
II. MODELING AND VIDEO STRUCTURING
In this section we will discuss how to model video rushes summarization in a top-to-bottom structure, and also how to segment videos into shots. Some essential concepts used are defined and explained including determination of V-units within shots and introducing valid and active frames in the shots.
A. Modeling
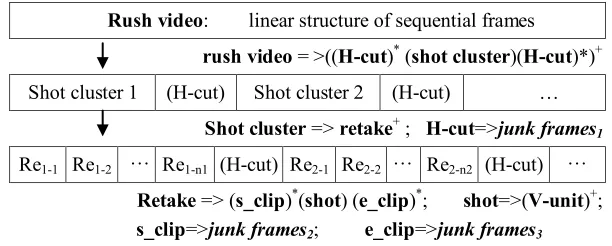
To achieve high performances of video summarization without compromising on its content descriptions, we propose to model videos in a hierarchical way containing several levels. Firstly, input videos are taken as a linear structure of sequential frames, which contains a list of shot clusters. Between each pair of clusters, there might be some junk frames like color bars, etc., namely H-cut, to indicate such changes. For each shot cluster, it has one or more retakes and each retake may contain three parts, i.e. start of retake (s_clip), video shot (shot) and end of retake (e_clip). In addition, each shot is divided into several V-units of continuous high activity levels, hence producing more important parts of the video for its summarizations. Inside the retakes, both s_clip and e_clip are junk frames and may refer to clapboard period and shaking camera period (after capturing), respectively.
Figure 1 illustrates our proposed hierarchical modeling and formal descriptions of rush videos, where the hierarchical structure is represented by formal language description. Details on how to decide various levels for video structuring is presented below, and how to filter and remove those junk frames is discussed in the next section.
Rush video: linear structure of sequential frames rush video = >((H-cut)* (shot cluster)(H-cut)*)+ Shot cluster 1 (H-cut) Shot cluster 2 (H-cut) …
Shot cluster => retake+ ; H-cut=>junk frames
1
Re1-1 Re1-2 … Re1-n1 (H-cut) Re2-1 Re2-2 … Re2-n2 (H-cut) … Retake => (s_clip)*(shot) (e_clip)*; shot=>(V-unit)+;
[image:4.612.134.440.327.450.2]s_clip=>junk frames2; e_clip=>junk frames3
Figure 1. Formal description of our hierarchical model.
B. Shot Detection and Activity Level Determination
To achieve high efficiency and minimize the computing cost for the proposed algorithm, we extract the content features in compressed-domain. For each input frame fi, its DC-images with Y, Cb and Cr components are extracted as (), (i)
dc i
dc U
Y and (i)
dc
V , respectively. For the ith frame, its DC-differencing image is then defined as follows:
3
|
|
|
|
|
|
)
(
) 1 ( ) ( )
1 ( ) ( )
1 ( )
(
dcii dc i
dc i dc i
dc i
dc
Y
U
U
V
V
Y
i
D
(1)For each D(i), we extract mean and standard derivation represented as (i) and (i). Let p1(i) and p2(i) be two
proportions which represent the percentage of pixels in D(i) that are larger than the two given thresholds 1(i) and 2(i). To
For most of the cuts, they are found appearing as a peak in the sequence of (i) and (i). The peak here reflects the fact that frame difference is larger during a cut but turns smaller before or after the cut. Normally, larger (i),
(i) and p2(i) are more likely to indicate a potential cut. Rather than simply thresholding, we introduce three separate likelihoods, i(), i() and) (p2
i
, and a combined cut likelihood i for cut detection. The main reasons why the likelihoods in Eq. (2) are defined can be
summarized as follows. Firstly, for cuts we have their
(i) and
(i) values much larger than those of
(i1) and
(i1), respectively. Therefore, 1
(i1)/
(i) and 1
(i1)/
(i) are good measures as likelihoods to indicator how likely a cut occurs. Secondly, a cut will lead to a large value of p2(i), where p2(i)[0,1], which corresponds to a relative large portion ofchanged blocks in the DC-image. For many cuts, their p2(i) values are found quite small, i.e. less than 0.5. To assign appropriate likelihoods to such cuts, we set the corresponding likelihoods as
sqrt
(
p
2(
i
))
so that low values of p2(i) may still yield high likelihoods.))
(
(
)
(
)]
(
2
/[
)
1
(
1
)
(
)]
(
3
/[
)
1
(
1
)
(
22
sqrt
p
i
p
i
i
i
i
i i i
(2)3
/
)]
(
)
(
)
(
[
i i ip
2i
(3) It is worth noting that in our system i is considered as an overall measurement of activity level within the frame. The reason here is that it reflects certain degree of content changes caused by either global motion such as camera movements or large local motion of moving objects. Such content changes will provide useful clues in extracting meaningful frames for summarization in which shots of high or low activity levels correspond to more or less interesting/exciting parts in a video.
When i is larger than a threshold tl, say 0.65, a cut candidate is claimed and further validated by using phase-correlation
based similarity. In fact, this is a simplified version of our techniques in shot cut detection entered for TRECVID’07 competition on shot boundary detections. Further details can be found in [19].
C. V-units Determination
Following shot cut detections, the input video is segmented into a series of shots. Inside each shot, all the frames can be classified into two classes, referred to as valid frames (i.e. normal) and junk frames, where the latter covers those from H-cut, s_clip and e_clip as described above. For all the valid frames, we further classify them into active and inactive ones by checking if their associated activity levels are larger than a given threshold ta or not. In this process, higher level of activity means apparent content changes in consecutive frames, which may refer to camera motion or large object motion. As a result, more priority should be given in formulating summarization videos.
second of real-time play. If the gap between active frames is larger than tg, the corresponding active frames will be regarded as the start of a new V-unit. Consequently, there can be more than one V-units in a shot. On the other hand, there can be no V-unit at all in a shot due to low level of activities or short length of active frames.
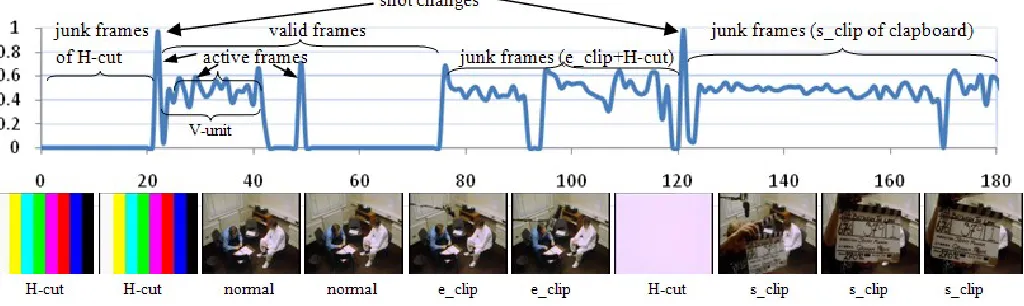
[image:6.612.51.563.380.533.2]Figure 2 illustrates one example of such V-unit embedded inside a shot with feature curves and relevant information attached, which is extracted from the sequence of “MS2201020.mpg” inside the test data set given by TRECVID’08. As seen, from frame #0 to frame #180, continuous activity level curve is plotted under which typical frames are shown with their status as valid (normal) or junk. For junk frames, three further categories are also given. There are two shot changes in the plot between frame #21 and #22, and between #120 and #121, with which higher level of activities is associated. In addition, frames between #0 and #21 are all junk frames in H-cut category of color bar, and frames between #121 and #180 are all junk frames with clapboards in category of s_clip. In the shot between frame #21 and frame #120, it contains valid frames from frame #21 to frame #73 and junk frames from frame #74 to frame #120. It is interesting to note that the junk frames of e_clip category involve motion in large microphones and sometimes it is difficult to filter these frames due to visual consistency. In other words, it is hard to say whether the moving objects are within the real scene or not without the domain knowledge. In this case, additional information such as speech signal might be useful as we can recognize corresponding command words from the director such as “cut”, etc. Further, active frames from all valid frames are labeled to contain one continuous segment (from frame #24 to frame #42) and two separate frames (frame #22 and frame #49). Since we have tg=6, the continuous segment is merged with the separate frame #22 and forms a whole V-unit. Other separate active frames are ignored.
Figure 2. Explaining the concepts of “vUnit”, “valid frames” and “active frames” using plotted curve of activity level (y-axis) vs. frames (x-axis), where representative frames are also shown which are categorized into normal frame and three kinds of junk frames (H-cut, s_clip and e_clip).
III. FILTERING JUNK CLIPS
To ensure that the V-unit extraction is effective and the interference from junk frames is minimized in generating video summarization, we propose a filtering technique to remove several typical junk frames, including those inside H-cuts, s_clips and e_clips.
A. Filtering H-cut Frames
be detected and removed by examining the histogram of the component (i)
dc
Y by exploiting such property. In other words, we can identify the highest peak in the histogram and then count the number of bins whose heights are no less than one-fifth of this peak to determine whether the frame is a junk or not. Let (i)
c
n be the count for the number of bins greater than or equal to a threshold, say c within 256 bins in total, junk frames are detected by the condition test: i c
c
n() .
To determine the threshold c, we propose to use Bayesian minimum error classification criterion. Given a group of typical sample frames including both normal contents and H-cut images, nc is obtained for each frame, and conditional probabilities of
) | (normal nc
p and p(Hcut|nc) are also calculated. The threshold c is determined to satisfy:
]
)
|
(
)
|
(
[
min
arg
2550
cp
normal
n
cdn
cp
H
cut
n
cdn
c(4)
[image:7.612.154.457.206.401.2]
Figure 3. Examples of two junk frames from H-cut category (top) and their associated luminance histograms (bottom).
B. Filtering Clapboards from s_clip Frames
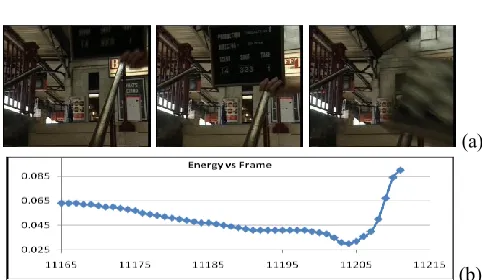
As for s_clip, it is mainly caused by clapboard as shown in Figure 4(a). When the clapboard moves in or out of the scene, an apparent change is caused, which can be exploited for its detection. However, to differentiate between this change from the content change used for cut detection, further analysis is required and some unique feature needs to be identified. To this end, we have examined a range of features including the associated luminance energy, which is defined as follows:
j i dc y
y
i
E
Y
j
E
1 () 2_
0
[
(
)]
)
(
(5)
where E0_y is used to normalize Ey(i) within [0,1].
(a)
(b)
[image:7.612.200.441.567.707.2]Figure 4 illustrates an example of such s_clip containing three clapboard frames and their corresponding energy values. As seen, the energy change across clapboard frames presents the feature that a slow decrease and then a fast increase is often incurred across these frames. This is because generally clapboards are slowly put in but quickly removed from the scene. Therefore, we identify the clapboards by detecting such energy changes, together with another cue for clapboard events, which is high activity level, referring to motion-caused apparent content changes. In addition, such clapboard events usually appear at the beginning of the detected shots, which is also taken into consideration in detecting such events.
C. Filtering e_clip Frames
In e_clips, junk frames are caused by irrelevant scenes, which are typically happened when the camera is still on after the request of “cut”. Consequently, strong motions can be found in the captured images prior to a real cut, which is caused by the shaking camera in order to follow the command of “cut” and switch the camera off. According to strong motions and apparent content changes, this kind of junk frames may be classified as active frames and detected as V-unit. However, they can be eliminated by examining their visual appearances. Our model described in Section II actually specifies that all V-units prior to every detected shot cut are possible to be e_clip frames. They are validated if the two conditions are satisfied, which include: (i) there exist continuous frames with large activity levels in the V-unit; (ii) Content of the V-unit presents significantly large difference from that of its neighboring V-units within the same shot. Details in defining the content similarity between frames can be found in Section IV.
IV. DETERMINING RETAKES
With junk frames being removed and all shots being classified into V-units, the next step in our proposed algorithm for video summarization is to remove further redundancy caused by retakes. In practice, retakes are often generated by repetition of shooting the same scenes, events or activities, and thus directors can have a number of choices towards his or her final video production. To this end, retakes can be generally described as video shots with similar content, and thus redundancy exist among all such relevant video shots. As no prior knowledge is generally available about the retakes inside the input videos, we propose to cluster all the divided shots into content similar groups. As a result, all retakes are expected to be included in the same cluster, and thus selection of representative shot from each cluster could effectively remove all the retakes. In practice, however, the number of retakes is unknown and thus an adaptive clustering scheme is required in this case instead of those fixed clustering schemes.
A. Similarity of Selected Key-frames
First of all, we define three key frames for each V-unit including the first, the last, and the middle frame. The middle frame is of maximum activity level over the central half part of the V-unit. Similarity between key frames is measured by using histograms of their DC-images. Let
Y
dc(i) andY
dc(j) be two DC-images, and their luminance histograms areh
i andh
j with K bins. It is found from our investigation that histogram intersection,c
s(
i
,
j
)
as defined in (6), fails to provide appropriate similarity measurement in such a context, although it has been widely used in retrieval applications. Instead, we propose a histogram correlationc
h(
i
,
j
)
and image differencec
d(
i
,
j
)
instead. These are defined in equations (7) and (8):K
k
h
k
h
j
i
c
K k
j i
s
(
,
)
min(
(
),
(
))
/
] , 1 [
]
,
1
[
,
))]
(
),
(
[max(
)
(
)
(
)
,
(
2k
K
k
h
k
h
k
h
k
h
j
i
c
k i j
k
j i
h
(7)
nm mn
j dc i dc n m j dc i dc d
n
m
Y
n
m
Y
n
m
Y
n
m
Y
j
i
c
, , ) ( ) ( , ) ( ) (]
)
,
(
),
,
(
min[
|
)
,
(
)
,
(
|
1
)
,
(
(8)
An overall similarity of images can be attained as:
2
/
)]
,
(
)
,
(
)[
,
(
)
,
(
i
j
w
i
j
c
i
j
c
i
j
c
h
d (9)))
(
),
(
max(
))
(
),
(
min(
)]
(
[
)]
(
[
)
(
)
(
2
)
,
(
2 2j
e
i
e
j
e
i
e
j
n
i
n
j
n
i
n
j
i
w
c c c c
(10) wheree
(
i
)
ande
(
j
)
refer to the energy of the two DC-imagesY
dc(i) andY
dc(j), andw
(
i
,
j
)
1
is a weighting factor for the similarity valuec
i
,
j
, which is calculated in considering their differences among the values of energy and among the values of
.
c
n
. As seen in (10), large difference corresponds to a small weight value and vice versa. The closern
c(
i
)
andn
c(
j
)
are in two frames, the more likelyw
(
i
,
j
)
is to be 1, and thus no punishment is made for the similarityc
(
i
,
j
)
. Otherwise,c
(
i
,
j
)
is reduced due to the disparity betweenn
c(
i
)
andn
c(
j
)
. Same rules are also applied toe
(
i
)
ande
(
j
)
as we require small difference of energy between similar frames.B. Adaptive Shot Clustering
Retakes are essentially repetitive image clips of the same shot captured under various conditions, such as change of camera position, lighting configuration and acting rhythms, and each of them may be “cut” at anytime during the capturing process. Consequently, their contents and lengths may change, which have inevitably caused new problems for their detection. One main problem here is that each retake may be detected as a shot, thus we need to group all detected shots into clusters as such that each cluster contains all retakes of the same shot.
Similarity of shots is measured by the similarity between key frames in each shot. Let sm and sn be two shots and their corresponding sequences of key frames are vm and vn, respectively, the similarity of these two shots are denoted by (sm,sn), which is defined as follows.
m n v i j v mn
m
s
v
c
i
j
s
max
(
,
)
|
|
1
)
,
(
(11)where i and j are indexes of key frames in sm and sn, respectively, and
|
v
m|
denotes the number of key frames in sm.Let the list of shots form
q
clusters, an optimal number ofq
is decided by minimizing (12), i.e. minimizing dintra whilst maximizing dinter.
)
'
(
)
'
(
min
arg
int int'
d
q
q
d
q
er ra q(12)
where dintra(q') and dinter(q') respectively denote intra-class compactness and inter-class disparity among shot clusters when they
For a given shot cluster gc, its intra-class compactness is defined as the average dissimilarity between each pair of different shots within the cluster as follows.
n
m m n
c c c
ra
g
N
N
s
s
d
,
int
(
1
)
[
1
(
,
)]
2
)
(
(13)
where Nc denotes the number of shots in gc, and 1(sm,sn) refers to dissimilarity between two shots
s
m and sn, andc n
m
s
g
s
,
.)
(
int
q
d
ra is defined as the average distance of all individuald
intra(
g
c)
where c[1,q] , i.e.
qc ra c
ra
q
q
d
g
d
1 int 1
int
(
)
(
)
(14)
As for inter-class disparity, it is defined as an average distance between each pair of sequential clusters in (15). Here, calculating similarity between each pair of clusters is unnecessary due to the fact that retakes of one shot are adjacent (see our model in Section 2). Therefore, it is adequate to check the dissimilarity of sequentially clusters in determining dinter(q). This is shown below.
)
,
(
1
1
)
(
1 11 int
q c cc
er
q
q
dist
g
g
d
(15)
where
dist
(
g
c,
g
c1)
denotes distance of two clusters which is further defined in (16) as the average of the minimum distancebetween each shot in
g
c and all other shots ing
c1.
c c g m n g c cc
m
n
N
g
g
dist
(
,
)
1
min
1
(
,
)
1
1
(16)
In (16), the minimum distance is utilized so that a very small distance can be obtained if retakes of the same shot are misclassified into two different clusters. Consequently, an overall inter-class cluster turns small in (15) which will help to correct such errors in applying (12) to determine the optimal class number
q
.V. GENERATING VIDEO SUMMARIES
Following the proposed adaptive clustering of shots, all retakes are arranged within the same cluster. To complete the video summarization, therefore, we propose to select one representative shot out of each cluster to generate the final summarized video. In practice, as the length of retakes can vary since each of them can be cut in the middle upon the request of the director, we simply choose the most representative shot as the longest one in each cluster, in order to maximize the preservation of visual content for the original input videos. Consequently, summarization of each cluster is then done by selecting frames in the corresponding most representative shot, and all other shots in the cluster will be ignored in video summarization.
To meet the requirement set up by TRECKVID08, we allow an adjustable upper limit of the summarization ratio (between 0 and 1) in video summarization, i.e. the target video will have frames no more than a fixed percentage of the original video. Next, we will discuss how to assign the size quota to all selected and most representative shots from each cluster, and how to generate video summarization. The principle here is that, for those clips with lower activity level, the re-sampling rate is coarse, i.e., the interval between inserted frames is high. On the contrary, clips with higher activity level, the re-sampling rate would be fine. This is consistent with the expectations of our human perceptions in viewing videos. Relevant techniques are discussed in details as follows.
s i
i
a
s
r
(
)
(17) where
a
i refers to the activity level of the ith valid frame inside shot s.Let R0 be the length of the original video in frames, the length of the summarization video should be no more than R0 frames, where
is a predefined upper limit of the summarization ratio (TRECKVID’08 specifies
0.02). Therefore, each ranked frame corresponds to R0/R frames inside the summarization video, where
j j
s r
R is the length of summarization
video. For the convenience of description, we call R0/R as a rank frame ratio. According to the determined rank r(s), shot s can be summarized into r(s)R0/R frames.
To determine the specific value of r(s)R0/R inside the shot s for summarization, we take the first active frame from each shot as the initial summarization video frame, and then carry out an iterative process to select the remaining frames. If frame
i
1 has been selected, the next frame to be selected as denoted byi
2, should be the first active frame satisfying that the accumulated activity level betweeni
1 andi
2 is no less than the rank frame ratio R0/R.
2 1 2
1
,
/
0
i i i
i i
i i
i
R
R
a
i
s
a
(18)
In (18), index
i
can be discontinuous as it only refers to active frames in the shot s.It is worth noting that the above re-sampling is nonlinear and unevenly distributed over frames. In terms of the accumulated activity levels, however, the sampling process could be regarded as even. If a video clip contains high activity level caused by camera/object motion or content changes, for example, its re-sample rate becomes small. On the other hand, a video clip of low activity level will have a much higher re-sample rate due to its smooth contents contained. This is consistent with our understanding of video contents and identification of importance over sequence of videos. Some interesting results are shown and discussed in the next section.
As mentioned before, video clips with too short lengths are generally unnoticeable to our human vision system. To this end, only shots which are determined to have more than tg frames of quota size are included in generating the summarization. Parameter tg is defined in Section II(C) by considering the characteristics of human vision systems. On one hand, it can remove short-lived noisy events. On the other hand, it helps to further reduce the size of generated summarization. As a result, the final summarization will appear less than the predefined overall quota size R0/R.
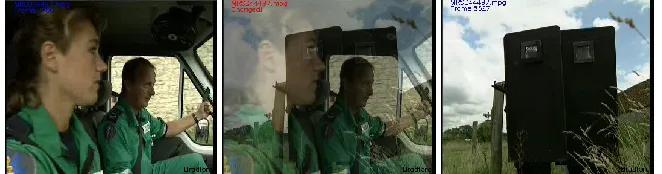
Figure 5. Generated frames for video summarization with embedded texts and artificial one-frame dissolve.
VI. RESULTS AND DISCUSSIONS
The proposed model and techniques have been fully tested by using the data from TRECVID’08 and the relevant results and evaluations are reported below. Generally, video summarization is a subjective task in which the quality of the summarization is solely dependent on specific application domains. For example, sports video is emphasized more on some highlights such as a goal event, and for news and movie videos the contents of interest will be different. Therefore, clearly defining these interested events over a given data set in a prior is a must for further evaluations. The data set and evaluation rules of our proposed algorithm are described in details as follows.
A. Data Set and Evaluation Criteria
In 2008, the test data for BBC rushes has 39 video clips with about 1545500 frames (about 17.2 hours at 25fps) in MPEG-1 format in which the shortest and the longest sequences are less than 10 minutes and near 37 minutes, respectively. These test sequences are unedited video footages, which are extracted mainly from five series of BBC drama programs. These programs have covered a wide range of sources, including one historic drama in London in the early 20th century, a series on ancient Greece, a contemporary detective series, a police drama, series on emergency service and also miscellaneous scenes from other programs.
In the rush videos, indoor and outdoor scenes of people’s daily life are included. As a result, the contents of interest are closely relevant to these activities, which are defined in two aspects including objects and events. For objects, they refer to both human actors and other entities. Regarding events, they are generally caused by movement of objects and cameras. To this end, we propose to consider the following four types of contents to generate the summarized videos:
1) Objects (no event or camera motion), like a car, an old woman, a room, etc.;
2) Objects under camera motions, such as pan to the car and zoom into the man, in fact only zoom in/out (including close-up) and pan are emphasized now;
3) Objects in events, such as people talking and red hot-air-balloon ascending; 4) Objects under camera motion whilst in an event.
With the defined contents of interest, nine criteria are utilized by TRECKVID08 to evaluate each group of generated summary results. There criteria are summarized and briefly described in Table 1 and further details can be found in [18].
Table 1. Descriptions of nine criteria used for evaluation.
Criteria Comments
DU: duration of the summary in seconds
The upper limit is 2% of original videos; shorter summary will be considered better than longer ones.
XD: difference between target and actual summary size
Positive or negative XD values mean that the overall summary size is less or larger than the given upper limit, i.e. a successful/unsuccessful summary set.
IN: fraction of inclusions found in the summary
This stands for percentage of important events/objects within [0,1] included in the generated summary.
JU: degree of junk frames in the summary
This is measured in five levels from 1 to 5 and 5 means least junk videos found in the summarized videos.
RE: degree of duplicate video in the summary
This is also measured in five levels and 5 means least redundant contents found in the summary.
TE: degree of pleasant tempo/rhythm in the summary
This is also measured in five levels with 5 standing for the best.
TT: total time spent in judging the inclusions in seconds
This is used to check if the summary is easy for understanding when manually evaluated by users in searching certain events and objects VT: total video play time except
pause period in judging IN
Similar as TT
RT: total running time in seconds
This is used to evaluate the efficiency of each system proposed.
B. Overall Results
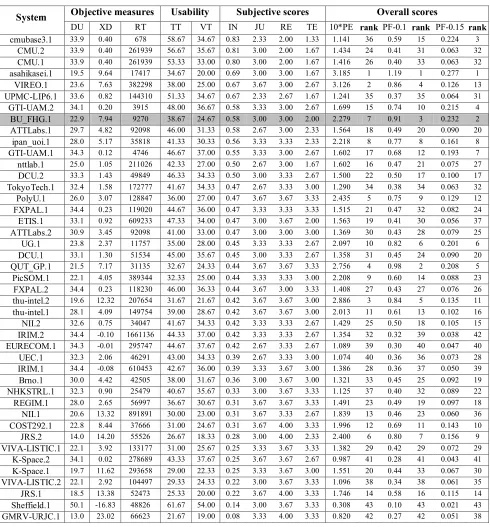
Due to repetitive shot retakes, these rushes have a great potential for efficient summarization. Some manual experiments have indicated that a 10% summary might be sufficient to cover all useful contents and exclude all the redundancy and meaningless junk frames. TRECKVID08 sets an upper limit of 2% for automatic video summarization. This year, there are 44 teams worldwide registered for this task, and eventually only 32 teams have made their submissions with 43 groups of results (excluding one incomplete submission). According to the final results announced by the organizer of TRECVID, the evaluation results of all the submissions are summarized in Table 2 and our results (in light-grey background with a system ID “BU_FHG.1”) can be highlighted as follows.
Measured in terms running time, our system spends only 9270s (6.07 times of real-time video playing), achieving the 4th fastest or the 3rd fastest (considering two submissions from GTI-UAM as one) whilst yielding competitive results under other criteria. If the benchmark provided by University of Carnegie Mellon is ignored, which only contains simple re-sampling of original input videos, our proposed algorithm achieves the 3rd fastest or the 2nd fastest;
Measured in fraction of inclusions found in the summary, our results scored 0.57/0.58 in average/median evaluations, achieving the 7th/8th best among all the submissions. Note that the results of higher IN scores may contain more junk and repeated videos, i.e. less JU and RE scores;
For duration of the summary, the average and median length of our submission is 22.92s and 22.9s, which is 8.79s and 7.94s less than the upper limit of 2% set up by TRECKVID’08.
introduced in the evaluation stage, which was unknown during the algorithm design and implementation. As a result, it was not taken into consideration when our algorithms were developed. Secondly, since the summarization generated by our approach is composed of separate frames, this will inevitably lead to low score of TE. One possible improvement is to generate summarization as a set of short clips with audio support, which will significantly enhance the scores of TE and IN yet it may degrade other scores such as RE and JU.
Table 2. Typical results from TRECVID’08 on BBC rush summarization in decreasing IN score order.
As these nine measurement criteria are difficult to make specific analysis and unanimous indication for the performance interpretation, we propose a combined measurement
PF
belowSystem Objective measures Usability Subjective scores Overall scores
DU XD RT TT VT IN JU RE TE 10*PE rank PF-0.1 rank PF-0.15 rank
cmubase3.1 33.9 0.40 678 58.67 34.67 0.83 2.33 2.00 1.33 1.141 36 0.59
4 15 0.224 3 CMU.2 33.9 0.40 261939 56.67 35.67 0.81 3.00 2.00 1.67 1.434 24 0.41
2
31 0.063 32 CMU.1 33.9 0.40 261939 53.33 33.00 0.80 3.00 2.00 1.67 1.416 26 0.40
7 33 0.063 32 asahikasei.1 19.5 9.64 17417 34.67 20.00 0.69 3.00 3.00 1.67 3.185 1 1.19
9
1 0.277 1 VIREO.1 23.6 7.63 382298 38.00 25.00 0.67 3.67 3.00 2.67 3.126 2 0.86
4
4 0.126 13 UPMC-LIP6.1 33.6 0.82 144310 51.33 34.67 0.67 2.33 2.67 1.67 1.241 35 0.37
8 35 0.064 31 GTI-UAM.2 34.1 0.20 3915 48.00 36.67 0.58 3.33 3.00 2.67 1.699 15 0.74
3
10 0.215 4
BU_FHG.1 22.9 7.94 9270 38.67 24.67 0.58 3.00 3.00 2.00 2.279 7 0.91
4 3 0.232 2 ATTLabs.1 29.7 4.82 92098 46.00 31.33 0.58 2.67 3.00 2.33 1.564 18 0.49
9
20 0.090 20 ipan_uoi.1 28.0 5.17 35818 41.33 30.33 0.56 3.33 3.33 2.33 2.218 8 0.77
7 8 0.161 8 GTI-UAM.1 34.3 0.12 4746 46.67 37.00 0.55 3.33 3.00 2.67 1.602 17 0.68
7
12 0.193 7 nttlab.1 25.0 1.05 211026 42.33 27.00 0.50 2.67 3.00 1.67 1.602 16 0.47
0
21 0.075 27
DCU.2 33.3 1.43 49849 46.33 34.33 0.50 3.00 3.33 2.67 1.500 22 0.50
9
17 0.100 17 TokyoTech.1 32.4 1.58 172777 41.67 34.33 0.47 2.67 3.33 3.00 1.290 34 0.38
6
34 0.063 32 PolyU.1 26.0 3.07 128847 36.00 27.00 0.47 3.67 3.67 3.33 2.435 5 0.75
1
9 0.129 12 FXPAL.1 34.4 0.23 119020 44.67 36.00 0.47 3.33 3.33 3.33 1.515 21 0.47
1
32 0.082 24 ETIS.1 33.1 0.92 609233 47.33 34.00 0.47 3.00 3.67 2.00 1.563 19 0.41
3
30 0.056 37 ATTLabs.2 30.9 3.45 92098 41.00 33.00 0.47 3.00 3.00 3.00 1.369 30 0.43
6
28 0.079 25
UG.1 23.8 2.37 11757 35.00 28.00 0.45 3.33 3.33 2.67 2.097 10 0.82
1
6 0.201 6
DCU.1 33.1 1.30 51534 45.00 35.67 0.45 3.00 3.33 2.67 1.358 31 0.45
9
24 0.090 20 QUT_GP.1 21.5 7.17 31135 32.67 24.33 0.44 3.67 3.67 3.33 2.756 4 0.98
0
2 0.208 5 PicSOM.1 22.1 4.05 389344 32.33 25.00 0.44 3.33 3.33 3.00 2.208 9 0.60
9
14 0.088 23 FXPAL.2 34.4 0.23 118230 46.00 36.33 0.44 3.67 3.00 3.33 1.408 27 0.43
8
27 0.076 26 thu-intel.2 19.6 12.32 207654 31.67 21.67 0.42 3.67 3.67 3.00 2.886 3 0.84
8
5 0.135 11 thu-intel.1 28.1 4.09 149754 39.00 28.67 0.42 3.67 3.67 3.00 2.013 11 0.61
1
13 0.102 16 NII.2 32.6 0.75 34047 41.67 34.33 0.42 3.33 3.33 2.67 1.429 25 0.50
3
18 0.105 15 IRIM.2 34.4 -0.10 1661136 44.33 37.00 0.42 3.33 3.33 2.67 1.354 32 0.32
3 39 0.038 42 EURECOM.1 34.3 -0.01 295747 44.67 37.67 0.42 2.67 3.33 2.67 1.089 39 0.30
9
40 0.047 40 UEC.1 32.3 2.06 46291 43.00 34.33 0.39 2.67 3.33 3.00 1.074 40 0.36
7 36 0.073 28 IRIM.1 34.4 -0.08 610453 42.67 36.00 0.39 3.33 3.67 3.00 1.386 28 0.36
6
37 0.050 39 Brno.1 30.0 4.42 42505 38.00 31.67 0.36 3.00 3.67 3.00 1.321 33 0.45
5 25 0.092 19 NHKSTRL.1 32.3 0.90 25479 40.67 35.67 0.33 3.00 3.67 3.33 1.125 37 0.40
8
32 0.089 22 REGIM.1 28.0 2.65 56997 36.67 30.67 0.31 3.67 3.67 3.33 1.491 23 0.49
9 19 0.097 18 NII.1 20.6 13.32 891891 30.00 23.00 0.31 3.67 3.33 2.67 1.839 13 0.46
7
23 0.060 36 COST292.1 22.8 8.44 37666 31.00 24.67 0.31 3.67 4.00 3.33 1.996 12 0.69
6 11 0.143 10 JRS.2 14.0 14.20 55526 26.67 18.33 0.28 3.00 4.00 2.33 2.400 6 0.80
5
7 0.156 9 VIVA-LISTIC.1 22.1 3.92 133177 31.00 25.67 0.25 3.33 3.67 3.33 1.382 29 0.42
5 29 0.072 29 K-Space.2 34.1 0.02 278689 43.33 37.67 0.25 3.67 3.67 2.67 0.987 41 0.28
2
41 0.043 41 K-Space.1 19.7 11.62 293658 29.00 22.33 0.25 3.33 3.67 3.00 1.551 20 0.44
0
33 0.067 30 VIVA-LISTIC.2 22.1 2.92 104497 29.33 24.33 0.22 3.00 3.67 3.33 1.096 38 0.34
5
38 0.061 35 JRS.1 18.5 13.38 52473 25.33 20.00 0.22 3.67 4.00 3.33 1.746 14 0.58
9
16 0.115 14 Sheffield.1 50.1 -16.83 48826 61.67 54.00 0.14 3.00 3.67 3.33 0.308 43 0.10
5
43 0.021 43 GMRV-URJC.1 13.0 23.02 66623 21.67 19.00 0.08 3.33 4.00 3.33 0.820 42 0.27
0
h
RT
DU
JU
RE
IN
PF
*
*
(19)
If h=0, PF becomes PE , a special case which was defined in [22] as an overall score for summarization evaluation. Since XD can be determined by DU and the predefined upper limit of summary size, it is not used in our overall scoring. The other two objective measurements of DU and RT are utilized in our defined PF, where RT is the new factor introduced in comparison with
PE. We think this is important as RT is a good indicator to show the complexity of a summarization algorithm for practical implementation and applications, and the parameter h>0 is used to adjust the weight or influence of RT in PF.
If h is too large, say h>h1=0.45, the whole results become very similar to the rank of RT only which is inappropriate in such a context. In contrast, if h is too small, say h<h0=0.04, the effect of RT becomes meaningless. In practice, we have 2h0<h< h1/2, i.e. 0.09<h<0.23 and h=0.15 is suggested. Consequently, we propose to carry out the following overall evaluation.
Considering PE, our results are ranked the 7th best among 43 groups of results from 32 teams. If the running time RT is also considered and thus the overall score is revised as PF, our results will be ranked as the 3rd or the 2nd best.
To provide a clearer picture for the status of the proposed algorithm in comparison with the existing techniques, we make a comparative analysis upon the differences between the proposed algorithm and others with better PE/PF scores, which include “asahikasei.1”, “VIREO.1”, “thu-intel.2”, “QUT_GP.1”, “PolyU.1” and “JRS.2” in TRECKVID08. While details of the work in “asahikasei.1” are not clear, the main techniques used in “VIREO.1” include object and face detection, camera motion estimation, key-point matching and tracking, audio classification and speech recognition, and it also needs supervised learning of typical samples before removal of junk frames. In “thu-intel.2”, face detection and audio analysis are required, together with motion magnitude for clustering and optical character detector for detecting clapboards. In “QUT_GP.1”, a spanning tree is employed for clustering with detected faces for summarization. “PolyU.1” utilizes both audio and visual information for summarization with removal and pruning of shots and key frame selection. In “JRS.2”, hidden Markov model and rule-based approach are used with detected faces for summarization.
In summary, all the systems above require complex processing to detect high-level semantic objects for summarization such as face detection, audio analysis and feature tracking, etc. Since face and audio information is not always available, this has constrained the applications of these methods. In contrast, our proposed algorithm does not include any complex processing above yet operating entirely in compressed domain. Therefore, our proposed algorithm is more suitable for generic summarization, where real-time analysis and implementation is required, which is very essential for content-based online search and retrieval.
C. Intermediate Results
There are four main groups of intermediate results produced during the processing, which include those from shot cut detection, key frame extraction, filtering junk frames and clustering of retakes. In the following, some typical intermediate results are also presented and analyzed in details to show the performance of the proposed algorithm.
Figure 6. Examples of first eight cuts detected from MRS336853.mpg sequence with their start/end frames and associated cut likelihoods.
According to the cuts given in Figure 6, we have eight detected shot candidates which can be summarized in Table 3 while the information for the ninth cut is incomplete. In Table 3, the first two shot candidates are junk frames belonging to H-cut, and the other ones are of normal contents. There are four shot candidates ranging from the third to the sixth in Table 3 which forms five retakes of similar contents, though the contents in the third and the seventh candidate cuts cannot be discovered in Figure 6 due to the fact that they have either almost the same start and end frames, or inconsistent boundary frames. This has indicated that shot similarity cannot be simply measured by their two boundary frames, hence sub-shots of V-unit is introduced and extracted for more accurate matching.
Table 3. Obtained shot candidates corresponding to the detected cuts in Figure 6.
Shot candidates 1st 2nd 3rd 4th 5th 6th 7th 8th
Start frame 0 249 808 1840 2608 3168 3657 4285
End frame 248 807 1839 2607 3167 3656 4284 5244
Type H-cut H-cut Normal Normal Normal Normal Normal Normal
Real shot index N/A N/A 1st 1st 1st 1st 1st 2nd
No. of V-units N/A N/A 4 1 1 1 1 2
Valid frames N/A N/A 1030 766 554 487 626 958
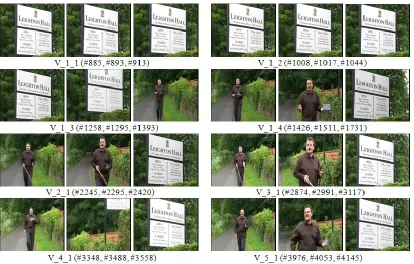
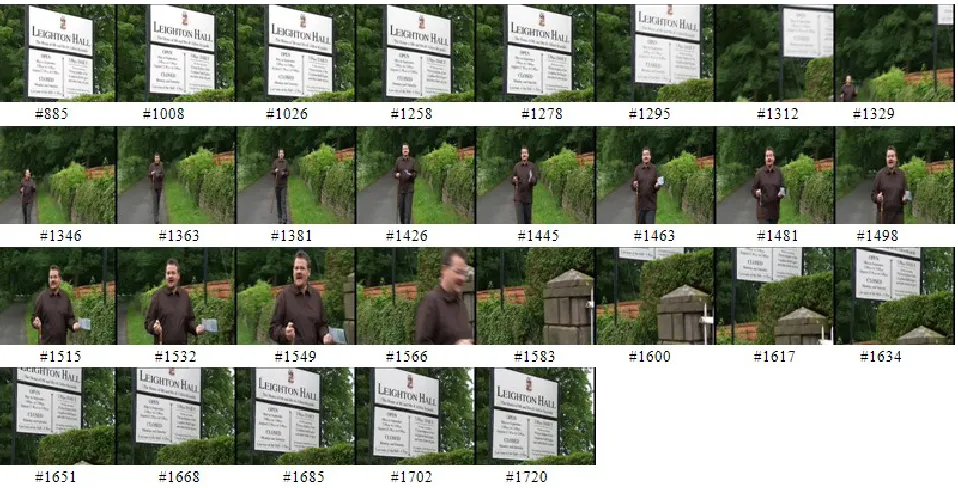
[image:16.612.117.480.609.723.2]According to the five retakes of the 1st real shot in Table 3, there are four V-units extracted for the first retake and one for each of the other four retakes, respectively. Figure 7 shows three key frames extracted from each of the determined V-units for comparisons, where the first two rows are for the first retake and the other two rows for the remaining four retakes. As a matter of fact, the retakes of similar contents can be easily identified by the extracted key frames from the V-Units: V_1_4, V_2_1, V_3_1, V_4_1 and V_5_1. From the middle key frame to the end of each V-unit, it takes 220, 125, 126, 70 and 92 frames in the five retakes, respectively, which hints a fast camera motion of least frames in the fourth retake to change the camera focus from the man to the signboard. Due to this fast camera motion, the extracted middle key frame in V_4_1 is inconsistent with those from other four retakes, which may cause inaccurate shot similarity derived from key frames. However, this error can be recovered by the clustering results as shot similarity is defined as the sum of maximum similarity between each pair of key frames, see
(
m
,
n
)
as defined in (11). As a result, inaccurate detection of one key frame is not vital, and thus our proposed algorithm achieves certain level of robustness. Finally, the generated summary frames of the five retakes are illustrated in Figure 8.Figure 7. List of key frames extracted for each V-unit of the first shot containing five retakes.
Figure 8. List of final summarization results of the five retakes in Figure 6 and Table 3.
D. Error Analysis
In the following, we discuss the reasons of relatively limited scores on IN, RE and JU achieved by the proposed algorithm, which has been used for an overall evaluation of the summarization result. In our proposed modelling, junk frames are categorized into three classes, i.e. H-cut, s_clip and e_clip, and it is found that those junk frames failing the proposed filter are all belong to the last two categories. Our model in filtering s_clip relies on apparent energy changes, and thus it requires large clapboards in the scene. For junk frames inside e_clip, similar problem has been observed that visual indicators alone as described in previous sections are often insufficient, and in this circumstance, inclusion of audio information such as detecting “cut” command could provide more information for further improvement.
Regarding redundant contents in the summarized results, the error is mainly caused by strong motions in large areas within the video, such as fast camera movement and large background movement of water, etc. This kind of motion will lead to inaccurate extraction of key frames in effective clustering of retakes since the low similarity between frames will lead to unreliable new clusters. Then, retakes of same shot are put in two or more clusters and redundant contents are produced when summarized frames are extracted from each of the clusters. This can be further resolved by extracting more key frames and also introducing motion compensation strategy.
The lost score for the proposed algorithm under the criterion IN is mainly due to insufficient representative frames of certain events/objects, as noticeable visual perception requires at least 10 frames or 0.5 second. Specifically, the insufficiency can be analyzed in terms of two cases: one is short appeared objects/events in the original video, and the other is caused by summarization whilst useful contents are abandoned due to limited quotas in assigning valid frames. In the second case, IN score can be further improved with increased quota frames, which can be achieved by reducing junk frames and redundancy under fixed overall quota frames, i.e. improving RE and JU scores. In other words, these three measures are correlated hence an overall measurement is required such as our introduced
PF
.E. Further Evaluation using Other Video Contents
which only includes activity-level extraction, key frame determination and summary generation. Meanwhile, another group of key frames are extracted for summarization using the curvature points of the accumulative activity-level curve which has been widely used in many systems [7, 37]. The two schemes in key frame extraction and video summarization are compared over three sequences containing news, sports and movie, and the results are shown in Table 4. Please note only the inclusion of objects/events are utilized as the criterion in this experiment; and each summarized video are manually scored by three individuals and the average score is then obtained and listed in Table 4 for comparison.
[image:19.612.111.492.308.383.2]In Table 4, three quota values are specified as the target size ratio of the summarized video against the original one, including 5%, 10% and 15%. “Ref” and “Our” respectively denote results using curvature points and our approach. As can be seen, the results from our approach slightly outperform those using curvature based method. This is mainly due to the fact that we extract key frames of equal temporal variance which makes it less sensitive to noised curvatures. Although for rush videos a low summarization quota of 2% is allowable to generate an inclusion rate of about 60%, a high quota over 10% is needed to generate the similar inclusion rate for general videos as they contain much less redundancy than rush videos. Under a given summarization quota of 15%, our approach can successfully retain over 70% of the main objects and events.
Table 4. Evaluation of our algorithm using other video contents.
Sequences/ Results
Quota=5% Quota=10% Quota=15%
Ref Our Ref Our Ref Our
Movie 48.7% 51.4% 59.6% 61.5% 69.6% 72.6%
News 51.1% 52.8% 61.4% 62.6% 71.2% 74.4%
Sports 46.3% 49.7% 58.3% 60.9% 67.1% 71.6%
VII. CONCLUSIONS
In this paper, we described a new algorithm for rush summarization in TRECVID’08, which illustrates that competitive performances can be achieved without complex signal processing techniques, such as those including face detection, feature tracking and audio analysis etc. adopted by other participating teams. In addition, we have also demonstrated that compressed-domain processing is not only efficient but also effective in such a context. Our hierarchical modeling, adaptive clustering and activity-level based summarization generation are found very useful in achieving robust summarization of rush videos. Further improvement could be made by introducing new techniques towards more accurate key frame extraction, more junk frames removal, and more inclusion of interesting contents.
ACKNOWLEDGMENT
The authors wish to acknowledge the financial support from the EU IST Framework Research Programme under both HERMES project (Contract No IST-216709) and LIVE project (Contract No IST-4-027312). Finally, special thanks are given to the anonymous reviewers and the associate editor for their constructive comments to further improve this paper.
REFERENCES
[1]. C. W. Ngo, Y. F. Ma, and H.-J. Zhang, “Video summarization and scene detection by graph modelling,” IEEE T-CSVT, 15(2): 296-305, 2005.
[4]. Z. Li, G. M. Schuster and A. K. Katsaggelos, “Rate-distortion optimal video summary generation,” IEEE Trans. Image Proc., 14(10): 1550-1560, 2005.
[5]. A. Hanjalic and H.-J. Zhang, “An integrated scheme for automated video abstraction based on unsupervised cluster-validity analysis,” IEEE T-CSVT, 9(8): 1280-1289, 1999.
[6]. C. Kim and J. N. Hwang, “Object-based video abstraction for video surveillance systems,” IEEE T-CSVT, 12(12): 1128-1138, 2002. [7]. T. Liu, H.-J. Zhang and F. Qi, “A novel video key-frame extraction algorithm based on perceived motion energy model,” IEEE T-CSVT, 13(10): 1006-1013, 2003.
[8]. Z. Cernekova, I. Pitas and C. Nikou, “Information theory-based shot cut/fade detection and video summarization,” IEEE T-CSVT, 16(1): 82-91, 2006.
[9]. Z. Li, G. M. Schuster and A. K. Katsaggelos, “MINMAX optimal video summarization,” IEEE T-CSVT, 15(10): 1245-1256, 2005. [10].N. Babaguchi, Y. Kawai, T. Ogura and T. Kitahashi, “Personalized abstraction of broadcasted American football video by highlight selection,” IEEE T-Multimedia, 6(4): 575-586, 2004.
[11].A. M. Ferman and A. M. Tekalp, “Two-stage hierarchical video summary extraction to match low-level user browsing preferences,” IEEE T-Multimedia, 5(2): 244-256, 2003.
[12].X. Zhu, A. K. Elmagarmid, X. Xue, L. Wu and A. C. Catlin, “InsightVideo: toward hierarchical video content organization for efficient browsing, summarization and retrieval,” IEEE T-Multimedia, 7(4): 648-666, 2005.
[13].A. Ekin, A. M. Tekalp and R. Mehrotra, “Automatic soccer video analysis and summarization,” IEEE T-Image Proc., 12(7): 796-807, 2003. [14].A. Hanjalic, “Adaptive extraction of highlights from a sport video based on excitement modelling,” IEEE T-Multimedia, 7(6): 1114-1122, 2005.
[15].N. Dimitrova, “Context and memory in multimedia content analysis,” IEEE Multimedia, 11(3): 7-11, 2004.
[16].M. Guironnet, D. Pellerin, N. Guyader and P. Ladret, “Video summarization based on camera motion and a subjective evaluation model,” EURASIP J. Image and Video Processing, Article ID 60245, 2007.
[17].A. G. Money and H. Agius, H. “Video summarization: a conceptual framework and survey of the state of the art,” J. Visual Commu. Image Repres., 19(2): 121-143, 2008.
[18].P. Over, A. F. Smeaton and G. Awad, “The TRECVID 2008 BBC rushes summarization evaluation,” In Proc. of the Int. Workshop on TRECVID Video Summarization (TVS '08, Oct. 31, 2008), Vancouver, BC, Canada, 1-20, 2008.
[19].J.-C. Ren, J.-M. Jiang and J. Chen, “Shot boundary detection in MPEG videos using local and global indicators,” To appear in IEEE T-CSVT, 2009.
[20].B. T. Truong and S. Venkatesh, “Video abstraction: a systematic review and classification,” ACM T-Multimedia Computing Commun. Appl., 3(1), Article 3: 1-37, http://doi.acm.org/10.1145/1198302.1198305, 2007.
[21].Y. Li, S.-H. Lee, C.-H. Yeh and C.-C. J. Kuo, “Techniques for movie content analysis and skimming,” IEEE Signal Proc. Magaz., 23(2): 79-89, 2006.
[22].T. Wang, Y. Gao, J. Li, P. P. Wang, X. Tong, W. Hu, Y. Zhang and J. Li, “THU-ICRC at rush summarization of TRECVID 2007,” In Proc. of the Int. Workshop on TRECVID Video Summarization (TVS '07, Sept. 28, 2007), Augsburg, Bavaria, Germany, 79-83, 2007.
[23].J.-C. Ren and J. Jiang. Hierarchical Modeling and Adaptive Clustering for Real- time Summarization of Rush Videos in TRECVID’08. In Proc. of the Int. Workshop on TRECVID Video Summarization (TVS '08, Oct. 31, 2008), Vancouver, BC, Canada.
[24].J. Bescos, J. M.. Martinez, L. Herranz and F. Tiburzi, “Content-driven adaptation of on-line video,” Signal Proc.: Image Communication, 22(7-8): 651-668, 2007.
[25].D. Tjondronegoro, Y. P. Chen and B. Pham, “Integrating highlights for more complete sports video summarization,” IEEE Multimedia, 11(4): 22-37, 2004.
[26].X. Zhu, J. Fan, A. K. Elmagarmid and X. Wu, “Hierarchical video content description and summarization using unified semantic and visual similarity,” Multimedia Systems, 9(1): 31-53, 2003.