PROTECTION CHALLENGES IN FUTURE CONVERTER
DOMINATED POWER SYSTEMS: DEMONSTRATION
THROUGH SIMULATION AND HARDWARE TESTS
Ruiqi Li
1, Campbell Booth
1, Adam Dyśko
1, Andrew Roscoe
1, Helge Urdal
2, Jiebei Zhu
31-Department of Electronic and Electrical Engineering, University of Strathclyde, Glasgow, G1 1XW, UK. contact:
{ ruiqi.li, campbell.d.booth, a.dysko, andrew.j.roscoe}@strath.ac.uk
2-Urdal Power Solutions Ltd. contact: helge@urdalpowersolutions.com
3-Network Strategy Group, National Grid, Warwick, CV34 6DA, UK. contact: jiebei.zhu@nationalgrid.com
Keywords: power system protection, power electronics, renewable power integration, system modelling, protection testing
Abstract
A model of a converter source capable of providing a controllable fault response is introduced to analyse the performance of protection in future power system scenarios. Using a reduced power system model of the National Grid transmission system in Great Britain, a comprehensive set of tests of protection performance are performed to verify how protection systems may be impacted by the introduction of converter-interfaced energy sources and infeeds. Converters with a range of different types of fault response are modelled, as grid codes defining converter response to AC system fault are not completely specific at the present time. The simulated data are injected into an actual protection relay through secondary injection equipment and also to a dynamic protection relay model through simulation, and the results are analysed and compared. The initial results show that there can be a degree of negative influence on protection system performance in converter-dominated scenarios where the power system is relatively “weak”, primarily in the form of longer operating times in certain scenarios. The paper concludes with analysis of results and an overview of on-going and future work to broaden the investigations.
1.
Introduction
Power electronics converters, which are used to facilitate the integration of renewable energy to AC grids and which underpin HVDC transmission networks, will play a growing and crucial role in future power system. According to the “2014 UK Future Scenarios” document [12], the target for renewable sources to provide 15 % of all energy demand (including non-electrical energy for transport, heating, etc.) of by 2020 and 34% by 2030 means that on the electrical power system in GB, the installed and available (instantaneous) capacity of renewable, converter-interfaced sources will exceed 165% of prevailing demand by 2030 [3]. It is
therefore clear that an investigation of how the different characteristics of converter-interfaced energy sources may influence power systems, including protection systems during faults, is required as a matter of urgency.
According to recently-proposed European network codes on “Requirement for Generators”, unanimously approved by the 34 Member States on 26 June 2015, and published by ENTSO-E [8], it is stated that during network faults the converter interfaced sources should output “fast”, high magnitude and sustained fault current.
However the requirements are somewhat non-specific in many instances; for example, there is no detailed specification on the required reaction speed, means of detection, or fault current magnitude when a converter is required to output fault current. These aspects are discussed in [4], which divides the time period following a fault inceptions into 3 parts: A - the protection detection period; B - the system voltage support (through provision of reactive fault current) period prior to clearance of the fault; and C - the post fault recovery period concerned with recovering system voltage and avoiding subsequent overvoltage. Discussions relating to period A remain at an early stage. The European codes state that national implementations to define specific parameters (e.g. relating to speed of detection, ramp rates and sustained levels of fault currents) are required on a country-by-country basis. In GB, these will be determined through Grid Code development processes led by National Grid with input from stakeholders and the final decision being made by the regulatory body Ofgem. A similar process will also apply to the network code covering HVDC, including offshore wind connected via HVDC.
national choices of parameters that will define the nature of the required responses to mitigate any potential problems. A converter model with controllable fault response has been developed and this is tested using a transmission line model with parameters provided by National Grid (NG). The results of tests, where a range of adjustments to the converter controller fault-response parameter are made (e.g. with different detection delays, output current ramp rates and magnitudes), are presented and analysed. The simulated voltage and current waveforms are injected into an actual protection relays using an RTDS (real time digital simulator) and secondary injection amplifiers. The responses of the relays and models are observed and any potential issues are highlighted. As this paper is concerned with only initial stages of work in the context of the overall project, an overview of future work is included in the concluding section of the paper.
2.
Converter Characteristics
2.1 Fault response
Traditional network protection systems can typically detect network faults quickly and accurately due to the fact that relatively high fault currents are provided by synchronous machines in the system and the system is relatively “strong”. The fault current provided by a synchronous machine is normally a multiple of between three and six times its rated output current in the period immediately following fault inception for a fault very close to the machine terminals. Conversely, converter-interfaced sources normally have a very limited ability to provide short circuit current due to thermal ratings, with currents normally limited by the converter controller and inbuilt protection systems. The sustained fault current provided by a converter-interfaced source may typically only be around 1.2 times its nominal rating [11].
To exacerbate the potential problems for network protection schemes, converter-interfaced sources may not be able to provide maximum output current immediately after fault inception, as is the case with synchronous machines. From discussions with several industry colleagues and from analysis of [6], it is believed that, to date, the debate relating to converter fault responses in the standards-defining organisations has only related to time periods B and C as defined earlier in the paper (and not period A). It is believed that maximum fault currents (albeit much less than synchronous machine levels) will only be delivered after a delay of around 60ms, which could obviously be problematic for protection schemes in terms of operating times. Finally, values are specified as rms, which naturally introduces a delay of at least 20 ms as the requirement to calculate rms correctly from instantaneous measurements requires at least one fully cycle of input current (i.e. at least 20 ms in a 50 Hz system).
The GB Grid Code, prior to implementation of the European Network Code has required “maximum available” current “without delay”; however such terms have not been defined
explicitly in terms of time period A. It is therefore necessary to research what “without delay” and other such non-specific terminology should actually be defined as in order to mitigate or avoid problems with network protection in future scenarios.
2.2 Prevailing grid code stipulations
In the latest version of the ENTSOE-E code for HVDC Connections and DC-connected Power Park Modules [5], the following requirements are proposed:
“The Relevant Network Operator in coordination with the Relevant TSO shall have the right to require the capability of a HVDC System to provide Fast Fault Current at a Connection Point in case of symmetrical (3-phase) faults.
The Relevant Network Operator in coordination with the Relevant TSO shall specify the characteristics of the voltage deviation and the characteristics, timing and accuracy of the fault current.
With regard to the supply of Fast Fault Current in case of asymmetrical (1-phase or 2-phase) faults the Relevant Network Operator in coordination the Relevant TSO shall have the right to introduce a requirement for asymmetrical current injection.
The Relevant TSO shall define a Voltage-against-time-profile, having regard to the voltage-against-time-profile defined for Power Park Modules according to [8].This profile shall apply at the Connection Point(s) for fault conditions, under which the HVDC Converter Station shall be capable of staying connected to the Network and continuing stable operation after the power system has recovered following fault clearance.
The Relevant Network Operator shall define and make publicly available the method and the pre-fault and post-fault conditions for the calculation of at least the minimum and maximum short circuit power at the Connection Point(s).
The HVDC System shall be capable of operating within the range of short circuit power and Network characteristics defined by the Relevant Network Operator.
The Relevant Network Operator shall define the schemes and settings necessary to protect the Network taking into account the characteristics of the Power Generating Module.”
The above provides further evidence that detailed time and magnitude information relating to fault current from converters is not fully defined at this point in time. The GB Grid Code, published by National Grid [7], prior to being updated to cover the European requirements, states that:
Under close-up three phase faults and imbalanced earth fault conditions, all generating units (including DC converters) must remain connected without any tripping for a period of 140 ms.limits…each Generating Unit or Power Park Module…shall generate maximum reactive current without exceeding the transient rating limit [of the unit]..
It is clear that, in alignment with the European code, the GB code also requires converter-interfaced infeeds to provide some form of fault current and to ride-through faults, but again the exact quantifications for the nature of the responses are not yet fully defined.
Therefore, in the absence of detailed information relating to the nature or converter responses, models of converter-interfaced sources that are capable of producing a range of credible responses are required and have been developed. These models are used to investigate the anticipated performance of protection systems under a range of converter-interfaced source penetrations and with a range of assumed detection delays, ramp rates and output fault current levels. This should inform the debates relating to what is required by the network (i.e. the network protection systems) in order to avoid problems in the future in systems with high penetrations of converter-interfaced sources.
3.
System Design
3.1 VSC-HVDC model
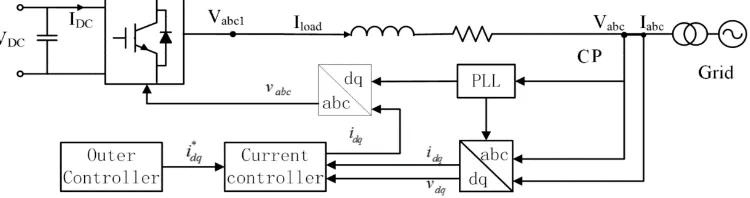
A VSC-HVDC model capable of providing controllable voltage and current output during faults has been developed to represent a typical converter-interfaced source. In Fig.1 the layout of the control system for this model is presented. The system is design to output voltage and current waveforms under different grid conditions and with response envelopes that can be user-configured to investigate the impact of different types of response on the network protection. The system contains the following main components:
• Phase Locked Loop (PLL): this track the AC voltage phase and frequency continually at the point of connection. The information is used by the Park and Inverse Park transformation processes within the controller.
• The Park transformation: this converts abc three-phase voltages and current into dq values under a rotating reference frame, as dq values can be more efficiently manipulated by the controllers.
• Inner current control system: reacts quickly to regulate the converter‟s output current to its reference value by manipulating the VSC output voltage
• Outer control system: provide a reference value for the current controller. The selection of the reference values can be varied by the operator or in accordance with the intended role of the converter.
• Dual sequence control scheme: ensures that the converter can produce the desired balanced/unbalanced output current waveforms, non-oscillating stable P&Q outputs and DC voltage under unbalanced network condition [9].
3.2 Settings for the converter’s fault response
The fault response of a converter is affected by its short term dynamic thermal rating and control system. In this paper conventional synchronous sources and converter sources are employed and the differences between their fault responses are illustrated in Fig.2.
In Fig.2, the ratings of both sources are identical. A solid three-phase short circuit is connected close to their output terminals. It is clear that upon fault inception at 0.3s, the output current from the synchronous machine transits instantly to its maximum value and decreases progressively in the subsequent time period. However, in this case and with the selected parameters for the converter model that are implemented, the converter begins increasing its output current after a time delay of approximately 20 ms and ramps up to its maximum output after a further 20 ms. This is only one example of simulated possible operation, and in reality (unless grid codes are defined to be very specific) converter current outputs in response to faults, under present interpretations of codes, could initially drop to zero for some time, be delayed by anything up to several hundred milliseconds, or anything in between. So, as already stated, there is a requirement for a flexible model to be used to perform sensitivity analysis of network protection for a wide range of presumed converter fault responses. The case studies presented later in this paper are representative of only a very small range of tests that will be performed in on-going and future work.
[image:3.595.115.490.90.189.2]damage the power electronic components. Inside the converter control system, a fault detection block is implemented to achieve the desired fault response.
(a) Output current provided by traditional synchronous machine (in pu value)
[image:4.595.42.277.129.317.2](b) Output current provided by converter (in pu value)
Fig. 2 Fault response for different types of sources
As the voltage information is measured from the connection point, when the measure value decreases below a certain level, the converter will interpret this as a fault condition. The fault detection function should be sensitive, but also secure against false operation, therefore delays are typically added to the response algorithm. As already noted, in the above figure the delay for initiation of response is around 20ms, and this delay is controllable. Converters cannot typically provide an instantaneous step change in output, and therefore a configurable ramp rate is also included [5].
Finally, the maximum sustained fault current that can be output is also configurable through the setting of the fault response block. Therefore this converter model is capable of reproducing virtually any type of fault response that may be produced in reality through configuration of its parameters.
3.3 Power system layout and fault level selection
[image:4.595.268.530.597.745.2]A simplified two-bus power system model with data acquired from National Grid has been modelled for analysis. The layout of the system is presented in Fig.4. The left bus is connected with the mixed generation sources, comprising a converter and synchronous machine – the relative proportion of each source can be varied to reflect different penetration levels of converter-interfaced sources.
Fig.3 Layout of the studied power system
Data for these studies was sourced from [2].
4.
Case studies
The simulated results for a variety of fault studies have been recorded and injected into both a validated dynamic model of a relay[1] and a hardware protection relay (in this case a distance relay). The process is performed by: applying solid three phase short circuit faults on the transmission line; recording the voltage and current data at the relay measurement point; “replaying” the data files using the RTDS (real time digital simulator) and secondary injection equipment; recording the tripping time of the relay.
The setting data of both relays are provided by National Grid. Even though the setting data within both relay are identical, the operating algorithm of those relays are different. Therefore, by comparing the two sets of responses under same network fault, the results can be more comprehensive.
When the penetration level of the converter source is 0%, the fault level is selected to be 20.85 GVA. In order to give a decent representation of the converter‟s limited ability of providing fault current, when the penetration level of the converter source is 100%, the fault level is selected to be 2.562 GVA. The converter fault detection delay is set to be 1ms and a current ramp rate as 25.2A/ms. Note that the impact of varying these values will be presented in the latter case studies.
4.1 Case study 1: impact of varying converter-interfaced source penetration levels
In this case, a converter source with fixed fault response settings is used with different penetration level within the power system model.
Fig.4: Relay tripping time with different converter source penetration level
From the figure it can be seen that when the penetration level of the converter source increased, the tripping time for different types of relay may vary. For the old relay model, the performance is not notably affected (the relay may even trip faster when the penetration level of converter is high). However for the hardware relay, the increased penetration level of the converter increases the relay‟s response time, up to 15.6ms slower than the fastest response. Therefore under this scenario conclusions can be made that the zone 1 performance of certain types of distance relays can be affected by the increased converter generating sources. More samples should be tested in order to verify this statement.
4.2 Case study 2: impact of varying converter response delay
Continued from case study 1, in this case the penetration level of the converter source is fixed to 100%, while the delay of the fault detection is artificially arranged as 1ms, 5ms, 10ms and 15ms. Solid three phase faults were applied at 70% distance of the line length and the generated waveforms were injected into relays with results recorded in Fig.5.
Fig.5: Relay tripping time with different converter initiation delay
It is clear that the performance of the relay model is significantly affected by the change of the converter‟s response time (the tripping is up to 40ms slower). Meanwhile the performance of the hardware relay is not seriously affected, but still the tripping time is steadily increased (within 5ms difference). Conclusions can be made that the converter‟s response time may have significant influence on certain types of distance relays. Further studies with more samples should be performed in order to verify the conclusion.
4.3 Case study 3: impact of varying converter output current increase ramp rate
In this case the penetration level of the converter source is fixed to be 100%, while the ramp rate of the fault current is
arranged as 25.2A/ms, 33.6A/ms, 42A/ms and 50.4A/ms. Identical solid three phase faults were applied at the transmission line and the generated waveforms were injected into the relays with results recorded in Fig.6.
Fig.6: Relay tripping time with different converter output ramp rate
It can be seen the performance of both relays is not affected when the current ramp rate is changed. Therefore conclusion can be made that the impact of varying the converter‟s output current ramp rate is small within a certain range. Further tests shall be done to check whether the statement still apply when the converter‟s ramp rate is tested in a bigger range, and when the applied faults are approaching zone boundaries.
4.4 Case study 4: impact of varying converter output fault current level
In this case the penetration level of the converter source is fixed to be 100%, while its fault level is arranged as 2.562GVA, 2.096GVA, 1.630GVA and 1.281GVA. Identical solid three phase faults were applied at the transmission line and the generated waveforms were injected into relays. The results are presented in Fig.7.
[image:5.595.315.541.141.290.2] [image:5.595.54.280.381.528.2] [image:5.595.315.541.540.698.2]For the hardware relay the tripping time is not much affected when the fault level is changed. The same is true for the modelled relay except when the fault level is decreased to 1.281 GVA when the tripping time of the relay is delayed by 10ms. Therefore, it can be concluded that the change of the converter‟s fault level may have little impact on the relay‟s performance. Again further studies shall be performed to verify the statement with wider range of fault levels and different types of protection relays.
5.
Conclusions and Future work
This paper has presented a comprehensive set of tests of protection performance by injecting simulated data into actual relay using voltage and current injection. The data was also tested by a validated dynamic software model of a distance relay for comparison.
Since there is no universally defined „correct response‟ for converter sources under fault, it is therefore necessary to investigate the consequence of different converter settings for traditional power system protection schemes. In this paper a converter model capable of outputting controllable fault current was introduced. By vary the setting of the model, different types of fault response (with different maximum outputting current, different current ramp rate and different initial delay) were generated. Together with a simplified line model based on data from National Grid, simulations were performed to check how the voltage and current measured by the relay impact the relay‟s performance when a certain three phase fault was applied at the transmission line which is dominated by different types of converters.
The results confirmed the concerns related to protection system performance that might be caused by the increased utilization of converter interfaced generations. Under certain circumstances the protection operating time may not always be acceptable. However, different types of relays may suffer from different level of challenges since their protection algorithm vary.
Future works need to be performed to investigate protection performance with: different fault resistance; different fault types (single phase, phase to phase); different fault locations (especially around zone boundaries); different types of relays (unit, non-unit protections). Within each case the impact of changing response of the converter shall be performed in order to check what kind of converter response is mostly „beneficial‟ or „harmful‟.
References
[1] A. Dysko, J. R. McDonald, G. M. Burt, J. Goody, and B. Gwyn, “Integrated Modelling Environment: a platform for dynamic protection modelling and advanced functionality,” 1999 IEEE Transmission and Distribution Conference, 1999, vol. 1, pp. 406–411 vol.1.
[2] “Electricity Ten Year Statement 2014.” National Grid,
2014. Available at:
http://www2.nationalgrid.com/UK/Industry- information/Future-of-Energy/Electricity-Ten-Year-Statement/
[3] H. Urdal, R. Ierna, J. Zhu, C. Ivanov, A. Dahresobh, and D. Rostom, “System strength considerations in a converter dominated power system,” IET Renew. Power Gener., vol. 9, no. 1, pp. 10–17, 2015.
[4] J. Fortmann, R. Pfeiffer, E. Haesen, F. van Hulle, F. Martin, H. Urdal, and S. Wachtel, “Fault-ride-through requirements for wind power plants in the ENTSO-E network code on requirements for generators,” IET Renew. Power Gener., vol. 9, no. 1, pp. 18–24, 2015. [5] K. I. Jennett, C. D. Booth, F. Coffele, and A. J. Roscoe,
“Investigation of the sympathetic tripping problem in power systems with large penetrations of distributed generation,” IET Generation, Transmission Distribution,
vol. 9, no. 4, pp. 379–385, 2015.
[6] K. J and K. B, “Understanding Fault Characteristics of Inverter-Based Distributed Energy Resources,” National Renewable Energy Laboratory (NREL), NREL/TP-550-46698, 2010.
[7] “Network Code on HVDC Connections,” ENTSO-E,
30-Apr-2014. Available at:
https://www.entsoe.eu/Documents/Network%20codes%
20documents/NC%20HVDC/140430-NC%20HVDC.pdf
[8] “Network Code on Requirements for Grid Connection applicable to all Generators.” ENTSO-E, Mar-2013. Available at: http://networkcodes.entsoe.eu/wp-content/uploads/2013/08/130308_Final_Version_NC_Rf G1.pdf
[9] R. Li, C. D. Booth, A. Dysko, A. J. Roscoe, and J. Zhu, “Development of models to study VSC response to AC system faults and the potential impact on network protection,” 49th International Universities Power Engineering Conference, 2014, pp. 1–6.
[10] “System Operability Framework 2014.” National Grid,
2014. Available at:
http://www2.nationalgrid.com/UK/Industry- information/Future-of-Energy/System-Operability-Framework/
[11] “The Grid Code.” National Grid, 31-Mar-2014.
Available at:
http://www2.nationalgrid.com/UK/Industry-information/Electricity-codes/Grid-Code/
[12] “UK Future Energy Scenarios 2014.” National Grid,
2014. Available at: