City, University of London Institutional Repository
Citation: Purves, R., Edwardes, A. and Wood, J. (2011). Describing place through user
generated content. First Monday, 16(9),
This is the unspecified version of the paper.
This version of the publication may differ from the final published
version.
Permanent repository link: http://openaccess.city.ac.uk/535/
Link to published version:
Copyright and reuse: City Research Online aims to make research
outputs of City, University of London available to a wider audience.
Copyright and Moral Rights remain with the author(s) and/or copyright
holders. URLs from City Research Online may be freely distributed and
linked to.
City Research Online:
http://openaccess.city.ac.uk/
[email protected]
First Monday, Volume 16, Number 9 - 5 September 2011
HOME ABOUT LOG IN REGISTER SEARCH CURRENT ARCHIVES SUBMISSIONS
Home > Volume 16, Number 9 - 5 September 2011 > Purves
Geographically referenced user generated content provides us with an opportunity to, for the first time, gather perspectives on place over large areas by exploring how very many people describe information. We present a framework for analysing large collections of user generated content. This involves classification of descriptive terms attached by users to photographs into facets of elements, qualities, and activities. We apply this framework to two contrasting photographic archives — Flickr and Geograph, representing weakly and strongly moderated content respectively. We propose a method for removing user–generated bias from such collections though the user of term profiles that can assess the effect of the most and least prolific contributors to a collection. Analysis and visualization of co–occurrence between terms suggests clear differences in the description of place between the two collections, both in terms of the facets used and their geographical footprints. This is attributed to the role of
moderation/editorialising of content; to the role tags and free–text have on descriptive behaviour and to the geographic footprint of content supplied by the two collections.
Contents
Introduction Related work Data description Extracting terms
Detecting and removing bias Comparing Flickr and Geograph Concluding discussion
Introduction
Traditional spatial data are thought of by most people as taking the form of “maps” in the context of the Web, with archetypal examples being Web mapping services such as those provided by Google, Bing or Yahoo. Underlying these mapping services are topographic data which consist of geometry describing where an object is found, and attributes describing the properties of the object. Examples of such data include road or river networks, gazetteers listing place names, boundaries of objects such as lakes, forests and administrative regions and contours describing the shape of the Earth’s surface. Increasingly ubiquitous in Web mapping is user generated content (UGC), for example, in the form of markers indicating business locations and associated reviews, georeferenced images illustrating how an area looks, or other content uploaded by individuals such as classified adverts.
Traditional spatial data, are typically collected by a mapping organisation or local authority, with a particular purpose in mind, and using strict standards to ensure that the data have sufficient geometric and semantic accuracy for their purpose. Thus, these data reflect a single, typically institutional way of describing a location using a relatively formalised set of semantics and, typically, precise georeferencing. The methods have major advantages, since they allow whole countries to be described in a consistent manner, but they also suffer from significant disadvantages, particularly if we are interested in more subjective or contested descriptions of locations.
Information Science has made less significant advances. As Fisher and Unwin (2005) eloquently state, “Geographic Information theory articulates the idea of absolute Euclidean spaces quite well, but the socially–produced and continuously changing notion of place has to date proved elusive to digital description except, perhaps, through photography and film.” [1] User Generated Content (UGC) provides us with a potential window onto these notions of place, and in this paper we set out to explore not the geometric accuracy or precision of UGC, but rather the potential of UGC to capture descriptions of place.
Developing such descriptions of place falls broadly within the research area of naïve geography, described in Egenhofer and Mark’s seminal paper (1995), as “the body of knowledge that people have about the surrounding geographic world”. The importance of such research has gained increasing prominence, as people have come to rely on textual search to identify not only documents, but images and even geographically relevant materials. Indeed, in image search the gap between the capabilities of content–based image retrieval, which mainly functions on primitive features such as colour or texture and user needs, typically met using text search to formulate higher level semantics cognitively derived from such primitive features has been termed the semantic gap (Smeulders, et al., 2000). Identifying textual terms that relate to higher level semantic concepts such as valley or train from groups of user–generated tags and relating them to primitive features in images is one potential way of addressing this semantic gap.
In this paper, we focus on exploring the nature of terms used to describe images in two contrasting datasets, Geograph and Flickr, both of which contain georeferenced photographs, associated with unique users and some form of textual description. However, the motivation behind uploading content, the forms of description of images and the degree of external control of content varies for these two collections. Thus, we can explore not only how images are described in UGC, but contrast the nature of the descriptions in two datasets and explore which aspects of place are captured. In particular we assume that the behaviour of individuals in uploading content may vary, and that given the well known Participation Inequality Rule coined by Nielson (2006) that a small number of individuals may dominate (and thus bias)
contributions to these collections.
The research in this paper thus aims to address three broad questions:
1. Can we develop a framework for gathering descriptions of place captured in images, grounded in previous work and sufficiently tractable so as to be achievable even with very large collections?
2. Does bias, in the form of participation inequality, influence the analysis of such collections, and how can such bias be measured, and where necessary, dealt with? 3. Can we identify differences in descriptions of place in two UGC collections from the British
Isles, and what are the implications of these differences for research using UGC to explore and exploit notions of naïve geography?
Related work
Within GIScience Volunteered Geographic Information (VGI) has received much attention since Goodchild’s original papers (Goodchild, 2007). However, the work in this paper concentrates on collections which, though considered by some to be VGI, are also often termed User Generated Content (UGC) by the broader research community. Whilst the distinction in terms of naming is perhaps unimportant, we believe the distinction in terms of purpose is crucial. In our research we are interested in data provided by users for whom geography may or may not play a central role, and who upload data not as necessarily volunteers, but certainly with the intention of being found (whether by themselves in the future or others) (Mathes, 2004; Ames and Naaman, 2007).
The crucial requirement for our work is that the collections are not only explicitly georeferenced, but that some form of descriptions are related to the images. Numerous papers have
investigated how Flickr content is categorised. For example, Sigurbjörnsson and van Zwol (2008) found that the most commonly assigned tags refer to locations, typically through place names. Hollenstein and Purves (2010) showed this to hold true even where tags were
georeferenced (where one might expect that the explicit coordinates assigned negated the need to also index using place names). Rorissa (2010) compared tags assigned by Flickr users with indexing terms assigned by professionals, and suggested that Flickr tags are “richer in their semantic content than index terms, which are at times devoid of context”. This richness is in turn reflected in greater numbers of unique tags, and Rorissa, in common with many others suggests that more knowledge of the structure of tags may help to develop more appropriate indexing tools.
Tversky and Hemenway (1983) showed how basic level categories such as mountain or beach
categorisation of terms describing images, with Shatford (1986) proposing the Panofsky– Shatford facet matrix composed of three levels Specific Of, Generic Of and, About and four facets Who, What, Where and When. This facet matrix has been extensively used to explore how images are described and queries formulated and suggests a useful means of classifying terms assigned to images. In describing place related terms, we are particularly interested in terms related to the ‘where’ facet. Much research has been carried out to explore what appropriate toponyms (that is to say the Specific Of/Where) for image indexing and query are (e.g., Naaman, et al., 2006; Grothe and Schaab, 2009; Keßler, et al., 2009; Popescu, et al., 2009; Smart, et al., 2010) but relatively little work has explored the Generic Of/Where or the
About/Where, especially in terms of descriptions of place. Basic level theory suggests that terms
belonging to the Generic Of/Where category should be more useful in both indexing and searching images, and thus provides impetus for exploring how such terms are used in UGC. In earlier work we explored the possibilities of using Geograph as a proxy for empirical experiments identifying basic levels (Edwardes and Purves, 2007) and showed that there was broad
agreement between ordering of terms identified in previous empirical work and those found in UGC. We also explored co–occurrence patterns in Geograph of what we termed scene types, which correspond broadly to the basic level categories investigated by Tversky and Hemenway (1983), for example through the application of spatial tree maps (Purves, et al., 2008; Dykes and Wood, 2009).
Although numerous papers have explored Flickr tags (e.g., Rorissa, 2010) and the spatial distribution of images (e.g., Ahern, et al., 2007; Sigurbjörnsson and van Zwol, 2008; Crandall,
et al., 2009; Antoniou, et al. (2010) to our knowledge most authors, including our own previous
research have assumed that the volume of UGC generated is so great that individual contributors are unlikely to bias either the terms used to describe images or the spatial distribution identified. However, in recent work (Hollenstein and Purves, 2010) on the use of Flickr to define vernacular regions we found that for some tags (e.g., Inner City in London) this was not the case, and our attempts to delineate this area in fact only represented the perspective of a single individual. We are unaware of the development of methods to explore bias in the semantics of Flickr tags, and thus their potential spatial distribution, other than the methods developed for this work and applied in Hollenstein and Purves (2010).
It is thus clear that descriptions assigned to UGC in general may provide new ways to index and thus search data (Rorissa, 2010), providing tools which more closely match user expectations. Research on image classification suggests both a need for methods to identify terms which may match such expectations in the form of the Generic/Of facet, and that such terms may closely match basic levels and thus, where they are geographic, provide a reflection of naïve
geographies. Finally, bias has received little attention, but has the potential to modify both
spatial and semantic characteristics derived from UGC, and thus we propose methods to explore such bias.
Data description
In this research we contrast descriptions of places originating from two different online communities; Geograph (http://www.geograph.org.uk) and Flickr (http://www.flickr.com). In each case, the communities are centred on Web sites that invite photographic contributions. In addition to an image, various forms of semantically cogent information can also be submitted. For this research the information that was pertinent, and necessary, was the contributor of the image (this needs to be unique, but not necessarily identify an individual), its spatial location and the textual information associated with an image by the contributor.
Whilst these general categories of information afford comparisons to be made between the contents of the two collections, there are fundamental differences between them terms of content and the methods by which they are collected and, the nature of the communities providing the information. They represent two important categories of UGC, namely strongly moderated/editorialised collections (Geograph) and weakly moderated general collections (Flickr). They also represent two contrasting formats of image annotation, namely the use of an unrestricted vocabulary of tags (Flickr) and full text image description (Geograph).
The Geograph project aims to collect “geographically representative photographs and information for every square kilometre of the U.K. and the Republic of Ireland.” Hence, a contribution tries to document some aspect of the geography of a grid cell, with contributions being moderated to ensure that they align with these objectives. The community of Geograph might be therefore described as geography enthusiasts. Descriptions of places, both image and text, tend to emphasise a form of geography that highlights more objective and physical characteristics. Whilst the motivations for contributing are likely to vary greatly, we suspect that they relate to people’s attachment to local places, though amongst the more prolific
or appearing as selected ‘interesting’ content. To achieve this contributors may modify the content they submit, for example attempt to make tags describing their image more salient. These differences may be important in so far as Geograph has an explicit aim to describe geography, and so implicitly gather information representing the description of place. However, since it is moderated, there may also be a tendency to seek a common vocabulary and to aim towards agreed, rather than individualistic descriptions. By contrast, Flickr images are tagged with multiple motivations. In their taxonomy Ames and Naaman (2007) identified a range of motivations for both organising and communicating information to the community as a whole, and importantly the user. This latter element means that tags may have a very personal meaning for an individual in searching his or her collection. The data described in this paper were collected in 2008. This has a further important implication, since geotagging at this point was not routine, and authors had to either explicitly locate images on a map or geotag using an external GPS. The advent of devices such as smart phones, which automate geotagging, implies that all images, rather than only those that an individual somehow associated with a location are now routinely geotagged.
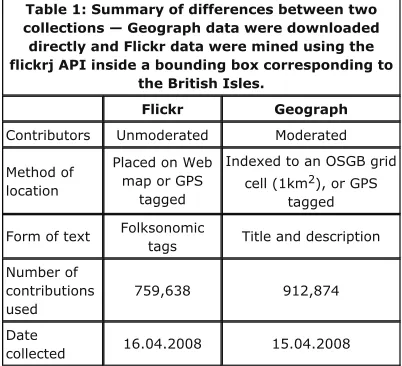
Table 1: Summary of differences between two collections — Geograph data were downloaded directly and Flickr data were mined using the flickrj API inside a bounding box corresponding to
the British Isles.
Flickr Geograph
Contributors Unmoderated Moderated Method of
location
Placed on Web map or GPS
tagged
Indexed to an OSGB grid cell (1km2), or GPS
tagged Form of text Folksonomic
tags Title and description Number of
contributions used
759,638 912,874 Date
collected 16.04.2008 15.04.2008
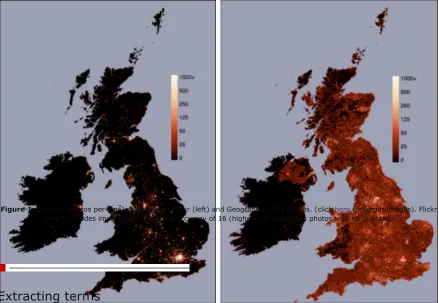
Figure 1: Density (photos per km2) of all tagged Flickr (left) and Geograph (right) photos. (click here for larger images). Flickr
sample includes images with locational accuracy of 16 (highest) and excludes photos with no user tags.
Extracting terms
In order to explore the semantics and geography of place related terms in the descriptions of Flickr and Geograph images we undertook an analysis of the nature of the most frequent terms used in each collection. Previous research has suggested that parts of speech are a useful starting point for analysis of geographic descriptions, with Kuhn (2001) suggesting that verbal phrases are often related to the affordances of environments, and Craik (1972) identifying adjectives used to describe landscapes. Based on these notions, we performed an initial analysis identifying nouns, verbs and adjectives. Nouns were further subdivided into nouns, proper nouns which were not toponyms and toponyms. Finally, terms which could not be assigned to one of these headings were simply classified as “other”. This analysis was performed for the top 1,000 ranked terms in Geograph and Flickr by all three authors, and a simple majority voting scheme used to classify terms. Table 2 shows the final classification.
Table 2: Occurrence of different parts of speech in Geograph and Flickr.
Source Nouns Proper
nouns Toponyms Verbs Adjectives Other Example
terms
farm, hill
Monday, Nikon
Edinburgh, London
running,
fishing green, high slowly, incredibly
Geograph 462 24 38 170 167 202
Flickr 428 147 237 36 112 68
Several differences are very obvious. Verbs are very rarely used in Flickr (only 3.6 percent of terms) and toponyms and proper nouns occur much more commonly than in Geograph (23 percent vs. 4 percent and 14 percent vs. 2 percent). The nature of the collections and their spatial distributions (Figure 1) goes a long way to explaining this. The most common term in Flickr is, in fact, London, and as has been demonstrated in other work (e.g., Hollenstein and Purves, 2010) toponyms are very important tags in Flickr.
Since, this initial analysis suggested that parts of speech were not well suited to identifying different facets of place description, as nouns dominated both classifications, especially Flickr, we carried out a second analysis based around three place–related facets derived from those suggested by Tversky and Hemenway (1983), which we had successfully used in previous research, elements, qualities and activities (Edwardes and Purves, 2007). Elements and activities were defined as terms which suggested objects (including people) which could, in general, be identified in an image. If terms such as cyclist were present, then we considered this to be both an element and an activity. Qualities were terms which we considered to modify elements or suggest feelings or moods in some way. Since Table 2 demonstrates that Flickr tags in particular are dominated by nouns, we considered tags which could be modified into
adjectives (e.g., snow ! snowy) to be qualities.
[image:6.595.110.373.480.575.2]disagreements amongst the annotators. It was possible for terms to be members of more than one facet — for example to be classified as both elements and activities. Table 3 shows how often facets occurred in the two collections, together with the frequency of shared terms. The most evident differences are in the relatively rare occurrence of activities in Geograph as opposed to Flickr (27 vs. 107) and the less common occurrence of qualities in Flickr (161 vs. 226). The small number of activities in Geograph demonstrates that verbs were not, at least in this collection, a good route to such terms, as Geograph has many more verbs than Flickr (Table 2).
Table 3: Occurrence of elements, activities and qualities in Geograph and Flickr and counts of
shared and unique terms.
Flickr Geograph Shared Unique
Elements 313 348 144 515
Activities 107 27 14 120
Qualities 161 226 68 319
Detecting and removing bias
Figure 2: Contributor behaviour for Geograph and Flickr.
In order to explore in more detail the influence of bias as a function of posting frequency on our collections, we constructed a series of term profiles that show how frequently a given term is used by posters of varying levels of activity. Figure 3 shows examples of profiles for three terms found in the Flickr and Geograph collections respectively. In each case, the height of the grey bars represents the proportion of all photos with the given tag, binned into groups of 10,000. These are ordered from those photos produced by the most prolific contributors on the left to the least prolific on the right. Since the most prolific poster uploaded more than 50,000 images, the first five columns represent only content from this single user. Furthermore, more than 60,000 users uploaded a single image, thus the rightmost six columns represents this large collection of first–time users.
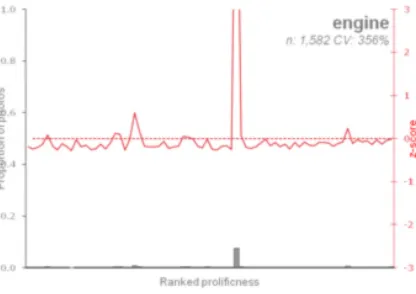
Figure 3: Term profiles for selected images: countryside, church and sky from Flickr; road, hill and engine from Geograph.
The first Flickr profile clearly demonstrates the effects of bias — countryside has a very high frequency, but almost all occurrences occur to the left of the tag profile, and it has a very high coefficient of variation (550 percent). Church, by contrast, has a low coefficient of variation (60 percent) and it is clear by looking at the z–score that it is more or less equally used as a term by all contributors (except the most prolific contributor on the left hand side). Finally, sky also has a low coefficient of variation (76 percent) but shows some slight bias, as an increasing trend in use from left to right, indicating that this term may be used more by contributors describing smaller numbers of images. The first two Geograph profiles, for road (34 percent) and hill (54 percent) both have low coefficients of variation, and there is no evidence of bias. Indeed, perhaps as a result of Geograph’s moderated nature, and since sentences and not tags are used in description, we did not find very frequent terms with high coefficients of variation, despite the tendency for small numbers of contributors to provide much of the content. The profile for
engine is an example with a high coefficient of variation (356 percent), but here the contributor
lies more or less in the middle of the distribution. This suggests a particular type of behaviour, for example a steam engine enthusiast, capturing and annotating many similar themed images. However, this type of behaviour is unlikely to cause significant bias, since the contributors of this type of image are not in themselves particularly prolific.
Our analysis suggests that there are several sources of bias created by the particular image description styles of groups of contributors to both collections. Figure 2 suggested that there were two populations of contributors to Flickr and Geograph; those who contributed only one (geotagged) photo, and those who contributed more than one. Because of the possibility that the single–photo contributors were simply testing the system, or that they have a consistent tagging behaviour that may be different from the norm, we have chosen to eliminate all photos produced by single–posters from the sample. This is supported by profiles of terms such as sky (see Figure 2), where collectively, these single–posters can show different tagging behaviour to those of the wider population of contributors.
The more significant source of bias is that produced by the most prolific posters. Figure 2 demonstrates that in both collections, a significant proportion of the collection is contributed by a very small number of people. Since we are aiming to describe tagging behaviour in general, and not necessarily that of a small number of prolific posters, we have chosen to eliminate high posters from the sample. The cutoff was determined by analysing the tag profiles in Figure 3
and cumulative histogram in Figure 2. The first 12 bars (120,000 photos contributed by 25 people) show the most systematic bias in the Flickr collection, so photos from these contributors were removed. While there is no such systematic bias in the Geograph collection, the dominance of only 12 posters (contributing 120,000 photos), suggests that any later co–occurrence analysis is in danger of describing their specific behaviour rather than that of contributors in general. This is especially the case if these contributors use a formulaic approach to photo description; something that is likely given the large number of contributions. Therefore the 120,000 photos submitted by the top 12 Geograph posters were also removed from the sample.
filtering. The second is that the terms themselves are reranked, with for example water and sky, with their lower coefficients of variation, being promoted from fifth and seventh places in the unfiltered list to fifth and fourth (and swapping in order) in the filtered list. Note also that, due to the difficulty in assigning a definitive meaning to some terms, that a few (e.g., rock and city) are classified in more than one facet list.
Table 4: Elements, activities and qualities identified in Flickr before and after filtering for bias. Terms shaded in grey are changes in terms between the filtered and unfiltered lists.
Elements Activities Qualities
Unfiltered Filtered Unfiltered Filtered Unfiltered Filtered
Rank Term Freq. Co.
Var. Term Freq. Term Freq. Co.
Var. Term Freq. Term Freq. Co.
Var. Term Freq.
1 city 13338 161 church 12552 music 29463 231 party 15574 architecture 15299 91 architecture 14489 2 church 13237 60 city 11143 party 19275 128 music 15351 landscape 15259 375 night 13550 3 park 12594 116 sky 11099 gig 15680 140 gig 12194 night 14577 57 city 11143 4 friends 12506 352 water 10213 birthday 12863 142 wedding 11049 city 13338 161 art 8445 5 water 11827 73 river 10068 wedding 11970 112 birthday 9213 countryside 9815 549 blue 7408 6 pub 11624 245 building 9696 christmas 10268 107 travel 9134 country 9472 571 light 7268 7 sky 11453 76 park 9152 travel 9235 141 christmas 8340 rural 9254 585 red 6912 8 river 10771 63 street 9004 concert 8569 116 concert 8223 nature 8330 288 sunset 6736 9 building 10253 92 people 8543 rock 8412 348 holiday 8005 urban 8745 221 urban 6718 10 band 9715 232 garden 8156 holiday 8142 176 festival 6225 art 8729 73 winter 6447 11 people 9657 87 bridge 8129 festival 7075 95 football 5582 wild 8498 592 green 6377 12 street 9294 81 museum 8119 football 5720 179 vacation 5127 blue 7823 80 nature 6114 13 garden 8559 84 pub 8096 vacation 5142 177 livemusic 4407 red 7718 63 clouds 5851 14 bridge 8545 57 castle 7691 gigs 4979 522 rock 4368 light 7567 114 summer 5742 15 rock 8412 348 cathedral 7201 club 4975 198 club 4114 green 7214 86 snow 5529 16 museum 8352 113 graffiti 6954 show 4683 209 work 3804 summer 7031 131 landscape 4877 17 hill 8272 452 friends 6764 livemusic 4408 259 cycling 3653 sunset 6934 61 reflection 4797 18 castle 7950 78 trees 6705 work 4381 202 trip 3640 winter 6800 103 white 4743 19 cathedral 7576 115 beach 6685 drinking 4069 505 sport 3519 clouds 6024 79 spring 4121 20 beach 7210 79 band 6427 rugby 4039 299 show 3058 snow 5718 68 autumn 4976
Comparing Flickr and Geograph
Having developed methods to extract terms from the two collections, and to deal with bias introduced by both prolific posters and “one time” posters, we now wish to look at how contributors to Geograph and Flickr describe their images, and compare how these two sets of user generated content might be used to explore conceptualisations of place. Table 5 shows the first 10 terms for both collections and all three facets (note that the top 10 terms for Flickr correspond with the top 10 filtered terms in Table 4 above).
Table 5: Ten most common elements, qualities and activities for Geograph and Flickr after filtering.
Geograph Flickr
Elements Qualities Activities Elements Qualities Activities
road old walk church architecture party farm new grazing city night music lane built running sky city gig church centre golf water art wedding bridge square work river blue birthday hill small cycle building light travel river water fishing park red christmas house wood construction street sunset concert
[image:10.595.119.365.624.778.2]street main walking garden winter festival
A few points are worthy of note in examining these terms. Firstly, the Geograph elements appear to contain more of a mix of between rural (e.g., farm, hill, wood, grazing) and urban
(e.g., park, construction, building) terms than Flickr. Secondly, the qualities in Geograph tend to
take the form of adjectives, whilst in Flickr these are more often nouns (as suggested by the preliminary experiment described above in Table 2). In turn, the Geograph qualities are more likely to actually describe a property of an element, rather than a property of an image, which seems to be typical of Flickr. Thus, Geograph includes high–ranked qualities such as old, new
and small, whilst Flickr qualities are more self–standing (e.g., architecture, art and light).
[image:11.595.88.579.413.668.2]Finally, the activities in Geograph appear to be much more closely related to affordances of an environment (e.g., grazing, golf, fishing) whilst those in Flickr tend to be events of some kind. It is, however, important to be aware that here we are only looking at the 10 most frequent terms in each facet (Note all terms are available here at http://www.gicentre.org/firstMonday). In a second comparison, we looked at the overlap between terms in each facet for Geograph and Flickr. Table 3 shows the count of shared terms, with 28 percent of 515 unique elements being shared between Flickr and Geograph, 12 percent of 120 unique activities and 21 percent of 309 unique qualities. These comparisons demonstrate that, Flickr and Geograph users appear to describe images using different facets (for example activities are rare in Geograph) and with differing vocabularies. In order to explore these differences in more detail, we looked at co– occurrences between terms. In a first, global analysis, histograms were generated showing how often terms from each facet co–occurred with one another (Figure 4). Here, for each facet the number of terms with which it co–occurred in every facet was counted. Thus, for example, in Geograph almost all elements are found to co–occur at least once with every other element, whilst qualities are much less likely to be universal (only some 5 percent of qualities co–occur with all elements). In general, Geograph appears to be a less specific dataset, with terms commonly co–occurring with others, especially in the case of elements and activities (though note the low overall numbers of activities). By contrast, Flickr appears to be more specific with, for example, only around 10 percent of elements co–occurring with all other elements. One obvious reason for these differences is likely to relate to the differing natures of the content descriptions. Geograph is based around moderated free text where authors explicitly aim to describe the content of images, while our Flickr analysis is based only on tags. Thus, in general, Geograph descriptions will tend to be longer, and seek to emphasise particular features — these descriptions are thus more likely to contain co–occurring terms. In turn, this implies, at least in a global sense that Flickr tags aim to describe different, complementary aspects of an image.
Figure 4: Co–occurrence histograms for element, quality and activity facets of Geograph (left) and Flickr (right). The y–axis of the histogram indicates the percentage of terms in a facet which co–occur at least once with a term belonging to the facets indicated in quantiles on the x–axis. Thus, around 90
percent of elements co–occur at least once with 80–100 percent of elements in Geograph (Note difference in vertical scales).
while the colours indicate where the co–occurrence occurred. Finally, the rectangles themselves are arranged so that their geographic centroids are as close to their real position as possible. By observing a spatial treemap based on random sample of all images, we can see that small, new
and built all appear to have similar spatial distributions to the overall image distribution.
[image:12.595.80.575.132.367.2]However, high appears to co–occur less with churches in the north and east of Scotland (coloured in blue) than old and old is in general more associated with northerly locations than for example square.
Figure 5: Colour legend mapping locations of spatial treemap cells, example spatial treemap showing co–occurrence of top 10 qualities with the element church, and spatial treemap showing random 10 percent of images, all for Geograph (click here for larger image).
Geograph: Qualities/Elements Flickr: Qualities/Elements
Figure 6: Co–occurrence of top 10 qualities with top 10 elements for Geograph and Flickr (note terms that occur in both facets are excluded) Click here for larger images and all facet co–occurrence relationships).
A number of features are visible in Figure 6, where the top level of the hierarchy characterises qualities and the second elements. Perhaps most striking are the solid blocks of colour in the Flickr treemaps, indicating the expected (c.f., Figure 1) spatial concentration of some terms, which simply reflects the overall distribution of terms. However, subtle differences are also visible. For example, winter and light, which both appear to be more northerly terms co–occur with elements which are more associated with regions to the north and west (pinks, purples and blues). Flickr elements in general appear to have much less regular distributions, with, for example, building dominating architecture and city dominating urban. Although these associations are not in themselves surprising, Geograph shows a much more even spread of elements co–occurring with qualities. Thus, although road is certainly the most common element found in conjunction with main, river, hill, bridge, church, farm, house and land all appear to be used roughly equally often with this element. In general, Geograph displays less solid blocks of colour, once again mirroring its original distribution. Nonetheless, differences are visible, for example the element lane is rarely found in the north in conjunction with either of the qualities
square or new.
Concluding discussion
This work aimed to answer three broad research questions. Firstly it provides a framework for gathering descriptions of place in large collections of User Generated Content. Using APIs to retrieve photographic descriptions, both tagged and free–text can be extracted and attached to individual contributors. We found that categorization of terms into verbs, nouns and adjectives (which could be partially automated) was not sufficient to provide a rich discrimination between places. In particular the dominance of nouns in both tagged and free–text descriptions limits this use of form of categorization. The classification into place–related facets (Tversky and
Hemenway, 1983) provided a much richer basis for analysis and discrimination. The ambiguity of many terms in this classification required a moderation process where independent classifications by several researchers were combined using majority votes. The complex spatial and co–occurrence relationship between terms lends itself to a visualization–based approach in exploring descriptions of place (e.g., small multiples of co–occurrence histograms and spatial treemaps of co–occurrence).
Our second research question addressed issues of user–generated bias in UGC collections. Our analysis suggests that even within large collections comprising millions of individual items, individuals can still have a significant effect on the characteristics of the collection as a whole. By visualizing term–bias through the use of normalized term frequency graphs and quantifying the effect through the coefficient of variation in z–scores, we were able to identify which terms were most vulnerable to user-generated bias. As a result we were able to justify the filtering of the most and least prolific contributors to the collections. Given the recognized problem of participation inequality, we regard this method of bias identification an important one for anyone conducting analysis of UGC collections.
Finally, we applied the framework and bias–detection methods to understand how descriptions of place may vary in two contrasting environments for sharing spatially referenced photographs. By comparing a strongly editorialized collection (Geograph) with a weaker free–form collection (Flickr) we identified both common and contrasting components to place description.
as main and road from those with a geographical footprint such as water and hill. This suggests the approach adopted here may provide insight into not only the way in which we choose to describe place, but also the way in which that description itself varies by location.
About the authors
Ross Purves is a lecturer in GIScience at the University of Zurich, Switzerland. E–mail: ross [dot] purves [at] geo [dot] uzh [dot] ch
Alistair Edwardes works as a geographical analyst for the Department of Communities and Local Government in the U.K.
E–mail: ali [dot] edwardes [at] gmail [dot] com
Jo Wood is a Reader in GIScience at the School of Information Science at City University, London, U.K.
E–mail: jwo [at] soi [dot] city [dot] ac [dot] uk
Acknowledgements
Some of the research reported in this paper was undertaken during the project TRIPOD supported by the European Commission under contract 045335. We would also like to gratefully acknowledge contributors to Geograph British Isles, see
http://www.geograph.org.uk/credits/2008-04-16, whose work is made available under the following Creative Commons Attribution–ShareAlike 2.5 Licence
(http://creativecommons.org/licenses/by-sa/2.5/). The comments of three anonymous referees significantly improved this paper, and we are grateful for their constructive contributions.
Note
1. Fisher and Unwin, 2005, p. 6.
References
S. Ahern, M. Naaman, R. Nair and J.H. Yang, 2007. “World explorer: Visualizing aggregate data from unstructured text in geo–referenced collections,” JCDL ’07: Proceedings of the 2007
Conference on Digital Libraries, pp. 1–10.
V. Antoniou, J. Morley and M. Haklay, 2010. “Web 2.0 geotagged photos: Assessing the spatial dimension of the phenomenon,” Geomatica, volume 64, number 1, pp. 99–110.
M. Ames and M. Naaman, 2007. “Why we tag: Motivations for annotation in mobile and online media,” CHI ’07: Proceedings of the SIGCHI Conference on Human Factors in Computing
Systems, pp. 971–980.
K.H. Craik, 1972. “Appraising the objectivity of landscape dimensions,” In: J.V. Krutilla (editor).
Natural environments: Studies in theoretical and applied analysis. Baltimore: Johns Hopkins
University Press, pp. 292–346.
D.J. Crandall, L. Backstrom, D. Huttenlocher and J. Kleinberg, 2009. “Mapping the world’s photos,” WWW ’09: Proceedings of the 18th International Conference on World Wide Web, pp. 761–770.
J. Dykes and J. Wood, 2009. “The geographic beauty of a photographic archive,” In: T. Segaran and J. Hammerbacher (editors). Beautiful data. Sebastopol, Calif.: O’Reilly, pp. 79–94. A.J. Edwardes and R.S. Purves, 2007. “A theoretical grounding for semantic descriptions of place,” Proceedings of 7th International Symposium on Web and Wireless Geographical
Information Systems (W2GIS), pp. 106–121.
M.W. Egenhofer and D.M. Mark, 1995. “Naive geography,” In: A.U. Frank and W. Kuhn (editors).
Spatial information theory: A theoretical basis for GIS: International conference, COSIT ’95,
Semmering, Austria, September 21–23, 1995: Proceedings. Lecture Notes in Computer Science,
number 988, pp. 1–15.
P. Fisher and D. Unwin, 2005. “Re–presenting geographical information systems,” In: P. Fisher and D. Unwin (editors). Re–presenting GIS. London: Wiley, pp. 1–17.
C. Grothe and J. Schaab, 2009. “An evaluation of kernel density estimation and support vector machines for automated generation of footprints for imprecise regions from geotags,” Spatial
Cognition and Computation, volume 9, number 3, pp. 195–211.
L. Hollenstein and R. Purves, 2010. “Exploring place through user–generated content: Using Flickr tags to describe city cores,” Journal of Spatial Information Science, number 1, pp. 21–48, and at http://www.josis.org/index.php/josis/article/viewArticle/13, accessed 12 August 2011. C. Keßler, P. Maué, J.T. Heuer and T. Bartoschek, 2009. “Bottom–up gazetteers: Learning from the implicit semantics of geotags,” In: K. Janowicz, M. Raubal and S. Levashkin (editors).
Geospatial semantics: GeoS '09: Proceedings of the 3rd International Conference on GeoSpatial
Semantics, Lecture Notes in Computer Science, number 5892, pp. 83–102.
W. Kuhn, 2001. “Ontologies in support of activities in geographical space,” International Journal
of Geographical Information Science, volume 15, number 7, pp. 613–631.
A. Mathes, 2004. “Folksonomies — Cooperative classification and communication through shared metadata,” at
http://www.adammathes.com/academic/computer-mediated-communication/folksonomies.html, accessed 9 September 2010.
M. Naaman, Y.J. Song, A. Paepcke and H. Garcia–Molina, 2006. “Assigning textual names to sets of geographic coordinates,” Computers, Environment and Urban Systems, volume 30, number 4, pp. 418–435.
J. Nielsen, 2006. “Participation inequality: Encouraging more users to contribute,” Alertbox (9 October), at http://www.useit.com/alertbox/participation_inequality.html, accessed 12 August 2011.
A. Popescu, G. Grefenstette and H. Bouamor, 2009. “Mining a multilingual geographical gazetteer from the Web,” Proceedings of the 2009 IEEE/WIC/ACM International Joint Conference
on Web Intelligence and Intelligent Agent Technology, pp. 58–65.
R.S. Purves, A.J. Edwardes and M. Sanderson, 2008. “Describing the where — Improving image annotation and search through geography,” In: G. Csurka (editor). Proceedings of the Workshop
on Metadata Mining for Image Understanding (MMIU 2008). Setúbal, pp. 105–113, and at
http://www.zora.uzh.ch/9344/, accessed 12 August 2011.
A. Rorissa, 2010. “A comparative study of Flickr tags and index terms in a general image collection,” Journal of the American Society for Information Science and Technology, volume 61, number 11, pp. 2,230–2,242.
A. Rorissa, 2008. “User–generated descriptions of individual images versus labels of groups of images: A comparison using basic level theory,” Information Processing & Management, volume 44, number 5, pp. 1,741–1,753.
B. Sigurbjörnsson and R. van Zwol, 2008. “Flickr tag recommendation based on collective knowledge,” WWW ’08: Proceeding of the 17th International Conference on World Wide Web, pp. 327–336, and at http://www2008.org/papers/pdf/p327-sigurbjornssonA.pdf, accessed 12 August 2011.
S. Shatford, 1986. “Analyzing the subject of a picture: A theoretical approach,” Cataloguing and
Classification Quarterly, volume 6, number 3, pp. 39–62.
P.D. Smart, C.B. Jones and F.A. Twaroch, 2010. “Multi–source toponym data integration and mediation for a meta–gazetteer service,” In: S. Fabrikant, T. Reichenbacher, M. Kreveld and C. Schlieder (editors). Geographic information science: Proceedings of 6th International Conference
on GIScience (GIScience 2010). Lecture Notes in Computer Science, number 6292, pp. 234–
248.
A.W.M. Smeulders, M. Worring, S. Santini, A. Gupta and R. Jain, 2000. “Content–based image retrieval at the end of the early years,” IEEE Transactions on Pattern Analysis and Machine
Intelligence, volume 22, number 12, pp. 1,349–1,380.
B. Tversky and K. Hemenway, 1983. “Categories of environmental scenes,” Cognitive
Psychology, volume 15, pp. 121–149.
J. Wood and J. Dykes, 2008. “Spatially ordered treemaps,” IEEE Transactions on Visualization
and Computer Graphics, volume 14, number 6, pp. 1,348–1,355.
Editorial history
Received 27 July 2011; accepted 1 August 2011.
“Describing place through user generated content” is licensed under a Creative Commons Attribution–ShareAlike 3.0 Unported License.
by Ross S. Purves, Alistair J. Edwardes, and Jo Wood.
First Monday, Volume 16, Number 9 - 5 September 2011