Dynamics and pulse-package oscillations in broad-area semiconductor lasers with short optical feedback Appl. Phys. Lett. 101, 231105 (2012); 10.1063/1.4769181
Locking Bandwidth of an OpticallyInjected MultiSection Tunable Laser AIP Conf. Proc. 1288, 59 (2010); 10.1063/1.3521371
Nonlinear optical input–output characteristics of 1.55 μm injection-locked vertical-cavity surface-emitting lasers Appl. Phys. Lett. 84, 3247 (2004); 10.1063/1.1728321
Comprehensive experimental analysis of nonlinear
dynamics in an optically-injected semiconductor laser
Kevin Schires,aAntonio Hurtado, Ian D. Henning, and Michael J. Adams School of Computer Science and Electronic Engineering, University of Essex, Wivenhoe Park, Colchester, CO4 3SQ, United Kingdom
(Received 28 April 2011; accepted 26 July 2011; published online 5 August 2011)
We present the first comprehensive experimental study, to our knowledge, of the routes between nonlinear dynamics induced in a semiconductor laser under external optical injection based on an analysis of time-averaged measurements of the optical and RF spectra and phasors of real-time series of the laser output. The different means of analysis are compared for several types of routes and the benefits of each are discussed in terms of the identification and mapping of the nonlinear dynamics. Finally, the results are presented in a novel audio/video format that describes the evo-lution of the dynamics with the injection parameters.Copyright 2011 Author(s). This article is distributed under a Creative Commons Attribution 3.0 Unported License. [doi:10.1063/1.3625868]
I. INTRODUCTION
It is well known that nonlinear dynamics, in semiconductor lasers can be induced by means of additional influences such as external optical injection, or optical feedback.1Optical injection is of
special interest because it offers the potential for enhancement of modulation bandwidth in injection-locked lasers2as well as a rich variety of nonlinear phenomena including periodic oscillatory output, bistability and chaotic behaviour.3Theoretical studies of the latter effects have made considerable progress (for a comprehensive review, see),4so that comparisons with experimental observations often show excellent agreement. Conventional experimental studies are based on analysis of time-averaged optical and electrical spectra.5–8 Although useful to create a mapping of the nonlinear dynamics, the analysis of the spectra cannot provide a complete picture of their characteristics as it averages the signals in time and eliminates important temporal information.
The direct analysis of real-time traces is therefore necessary to provide a complete picture of the nature of the nonlinear dynamics appearing in an optically-injected laser. The availability of high performance real-time oscilloscopes has thus, in recent years, led to various experimental studies of the time-evolution of nonlinear dynamics in optically-injected lasers. Vallinget al.9–11
proposed the study of time series to analyse an optically-injected solid-state laser providing a comparison of numerical and experimental data. The use of a real-time oscilloscope to capture long time series has been applied to correlation dimension analysis of a semiconductor laser with optical feedback.12Furthermore time series and RF spectra have also been used to study effects of feedback
and modulation.13Besides, experimentally captured real-time series have also been utilised for the analysis of excitability and dynamics in optically-injected quantum-dot planar devices14–16and very recently Kelleheret al.17have contrasted the excitability occurring in a quantum dot and a quantum-well device by means of experimentally captured time series. With the exception of studies such as,14the time series are mainly used for complex processing purposes, the resulting data being then displayed in the plane of the injection parameters. However, means of visualising at once several characteristics of the dynamics under given injection conditions have not yet been explored.
aAuthor to whom correspondence should be addressed. Electronic mail:[email protected].
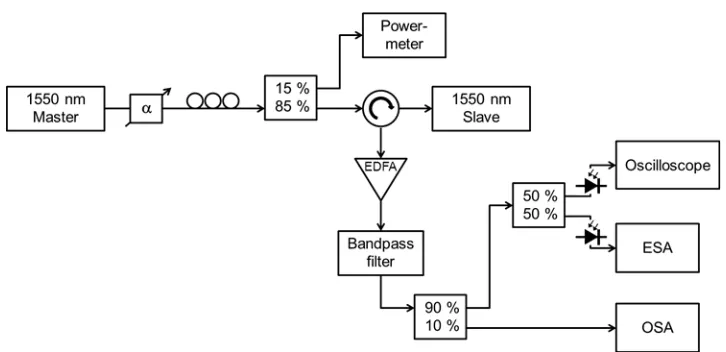
FIG. 1. Experimental setup used for the analysis of optical injection in a semiconductor laser (1550nm-VCSEL). (EDFA: Er-doped fibre amplifier, OSA: optical spectrum analyser, ESA: electrical spectrum analyser).
In the present contribution we present a comprehensive experimental study of an optically-injected semiconductor laser using data from measured time series, in addition to conventional optical and electrical spectra, in order to provide a deeper insight into the evolution and nature of the nonlinear dynamics. To the best of our knowledge this is the first experimental report of the transitional behaviour between regions of different dynamics which is revealed by controlling the injected optical power and frequency. This complements earlier theoretical studies (as summarized in)4 and significantly extends previous experimental work based on using injection of two optical signals to generate various nonlinear effects and enhance chaos.18 In this work the laser under study is a commercial vertical-cavity surface-emitting laser (VCSEL) emitting at the wavelength of 1550 nm. Optically-injected VCSELs are of special interest because of their characteristics: single longitudinal mode behaviour which affords ready comparison between experiment and theory, polarization-dependent dynamics (see, e.g.19 for a review) and the potential for extremely high
modulation bandwidth.20
II. EXPERIMENTAL SETUP
The experimental fibre-based setup is shown in Fig.1. The light from a tuneable laser source (master laser, ML) is injected into the 1550 nm VCSEL (slave laser, SL) through an optical circulator. The spectrum of the SL exhibits two modes separated by 0.48 nm corresponding to the two orthogonal polarisations of the fundamental transverse mode. The polarization of the ML is adjusted to match that of the lasing mode of the SL. Part of the injected power is monitored with an optical power-meter. The light from the SL is amplified using an Erbium-doped fibre amplifier (EDFA) and its amplified spontaneous emission (ASE) is filtered by using a tuneable bandpass filter centred on the SL wavelength.
Three different means of analysing the optical emission from the SL are available. The time-averaged optical and electrical spectra are measured using an Ando AQ6317 optical spectrum analyser (OSA) and a fast photodiode/Agilent E4440A electrical spectrum analyser (ESA), respec-tively. In addition the time series of the induced photocurrent in a second fast photodiode is measured using an Agilent DSA91304A 13 GHz oscilloscope. The two photodiodes were found to have very similar characteristics in terms of their responsivity, bandwidth (which was in excess of 12 GHz) and linearity. In respect of the latter, care was also taken to operate them within their linear range.
At 293 K the SL, which has a threshold current of 1.8 mA, is biased at 2.8 times threshold. At this current the SL has a measured output power PSLof 330μW, a relaxation oscillation frequency
(ROF) of 3.2 GHz and the wavelength of its lasing modeλSLis 1550.98 nm. The frequency detuning
fof the ML from the SL is defined asfML-fSLand the injection strengthKas the injected power
III. EXPERIMENTAL RESULTS
Firstly we present an analysis of the optically injected nonlinear dynamics induced in the SL for four different values of initial detuningfand injection strengthK. The variety of means used for the study of the experimental routes to chaos in a semiconductor laser under optical injection, along with the use of a real-time 13 GHz oscilloscope, make this analysis unique as far as we are aware. Results are shown for four different values off, namely 5 GHz, 2.5 GHz, -4.2 GHz and -6.2 GHz. For each detuning, we first present an overview of the evolution of the dynamics based on the measured optical and electrical spectra over a range ofKin excess of 40 dB. We then analyse the time series of SL intensity at particular values ofKto better reveal the behaviour observed along the routes between different dynamics. Finally, we synthesise the analysis of the different routes in media files providing a novel way of visualising and understanding the evolution of the time series over the range ofKstudied.
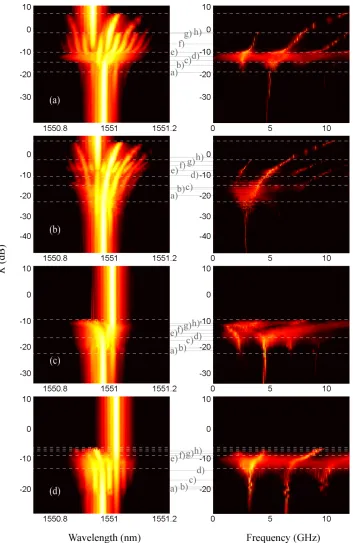
Fig.2depicts the evolution of the optical and electrical spectral distribution asKincreases for each detuning. The diagrams are presented in the form of optical spectral power density (left column) showing how the SL locks to the injected wavelength of the ML whenKexceeds a particular value. This state will be referred to as injection locking (IL). The corresponding maps of the electrical frequency spectrum (right column) representing the relaxation oscillations of the SL intensity reveal the dynamics in the output of the SL and also allow their identification. Three types of dynamics are observed: limit cycle or “Period 1” (P1), period-doubling (P2) and chaos (C). P1 corresponds to a periodic oscillation of the output of the SL at a single frequency and occasionally its first harmonic. This is seen in the optical spectrum of the SL as side lobes occurring either side of the lasing mode and whose separation in wavelength corresponds with the frequency of the P1 oscillation. In the electrical spectrum this is seen as narrow peaks at the frequency of oscillation and its harmonics and in the time series for pure P1 as a sine wave. P2 refers to the appearance of the first subharmonic of P1. Here additional side lobes appear in the optical spectrum and narrow peaks appear in the electrical spectrum at frequency values corresponding to half the P1 frequency, and 3/2 times the P1 frequency (half way between P1 and 2*P1). Finally, chaos represents a strong aperiodic behaviour. Here the optical spectrum shows a broadened distribution in wavelength, and the electrical spectrum exhibits a spread of power over a large bandwidth without any significant narrow peaks.
A closer look at the results included in Fig.2reveals the device behaviour as it transits between different dynamics states. As reported in recent studies,21 clear identification of the dynamics
appearing in the SL can be based solely on the analysis of the optical and electrical spectra. Fig.
2(a)shows that whenf =5 GHz, P1 initially appears for weak optical injection and with the wavelength of the SL remaining equal toλSL. Weak P2 appears when the injection strength is
increased to approximatelyK=-18 dB and the wavelength of the SL begins to shift to slightly higher values. Chaos appears whenK=-14 dB and atK=-10.5 dB the SL leaves chaos for a clear P2 leading to P1 atK=-1.5 dB. It then locks forK=7 dB to the wavelength of the ML, 1550.94 nm in this case. It is important to note that the P1 frequency goes from the value of detuningffor weak injection strength to up to 12 GHz before IL is attained. Fig.2(b)(f=2.5 GHz) shows a different route: P1 leads to chaos aroundK=-23 dB. AtK=-14.5 dB chaos is replaced by P1 which is in turn followed by P2 aroundK=-11 dB. P1 reappears atK=-3 dB and IL occurs forK=6 dB. Fig.2(c)(f=-4.2 GHz) shows a transition from P1 to chaos via a weak P2. P1 is followed by P2 aroundK=-23 dB, chaos appears atK=-17 dB and subsequently disappears atK=-9.5 dB as IL occurs. Finally, Fig.2(d)(f=-6.2 GHz) shows that P2 appears for weak injection. Chaos appears atK=-13 dB, and is present untilK=-9 dB, at which point a periodic behaviour with a weak peak visible in the electrical spectrum at a quarter of the P1 frequency is observed. This situation will be referred to as P4 but further investigation is required to determine whether this corresponds to different dynamics or the appearance of relaxation oscillations. Finally P2 appears atK=-7.5 dB followed by P1 atK=-6.5 dB, and then IL atK=-6 dB.
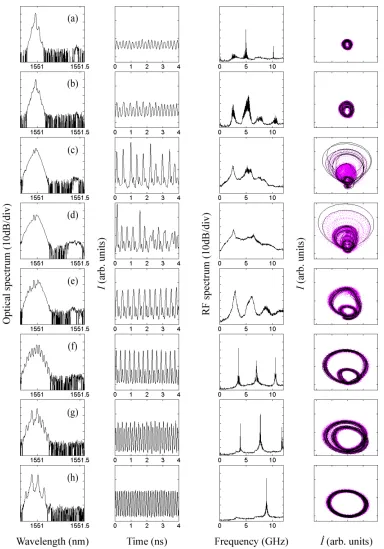
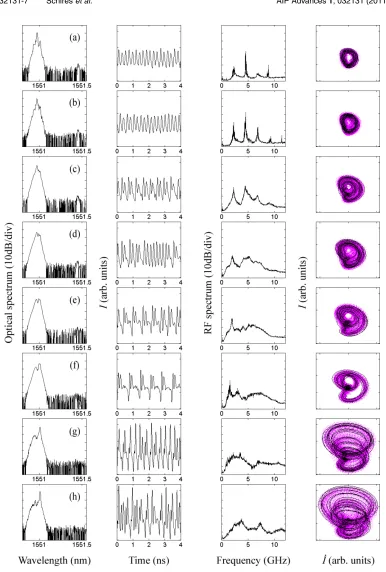
Fig.3 to Fig.6 show the time averaged optical and electrical spectra along with a real-time capture of the laser intensityIover a 4 ns time window and an associated phasor. The values of
intensityIas a function of its time derivative, the latter being computed from the difference between consecutive intensity samples in the experimentally measured time series. Such phasors differ from those of the electromagnetic field reported in,14where the phase of the field is measured in order to
construct a phasor of the field. In most radio-over-fibre applications where an optically-injected laser is used as a microwave oscillator or a source of chaotic signals, only the intensity of the field conveys data as the phase of the field is lost at the opto-electrical interfaces. However, we are not aware of any previous study of experimental real-time series of the intensity of the output of the SL where phasors ofIare used. Yet they allow a representation of the periodic dynamics that neither depends on the frequency of the oscillations nor the length of the time series, since periodic dynamics of a given type will show the same trajectory in the phase plane independently of the duration of their period and the number of periods displayed. The time series were recorded as frames of 100 ns duration which equates to 32,017 intensity sample points. In Figs.3–6, just 4 ns of the time frame has been selected in order to clearly show the temporal details of the dynamics. However in the phase plane, we show the phasors corresponding to the 4 ns frame in black, along with the phasor of the complete 100 ns frame in purple. With this approach we would anticipate a single open circle for pure sinusoidal P1 oscillation which for higher order dynamics would develop into more complex sets of loops, and finally chaotic dynamics would appear as increasingly closed shapes. Finally, it is important to note that the residual noise in the measurement system will ultimately limit the resolution of any weak dynamics in the phase plane.
According to theoretical studies of routes to chaos in optically-injected semiconductor lasers,4
we believe the results reported in this paper correspond to transitions from P1 or P2 to C via the break-up of a torus. From the RF spectra we deduce that the transitions to chaos do not correspond to an increasing number of subharmonics of the P1 oscillation frequency which would be the case for a P2 route to chaos. Instead, a broadening of the spectrum around the P1 or P2 peaks is observed and the dynamics preceding chaos are still discernable in the spectrum and the phasors of near chaotic signals. Although the transitions can be detected and identified with only the RF spectrum, the time series reveal much more information about the actual evolution of the dynamics. In Fig.3(a), the weak P1 appears as a circle in the phase plane that almost closes, as it is limited by measurement noise. The weak P2 in Fig.3(b)is also difficult to identify. In both cases, however, the phasor is confined to a particular area of the phase plane. Fig.3(c)and3(d)show that as chaos develops loops of variable amplitude appear in the phasor which spreads in the phase plane. In Fig.3(c)and3(d), the core of the phasor where the highest density of points are found resembles those seen in Fig.3(b)
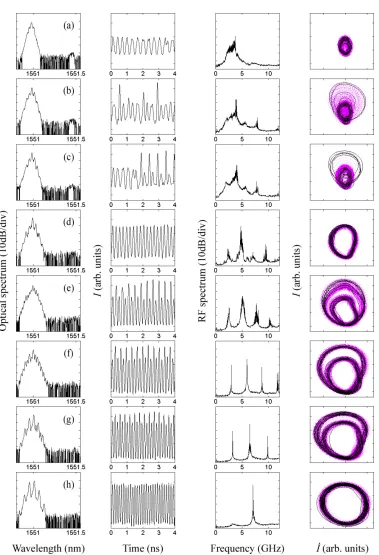
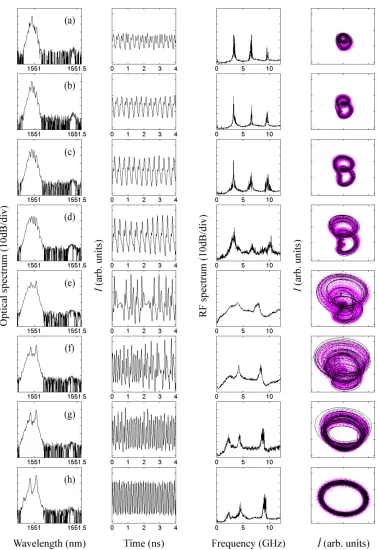
and3(e), respectively. In Fig.3(e), P2 appears and is characterised in the phase plane by two loops of different radii. Fig.3(f)–3(h)reveal how the transition from P2 to P1 occurs, the smallest loop growing in amplitude until both loops merge into a single one. The same kind of transition can be seen in Fig.4(d)–4(h): a second loop appears inside the P1 circle in Fig.4(e)and both loops merge in Fig.4(h). Fig.4(a)reveals that although the RF spectrum of the signal fits into our classification of a chaotic spectrum, the phasor of the time series is limited to a small area of the phase plane and might even tend to an open circle if the signal-to-noise ratio was higher. This behaviour might in fact correspond to the existence of a torus that has not broken up yet, and the transition to chaos might not be achieved at this point.
A different kind of transition from P1 to P2 is presented in Fig.5. A loop appears inside the P1 circle in Fig.5(c). The radius of the outer circle grows as a complex quasi-periodic (QP) or irregular behaviour appears from Fig.5(c)–5(f)until the two circles forming the phasor break into multiple loops in Fig.5(g)as chaos appears. This QP behaviour is characterised by a broad RF spectrum that we attribute to chaotic signals. Finally, Fig.6(a)presents P2 dynamics describing a different shape in the phase plane than that observed in Fig.3and Fig.4. Here, it is the lowest frequency component of the P2 dynamics that dominates the RF spectrum despite the weak injection. From Fig.6(b)–6(e), the radii of the two circles increase until both break into multiple loops of various amplitudes characteristic of a chaotic dynamics situation. All these loops then merge into a single circle as P1 sets in, as can be seen from Fig.6(f)–6(h).
chaotic dynamics and help the display and comparison of long chaotic time series. Moreover since phasors are in fact representations of the way time series evolve in time, they also help to understand how the SL progresses from one type of dynamics to another. Finally, the phasors will represent a valuable tool for future comparison of the experimental data presented in this article to our on-going theoretical analysis of optically-injected VCSELs. In the case of chaotic dynamics, calculated and measured time series are difficult to effectively compare in the time domain because of the relative randomness of such signals. On the other hand, a comparison of theoretical and experimental phasors ofIwould allow for a deeper evaluation of the agreement between theory and experiment.
IV. MEDIA FILES
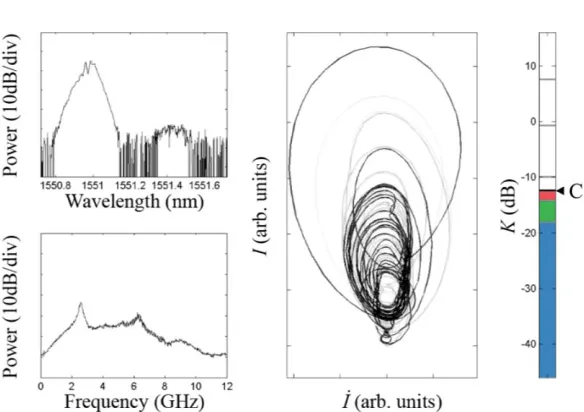
In this section we present results obtained from the acquisition of a significant volume of time series data. This has allowed us to create, for the first time to the best of our knowledge, audio/video (AV) files providing unique insight into the evolution of the dynamics over a wide range of injection strengthK. These files have been constructed from the data which has been summarised in Fig.3to Fig.6. In particular we show individual AV files that visualise the data for each of the detunings as follows: Media1(Fig.3), Media2(Fig.4), Media3(Fig.5) Media4(Fig.6). AV files of higher video quality are available in.22Fig.7shows a still frame taken from the video file forf=5 GHz (Media1) where we have included windows which simultaneously show the optical and RF spectra, the phasor, and the injection strength. The data is analysed using a sliding ∼10 ns window; thus several frames of the video correspond to different parts of a 100 ns long real-time sample measured at a given value of K. This helps to reduce the broadening influence of the system noise on the shape of the phasor. Kis displayed via a vertical bar in which the regions of different dynamics are indicated by the following colour code: blue for P1, green for P2, yellow for P4, orange for QP behaviour and red for C. A cursor tracks the evolution ofKand indicates the type of dynamics currently observed. To further aid understanding of the time series, the data was also used to create sound tracks to accompany the video files. For each detuning, the track was created by concatenating the 100 ns long real-time series frames for successive values ofK. The sequences were cross-faded at the junction between two frames to avoid audible clicks, and the data was stored without further processing in a WAV file and then integrated into the video file. The sampling rate of the WAV file was set to 44.1 kHz, and the data is thus converted to audible frequencies at playback. Such audio tracks offer a very intuitive way of studying the evolution of the dynamics: the noise of the measurement can be heard in the background, the evolution of the power and frequency of P1 is manifested clearly by a single tone, the appearance of P2 is characterised by a lower tone added to that of the P1 signal, and chaotic dynamics are easily identified and distinguished from noise.
FIG. 7. Single-frame excerpt from the created video file showing the evolution of the dynamics withKwithf=5 GHz (Media1). The optical (top left) and electrical (bottom left) spectra are displayed along with the phasor ofI(centre). The current value ofKand the type of dynamics observed are indicated in the right-hand side of the image.
that the appearance of chaos corresponds to an increasing number of wide loops which add to the phasor seen for periodic dynamics. The higherKgets from 00:09 to 00:12, the more frequently these additional loops appear in time. Withf=2.5 GHz (Media2), between 00:19 and 00:20, periodic dynamics with an open elliptical phasor appear inside an island of C. Such temporal instabilities of the dynamics are beyond the scope of this study and further analysis of the time series is required to understand the source of such instabilities.
The sharpness of the transitions between dynamics is striking forf=-4.2 GHz (Media3). At 00.10, the QP dynamics seem to suddenly vanish as the time series becomes dominated by system noise around a stable DC level (IL) as can be seen from the dark dot at the centre of the phasor. Yet, strong chaotic dynamics suddenly appear at 00:11 and disappear at 00:12, after which IL abruptly occurs. Forf =-6.2 GHz (Media4), the transitions from C to periodic dynamics and then IL from 00:12 to 00:13 are just as rapid. Note also the fact that no oscillations could be seen in the time series after 00:13 whilst the optical and electrical spectra suggest the presence of weakening periodic dynamics.
This novel approach for the presentation of experimental real-time series forms a very powerful tool to aid the visualization and analysis of the dynamics of the SL. In particular the phasors complement the usual stability maps by revealing unique features in the evolution of the dynamics with injection parameters. They also assist with the identification of different features seen in long frames of time series. Phasors can also be used for a fast comparison of different types of temporal behaviour which could not readily be seen from conventional measurements of optical or electrical spectra. Finally, such video files used in conjunction with a stability map could greatly assist the choice of the injection parameters for use in practical applications, e.g. for radio-over-fibre systems.
V. CONCLUSION
(EPSRC) under project EP/G012458/1 and by the European Commission under the Programme FP7 Marie Curie Intra-European Fellowships Grant PIEF-GA-2008-219682. The authors would like to thank Nadir Khan and Rihab Al-Seyab for fruitful discussions. Agilent UK is acknowledged for the loan of their DSA91304A oscilloscope.
1J. Sacher, D. Baums, P. Panknin, W. Elsasser, and E. O. Gobel, “Intensity instabilities of semiconductor-lasers under current
modulation, external light injection, and delayed feedback”,Phys. Rev. A45, 1893–1905 (1992).
2E. K. Lau, L. H. Wong, and M. C. Wu, “Enhanced modulation characteristics of optical injection-locked lasers: a tutorial”,
IEEE J. Sel. Top. Quantum Electron.15, 618- 633 (2009).
3M. J. Adams, A. Hurtado, D. Labukhin and I. D. Henning, “Nonlinear semiconductor lasers and amplifiers for all-optical
information processing”,Chaos20, 037102 (2010).
4S. Wieczorek, B. Krauskopf, T. B. Simpson, and D. Lenstra, “The dynamical complexity of optically injected semiconductor
lasers”,Phys. Rept.416, 1–128 (2005).
5T. B. Simpson, J. M. Liu, K. F. Huang, and K. Tai, “Nonlinear dynamics induced by external optical injection in
semiconductor lasers”,Quantum and Semiclass. Optics9, 765–784 (1997).
6V. Annovazzi-Lodi, A. Scire, M. Sorel, and S. Donati, “Dynamic behavior and locking of a semiconductor laser subjected
to external injection”,IEEE J. Quantum Electron.34, 2350–2357 (1998).
7J. Troger, P. A. Nicati, L. Thevenaz, and P. A. Robert, “Novel measurement scheme for injection-locking experiments”,
IEEE J. Quantum Electron.35, 32–38 (1999).
8T. B. Simpson, “Mapping the nonlinear dynamics of a distributed feedback semiconductor laser subject to external optical
injection”,Optics Commun.215, 135–151 (2003).
9S. Valling, T. Fordell and A. M. Lindberg, “Experimental and numerical intensity time series of an optically injected solid
state laser,”Opt. Commun.254, 282-289 (2005).
10S. Valling, T. Fordell and A. M. Lindberg, “Maps of the dynamics of an optically injected solid-state laser,”Phys. Rev. A
72, 033810 (2005).
11S. Valling, B. Krauskopf, T. Fordell, A. M. Lindberg, “Experimental bifurcation diagram of a solid state laser with optical
injection,”Opt. Commun.271, 532–542 (2007).
12D. M. Kane, J. P. Toomey, M. W. Lee and K. A. Shore, “Correlation dimension signature of wideband chaos synchronization
of semiconductor lasers”,Opt. Lett.31, 20-22 (2006).
13J. P. Toomey, D. M. Kane, M. W. Lee and K. A. Shore, “Nonlinear dynamics of semiconductor lasers with feedback and
modulation”,Opt. Express18, 16955 (2010).
14B. Kelleher, D. Goulding, B. Baselga Pascual, S. P. Hegarty and G. Huyet, “Phasor plots in optical injection experiments”,
Eur. Phys. J. D58, 175-179 (2010).
15B. Kelleher, D. Goulding, S. P. Hegarty, G. Huyet, D.-Y. Cong, A. Martinez, A. Lemaitre, A. Ramdane, M. Fischer,
F. Gerschutz and J. Koeth, “Excitable phase slips in an injection-locked single-mode quantum dot laser,”Opt. Lett.34, 440-442, (2009).
16D. Goulding, S. P. Hegarty, O. Rasskazov, S. Melnik, M. Hartnett, G. Greene, J. G. McInerney, D. Rachinskii and G. Huyet,
“Excitability in a quantum dot semiconductor laser with optical injection,”Phys. Rev. Letts.98, 153903 (2007). 17B. Kelleher, C. Bonatto, G. Huyet and S. P. Hegarty, “Excitability in optically injected semiconductor lasers: contrasting
quantum-well- and quantum-dot-based devices”,Phys. Rev. E83, 026207 (2011).
18N. M. Al-Hosiny, I. D. Henning, and M. J. Adams, “Tailoring enhanced chaos in optically injected semiconductor lasers”,
Optics Commun.269, 166–173 (2007).
19K. Panajotov, M. Sciamanna, I. Gatare, M. A. Arteaga and H. Thienpont, “Light polarization fingerprints on nonlinear
dynamics of vertical-cavity surface-emitting lasers”,Opto-electron. Rev.16, 337-346 (2008).
20L. Chrostowski, B. Faraji, W. Hofmann, M. C. Amann and S. Wieczorek, “40 GHz bandwidth and 64 GHz resonance
frequency in injection-locked 1.55μm VCSELs”,IEEE J. Sel. Top. Quantum Electron.13, 1200-1208 (2007).
21A. Hurtado, A. Quirce, A. Valle, L. Pesquera and M. J. Adams, “Nonlinear dynamics induced by parallel and orthogonal