Rochester Institute of Technology
RIT Scholar Works
Theses Thesis/Dissertation Collections
2009
Makeready reduction in a platen die cutting
operation: an analysis of process improvement
methodologies
Charles Armendariz
Follow this and additional works at:http://scholarworks.rit.edu/theses
This Thesis is brought to you for free and open access by the Thesis/Dissertation Collections at RIT Scholar Works. It has been accepted for inclusion in Theses by an authorized administrator of RIT Scholar Works. For more information, please [email protected].
Recommended Citation
Makeready Reduction in a Platen Die Cutting Operation: An Analysis of Process Improvement Methodologies.
By
Charles E. Armendariz
A thesis submitted in partial fulfillment of the requirements for the degree of Master of Science
in the School of Print Media
in the College of Imaging Arts and Sciences of the Rochester Institute of Technology
Fall 2009
Primary Thesis Advisor: Dr. Scott Williams Secondary Thesis Advisor: Professor Barbara Birkett
ii
School of Print Media Rochester Institute of Technology
Rochester, New York
Certificate of Approval
Makeready Reduction in a Platen Die Cutting Operation: An Analysis of Process Improvement Methodologies
This is to certify that the Master’s Thesis of Charles E. Armendariz
has been approved by the Thesis Committee as satisfactory for the thesis requirement for the Master of Science degree
at the convocation of Fall 2009
Thesis Committee:
Primary Thesis Advisor
Secondary Thesis Advisor
Thesis Consultant
Graduate Program Coordinator
iii
Acknowledgements
First I would like to thank my heavenly Father, I believe throughout this endeavor, He provided me right happenings. I believe that God set me up to always succeed and never to fail and for that I am thankful. I would like to thank my family for all their support, love and prayers, without them, I know
iv
Table of Contents
List of Tables...ix
List of Figures ...xi
List of Equations...xii
Abstract ...xiii
Chapter 1 ...1
Introduction and Problem Statement...1
Introduction ...1
Statement of Problem ...2
Reason for Study ...3
Chapter 2 ...5
Theoretical Basis...5
5S Tool (Sort, Straighten, Shine, Standardize, Sustain)...6
Process Standardization Tool...7
Improve Standards ...8
Standardization Promotes Individuality and Creativity ...8
Visual Control Tool ...9
Continuous Improvement Tool (Kaizen) ...9
v
Traditional Improvements vs. SMED Improvements ...11
Internal and External Activities ...12
Parallel Activities ...12
Elimination of Excessive Adjustments...12
F.A.S.T. ...13
Total Production Maintenance (TPM)...14
Total Production Maintenance (TPM) Equipment Program...15
Overall Equipment Effectiveness (OEE) ...16
Chapter 3 ...19
Literature Review...19
Lean Manufacturing ...19
Improvements Through Lean Leadership ...20
Limitations Affecting Lean Practices in the U.S...21
Lean in Print Manufacturing ...23
Process Improvement ...24
Makeready Improvements for Platen Die Cutting Operation...26
SMED for Platen Die Cutting Operation. ...27
Long-Term Implementation Difficulties for SMED. ...28
Improving Equipment Performance with Reliability. ...30
Chapter 4 ...32
vi
Limitation of the Study ...32
Chapter 5 ...34
Description of Equipment and Process...34
Chapter 6 ...35
Methodology ...35
Machine Effectiveness Analysis...36
Kaizen Event...39
Kaizen Group ...40
Kaizen Event Schedule ...40
Kaizen Event Area Profile ...41
Kaizen Newspaper ...41
Kaizen Blitz ...42
5SBlitz ...42
Makeready Blitz ...43
Spaghetti-Mapping Diagram. ...44
Video Recording. ...46
Set-up Observation Analysis Form. ...46
Data Analysis ...47
Analysis of Machine and Process Effectiveness ...47
5S Analysis...48
vii
Makready Checklist Form. ...48
Chapter 7 ...50
Results and Discussion ...50
Machine and Process Effectiveness Analysis ...50
Pareto Chart ...50
Individual X Chart ...51
Discussion of OEE...53
Theoretical Results. ...53
Platen Die Cutting 5S Results...55
Maintaining 5S Results...59
Platen Die Cutting Makeready Analysis...59
Spaghetti-Mapping Diagram...60
Video Recording Observation Analysis ...63
Discussion of Video Recording Improvement ...63
Chapter 8 ...66
Summary and Conclusion ...66
Usefulness of Methodology ...67
5S (Sort, Straighten, Shine, Standardize, and Sustain) ...67
Makeready...68
Recommendations for Further Studies...69
viii
Appendix A...76
Kaizen Event Forms ...76
Appendix A: Description of Equipment and Process ...77
Platen Die Cutting Press ...77
Bobst SP-102E Process...77
Tooling and Equipment ...78
Platen Section...78
Stripping Section...79
Blanking Section. ...79
Waste take-up section. ...79
Makeready Process ...80
Appendix B...82
Kaizen Event Forms ...82
Appendix B: Kaizen Event Forms ...83
Appendix C...90
Kaizen Event Results ...90
ix
List of Tables
Table 1. 5S Process, Translation, and Definition
(Liker and Meier, 2006, p. 64) ...7
Table 2. Category of 'Six Big Losses' ...15
Table 3. Post-Improvement Initiative Difficulties (McIntosh et al, 1996, p. 10)...29
Table 4. Production Data Form Analysis ...37
Table 5. Calculation for Individual (X) Chart...39
Table 6. F.A.S.T. Categorical Analysis...47
Table 7. Data Collection of 23 Makereadies (MR)...52
Table 8. Comparison Results of Availability and OEE to Makeready Improvements ...53
Table 9. Overall Equipment Effectiveness Comparison Analysis...54
Table 10. Distance Traveled during Makeready...62
Table 11. Makeready Analysis ...63
Table 12. Kaizen Event Description ...83
Table 13. Kaizen Event Area Profile...84
Table 14. Kaizen Newspaper form (Item No. 1-15) ...85
Table 15. Kaizen Newspaper Form (No. Item 16-43)...86
Table 16. Kaizen Newspaper Form (Item No. 44-55)...87
Table 17. Kaizen 5S Audit Checklist Form ...88
x
Table 19. Platen Die Cutting 5S Audit Form...91
Table 20. Setup Observation Analysis Sheet ...92
Table 21. Setup Observation Analysis Sheet ...93
Table 22. Setup Observation Analysis Sheet ...94
Table 23. Setup Observation Analysis Sheet ...95
Table 24. Setup Observation Analysis Sheet ...96
xi
List of Figures
Figure 1. Printing Companies Involved in Lean Manufacturing
Tools/Techniques ...23
Figure 2. Analysis of Total Time Chargeable on a Given Machine ...25
Figure 3. Current State of Workflow Spaghetti-Mapping Diagram ...45
Figure 4. Production for Platen Die Cutting (11/21 - 12/04) ...51
Figure 5. X-Chart Makeready Analysis...52
Figure 6. 5S Process, Before (left) and After (right) of Supply Cabinet...56
Figure 7. 5S Process, Before (right) and After (left) of Machine Tools Operator Side...57
Figure 8. 5S Process, Before (left) and After (right) of Workbench ...58
Figure 9. Reduction Path of Makeready Process, Spaghetti-Mapping Diagram...61
xii
List of Equations
Equation 1. OEE = Availability x Performance x Quality ...17
Equation 2. Availability = Planned Availability x Uptime ...17
Equation 3. Performance = Actual Production ÷ Expected Production ...17
Equation 4. Quality = Quality Production ÷ Actual Production...17
Equation 5. Planned Availability = Operating Time ÷ (Operating Time + Makeready) ………...17
Equation 6. Uptime = (Operating Time – Breakdowns ÷ (Operating Time) ...17
Equation 7. Actual Production = Total Output Produced ...17
Equation 8. Expected Production = OEM Production Rate x Hours...17
xiii
Abstract
The research focused on determining whether specific process improvement methodologies performed in a Kaizen event could reduce the overall makeready process in a platen die cutting operation. Data was collected and analyzed in order to identify opportunities that would reduce the effort (procedure steps and time) within the makeready procedure.
Analysis was conducted on the makeready procedure at a packaging company in Rochester, New York. The researcher worked with the Center for Excellence in Lean Enterprise (CELE) at Rochester Institute of Technology (RIT) in conducting the Kaizen event. An initial analysis with the use of a 5S audit and Individual X-Chart was conducted in order to qualify the types of process
improvements that would later be implemented during the Kaizen event. Video recording and spaghetti-mapping diagrams were prepared during the makeready analysis. The information from these two process improvement analysis
techniques revealed procedure improvements that were captured during the research.
This research revealed opportunities for a Bobst SP-102E platen die cutting machine makeready process by removing the excessive motion to develop a more effective makeready process. With the use of process
xiv
operation’s makeready time, and thereby reduce costs of manufacturing by eliminating waste in the operation.
The operator performed the makeready in 86 steps in 1 hour 18 minutes which was the existing makeready condition for the platen die cutting operation. The goal for the research was to identify if specific process improvements would improve the current makeready process as mentioned. Significant reductions to the makeready procedure were identified during post analysis: steps were
reduced by 29% from 86 to 61 and the time was reduced by 40% from 1 hour 18 minutes to 40 minutes.
Factors such as declining run lengths, increasing competition from other media, and off shoring are threatening U.S. print manufacturers and forcing companies to locate areas to reduce costs in order to maintain clients. This research was an important aspect that contributes to the efforts to reduce cost in print manufacturing by analyzing the effects of process improvement
1
Chapter 1
Introduction and Problem Statement
Introduction
Lean manufacturing (Lean) techniques are beginning to gain more support from the print industry. Significant issues that are affecting printing companies are market competition, rising manufacturing costs, and pressures in profit maximization (shorter lead times and lower quantities); these issues must be addressed in order to sustain profitability. Printers are realizing that Lean, as demonstrated in other industries, improves productivity and creates the
opportunity for greater manufacturing achievements and can be applied to their printing company. Durkalski-Hertzfeld (2008, ¶56) said that during times of economic turmoil, companies are turning to strategies that further continue their competitiveness to bring profits in the near future. A survey by
Durkalski-Hertzfeld indicates that 62% of board converting facilities are focused on Lean as a significant element to promote efficiency and profitability.
The purpose of this research was to determine if Lean, Single-Minute Exchange of Die (SMED), and Total Productive Maintenance (TPM) could reduce makeready-time in a print manufacturing operation. The platen die cutting
2
Rochester Institute of Technology’s (RIT) Center for Excellence in Lean
Enterprise (CELE) for assistance in performing a study in process improvements. CELE responded by facilitating a Kaizen event with a carton-converting print manufacturing company in Rochester, New York.
The company agreed to participate in the thesis study and permitted the researcher to analyze a platen die cutting operation’s makeready procedure. The researcher and Center for Excellence in Lean Enterprise (CELE) assessment focused on implementation of process improvement methodologies to optimize the operation’s current makeready procedure. Initially the platen die cutting operation was not considered a Lean operation, based on the fact that a 5S (Sort, Straighten, Shine, Standardize, and Sustain) had not been performed in the operation, nor had a standard been implemented for the makeready process. The researcher worked with CELE to analyze the operation, perform the Kaizen event, and reduce the makeready process.
Statement of Problem
Nick Howard (Howard, 2009), an associate with Howard Graphic
3
phenomenon is now pressuring manufacturers to fill in the gaps of lost production capacity due to print contracts shrinking volume sizes in order to regain lost revenues.
This topic of process improvement is important for print manufacturers because it identifies methods that create opportunities for reductions in an operation’s makeready, which essentially lowers costs in production. Scott Reighard, Vice President of Operations for Acorn Press, Inc, says that poor processes can never be resolved with new technology. Fixing the specific
process itself is the key to improvement (Cross, 2001, ¶13). Economic pressures are forcing companies to reduce their internal manufacturing costs, and one of the greatest potential savings in a die cutting operation is found in reducing the makeready time within the operation (Folding Carton Industry, 2006).
Reason for Study
The researcher is interested in Lean and process improvements as it can be related to the print manufacturing industry. Market pressures are a significant factor due to increasing competitiveness from other media and off shoring which is another reason that the U.S. printing industry must begin to adapt to the
4
The researcher has grown-up in a family printing company and observed inefficiencies that derive from excessive motion, lack of standardization, and unpredictable makeready time.
5
Chapter 2
Theoretical Basis
The focus for this research was to utilize specific techniques that could reduce the makeready process for a platen die cutting operation. This chapter details the concept of Lean manufacturing and the tools and techniques associated with improving a makeready process, such as 5S, Single-Minute Exchange of Dies (SMED), and Total Preventive Maintenance (TPM).
Lean Principles
Lean manufacturing is a manufacturing process that promotes the
elimination of wasteful activities within an operation. In their book Lean Thinking, James Womack and Daniel Jones (1996/2003, p. 10) define Lean manufacturing as a multi-step process that builds an operation to create value for the customer. It introduces and sustains “flow” within the customer value stream, which allows customers to “pull” products from a system that significantly reduces inventory. Lean strives to constantly improve the manufacturing environment by
manufacturing only what the customer is ready and willing to pay for.
6
They were developed through innovative thinking by the Toyota Motor company founders and influencers: Kiichiro Toyoda, Eiji Toyoda, Taiichi Ohno, Shigeo Shingo, and Shoichi Saito, to name a few. These individuals are the principal engineering body of the Toyota Production System and the Toyota Way (Art of Lean, 2004, p. 5; Cooper, Keif and Macro, 2007, p. 18-19).
Lean principles are centered on constantly improving an operation; they maximize a system by reducing costs and eliminating defects that arise from waste. Ohno contends that 95% of all costs are comprised of the following “Eight Wastes” which are listed as: Overproduction, Waiting, Transportation, Non-Value Added Processes, Excess Inventory, Defects, Excess Motion, and
Underutilization of People (Bodek, 2005; Liker & Meier, 2006, p. 34; Kilpatrick, 2003, ¶4).
The following elements in the theoretical basis are tools and techniques which are the primary functions used to accomplish process improvement within a makeready procedure.
5S Tool (Sort, Straighten, Shine, Standardize, Sustain)
5S presents itself as the essential housekeeping procedure and a
7
[image:22.612.107.535.210.463.2]within a manufacturing facility. David G. Dodd of Point Balance explains the fundamentals of 5S in Table 1 (Dodd, 2008, The Tools and Techniques of Lean Part 1).
Table 1. 5S Process, Translation, and Definition (Liker and Meier, 2006, p. 64)
Process/ Translation Definition
Sort/ Seiri
Put to the side all tools and materials from the work area, keeping only the necessities.
Straighten/ Seiton Strategically designate specific places for storing all necessary tools.
Shine/ Seiso Systematically clean the workspace.
Standardize/ Seiketsu
Standardize tasks needed to maintain Shine; responsibilities are assigned to the workforce.
Sustain/ Shitsuke Make the other four steps in 5S a habit.
Process Standardization Tool
The International Organization of Standards (ISO) (2008, ¶1) defines standardization as an approved documented process that provides guidelines for activities, as well as results that are achieved. Standards are based on
consolidated results of science, technology, and experience that promote community benefits. Standardization is a model built and used to create
craft-8
form of production with the mass-form of production. Assembly lines are given standards in order to maintain similar manufacturing of products. For example, Toyota engineers can go to any facility around the world and see matching processes (Liker, 2004, p. 142).
Improve Standards
Standardization is essentially a baseline from which improvements originate. A process is difficult to improve when it has not been standardized. Liker (2004, p. 142) advocates standardization before stabilization; this must occur before improvements can be organized. Lean enables workers to design and build a standard to accomplish their work. Within a Lean environment, management utilizes the workforce to identify what is being accomplished on the production floor. Lean emphasizes the utilization of the workforce to
communicate information back to management in order to create improvement opportunities.
Standardization Promotes Individuality and Creativity
9
critical factor with Lean, and standard processes that are developed and owned by the workforce have the tendency to receive greater acceptance.
Visual Control Tool
Individuals on the shop floor tend to be very visually oriented, and the use of floor markings, signs in the work area, or tool board labels are easy indicators for the workforce to verify that the work area is maintained to the set standard. Visual control tools sustain improvement efforts and simplify decision-making processes by giving employees the right to participate in managing production. An example of employees managing production is the decentralization of
inventory control for operating functions (Grief, 1989/1991, pp. 100, 121; Liker & Meier, 2006, p. 139).
Grief, in his book Rules for Visual Control, describes the practicality of visual tools. He says that they indicate the actual state of affairs, provide information on orders, determine an operation’s current workload, determine whether production is backed-up, and provide foresight for scheduling to eliminate unexpected downtime (1989/1991,pp. 109-110).
Continuous Improvement Tool (Kaizen)
Kai-zen is the Japanese term meaning “improvement” or “making it right.” Kaizen is an approach for an organization to quickly seek improvement by
10
team-based, rapid-improvement function that is used to create immediate changes within an operation. A team should be prepared to quickly study the ailing process, collect and analyze data, apply change and refinement, and present results with a plan to sustain the change.
The Kaizen event should be distributed over five days (Miller, 1998, ¶15; Rizzo, October, 26, 2008, pp. 42-43):
• Day 1: Learn the process
• Day 2: Confirm current state of operation
• Day 3: Analyze and propose improvements
• Day 4: Decide on improvements and implement
• Day 5: Debrief and present results of improvements
The concept of Kaizen is to prepare a team of workers to create improvements within their operation. The Kaizen approach also has the capabilities for improving profitability and the quality of work life for employees (Miller, 1998, ¶42).
Single-Minute Exchange of Die Technique (SMED)
The ability to significantly reduce machine makeready can be
11
an operation’s makeready, Shingo (1985, p. 33) describes the two constant functions of internal setup (IED) and external setup (OED), which are applicable in most operations. Internal Setup (IED) is an activity during makeready that can only be accomplished while the machine is stopped. External Setup (OED) is an activity during makeready that can be accomplished while the machine is still in operation.
Shingo (1985, p. 31) describes the process of makeready improvements by first distinguishing each internal setup (IED) activity and each external setup (OED) activity. Then, where possible, he recommends converting as many IED activities to OED activities to streamline functions within makeready and to capture process improvements.
Traditional Improvements vs. SMED Improvements
Reducing makeready cost by consolidating multiple-lot production into a single-lot of production is the traditional approach for makeready improvement. The increase in output production will generally lower unit production costs associated with a makeready. Traditionally improvements are based on
achieving production economies of scale. In today’s manufacturing environment, small-lot production is essential because of diversification requirements
12
states that the economic lot size theory is correct, but the concept tends to conceal the fact that makeready reductions are possible even with small-lot production.
Internal and External Activities
Internal activities (IED) are standardized functions and necessary
makeready activities most often directed by the original equipment manufacturer (OEM). Specific considerations for these activities are operator safety and equipment reliability. On the other hand, External activities (OED) are
considered opportunity time in SMED. The way OED activities are utilized is by undertaking makeready activities for the next job, such as gathering job
information, tooling and equipment, prior to finishing the current job.
Parallel Activities
Parallel activities allow operators and assistants to accomplish makeready functions simultaneously with safety and effectiveness. Safety is very important during parallel activities, and to maintain safety, it is necessary for the operators to signal each other so the next function can be safely undertaken. Signaling can be done vocally, by hand motion, or with a noise device.
Elimination of Excessive Adjustments
13
He claims that excessive adjustments account for as much as 50% of makeready; establishing a process which eliminates, not just reduces, adjustments leads to tremendous timesaving (Shingo, 1983, p. 66).
F.A.S.T.
14
Total Production Maintenance (TPM)
Fifty years ago, Japanese industries began to learn from the U.S. concept of preventive maintenance, productive maintenance, maintenance avoidance (reducing long periods of maintenance), and reliability engineering of equipment and machines. They eventually took what was learned and formed their own style of productive maintenance that is referred to as Total Production
Maintenance (TPM). TPM is a technique of equipment maintenance that
involves all employees in every function of operations within an organization. For TPM, a key concept is scheduled autonomous maintenance (operator
maintenance programs) routines that keep equipment operating in top running condition without constant use of a maintenance team. With the use of TPM, equipment operators are able to detect problems before breakdowns occur (Japan Institute for Plant Maintenance, 1982/1989, pp. 1, 2).
15
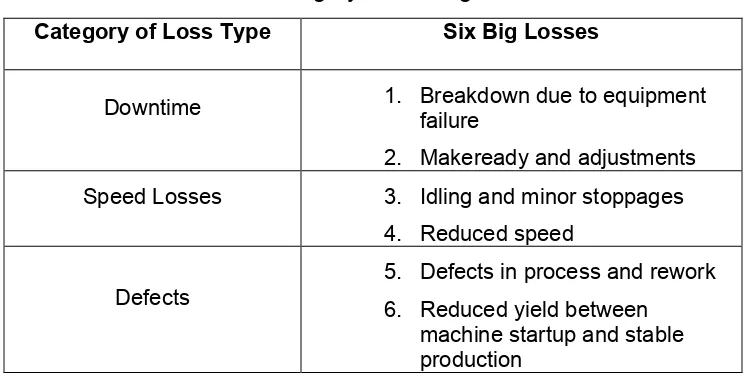
Table 2. Category of 'Six Big Losses'
Category of Loss Type Six Big Losses
Downtime 1. Breakdown due to equipment
failure
2. Makeready and adjustments Speed Losses 3. Idling and minor stoppages
4. Reduced speed
Defects
5. Defects in process and rework 6. Reduced yield between
machine startup and stable production
The Japan Institute for Plant Maintenance (1989, p. 10) suggests that the elimination of the “six big losses” can be achieved by removing production systems which promote equipment breakdowns, eliminating waste (scrap or rework), reducing prolonged makeready, and eliminating slow-running production equipment incapable of meeting productivity requirements. These factors are listed in Table 2 (Japan Institute for Plant Maintenance, 1982/1989, p. 10).
Total Production Maintenance (TPM) Equipment Program
A TPM equipment program begins with company leaders’ establishing the goals for TPM that are carried out by employee teams. The program is achieved with five mutually supportive company goals: Improved equipment effectiveness, Autonomous maintenance by operators, Routine maintenance by the
16
maintenance to eliminate start-up problems (Japan Institute for Plant Maintenance, 1982/1989, p. 20).
Maintenance programs must be continually assessed in light of these goals which provide feedback to assist in refining current maintenance of equipment and improving overall maintenance programs.
Overall Equipment Effectiveness (OEE)
The Overall Equipment Effectiveness (OEE) measurement reveals the efficiency of daily efforts for an operation. OEE has the capability to identify deficient processes that need improvement (Japan Institute for Plant
Maintenance, 1982/1989, p. 365; Cooper, Keif & Macro, 2007, p. 57).
The OEE measurement tool gauges equipment effectiveness by
multiplying the ratio of availability by performance and quality; Overall Equipment Effectiveness = Availability x Performance x Quality (Equation 1). From the given ratios, a company’s measurement of equipment effectiveness can be accurately determined, and deficiencies within the operation can be pinpointed with
17
The equations for OEE, Availability, Performance, and Quality are listed below:
OEE = Availability x Performance x Quality (1) Availability = Planned Availability x Uptime (2)
Performance = Actual Production ÷ Expected Production (3)
Quality = Quality Production ÷ Actual Production (4)
Where
Planned Availability = Operating Time ÷ (Operating Time + Makeready) (5)
Uptime = (Operating Time – Breakdown time ÷ (Operating Time) (6)
Actual Production = Total Output Produced1 (7) Expected Production = OEM Production Rate x Hours2 (8)
Quality Production = Actual Output Produced – Waste (9)
1 Total Output Produced is measured during the period of time that the machine is scheduled for production and does not include any unscheduled production time (unscheduled shifts, holiday’s, etc.)
18
The first multiple is the equipment availability percent, as seen in
(Equation 2). The availability measurement is the product of Planned Availability and Uptime; see (Equations 5 & 6). The result of Availability is a proportion of time that a machine is available for production. The second multiple is the performance percent, (Equation 3). Performance is the quotient of Actual Production output divided by Expected Production output. Actual production equals the Total Output Produced during the given period of analysis; see (Equation 7). Expected Production is a calculation specified by the Original Equipment Manufacturer (OEM). Expected Production is the product of the Production Rate of OEM by the Hours of Production Time analyzed; see (Equation 8). The quality rate is the proportion of deliverable quality products; see (Equation 4). It is the quotient of Quality Production and Actual Production; see (Equation 7 and 9). (Japan Institute for Plant Maintenance, 1982/1989, p. 366; Rizo 2008; Cooper, Keif & Macro, 2007, p. 63-64). Average OEE levels for a manufacturing firm range from 40% to 60% and best-in-class is 85% to 95% (Cooper, Keif, & Macro, 2007, p. 65; Nakajima, 1989, p. 38; Vorne, 2002).
The tools described in this chapter underpin the principles which form the theoretical basis for this research. These principles and tools are vital to
19
Chapter 3
Literature Review
This chapter is an overview of the literature describing the reasons process improvement methodologies are initiated and the factors that prevent continuous improvement efforts within operations from being effectively implemented and maintained.
With the print manufacturing industry being the focus, this chapter
considers literature that describes the challenges and opportunities printers face with the application of process improvement. In specific, it seeks to review literature that deals with makeready reduction in a platen die cutting operation
Lean Manufacturing
20 Improvements Through Lean Leadership
Lean is described as a philosophical paradigm-shift in the way business is conducted. Lean manufacturing derives from the Toyota Production System (TPS) of manufacturing. Liker (2004) recognizes in his book, The Toyota Way,
that it is possible to use TPS tools, while not adhering to the foundation principles of TPS. Not utilizing Lean principles produces limited results with short-term performance improvements that will not be sustainable in the long run (Liker, 2003, p. 41). Survival in the global economy for U.S. manufacturers depends on their ability to constantly improve the quality aspects of their products while reducing the cost of manufacturing. This is necessary in order to sustain a competitive advantage and develop leadership within their markets (Sim and Rogers, 2009).
Sims and Rogers (2009) investigate the “depths of resistance to change” and note in their research that after Kaizen events demonstrate process
efficiency and improvements, the operations return to their original chaotic mode of manufacturing. As Purdum (2006) states in her article, it is vital for leadership to forge all improvement efforts in order to prevent backtracking from occurring.
Purdum (2006, ¶3,4), in her article Lauren Manufacturing Embraces A
Lean Environment to Compete, describes an important principle of a
21
Lean transformation and placed the managing body and workforce on the same course toward a Lean environment. Gray announced the “concept of change” by expressing the need to eliminate waste in order to stay ahead of their
competition, and he emphasized that this would not be accomplished with tangible applications but rather with the elimination of “mental walls” that existed with traditional manufacturing methods (Purdum, 2006, ¶3,4).
U.S. manufacturers are realizing cost reductions with Lean. In 2002, Lauren Manufacturing Company faced an organization-wide dilemma: global competition, which began to encroach on their markets. Lauren Manufacturing left their traditional way of doing business to embark on a transformation that ultimately improved the way business was conducted (Purdum, 2006, ¶1, 2; Kelly, 2003, ¶14). Lisa Huntsman, vice president of operations, approved of the way management openly embraced Lean. Huntsman comments on how
traditional manufacturing profitability can be deceptive, but once Lean concepts were understood, an inventory (portion of a business’s assets) analysis clearly illustrated tremendous deficiency in cash flow and Lean revealed opportunities for improvement (Purdum, 2006, ¶5,14).
Limitations Affecting Lean Practices in the U.S.
22
2004, ¶1; Womack, Jones, and Roos, 1990/2007, p. 10; Farris, Van Aken, Doolen, & Worley, 2008, p. 10). Smalley goes on further to state that, during Lean programs, companies do not use financial metrics to determine Lean benefits through cost reduction. U.S. companies have the tendency to become captivated with Lean theory and continue to overlook Lean principles.
Leadership is an important aspect of Lean, and U.S. companies do not
emphasize the development of leaders to create and guide their improvement teams (Smalley, 2004, ¶1).
A study by Sim and Rogers (2009, p. 45) discusses an important aspect of management support that prevents continuous improvement from having a
successful implementation. Employees felt that management did not follow through on various improvement action items that arose from Kaizen events and were not supporting commitment to continuous improvement. In the study, employees were surveyed, and most agreed that continuous improvement was essential to staying competitive in a global market and that, if they owned their own company, they would implement Lean practices.
Lean challenges company leaders to confront their traditional
23
and paid for), with even greater focus on quality than their non-lean counterparts (Kilpatrick, 2003, ¶9; Davis, 2006, ¶1).
Lean in Print Manufacturing
The concept of Lean in print manufacturing has become a popular and practical application for process improvement, and the rising popularity of Lean concepts attests to their importance to the print-manufacturing environment. Dodd revealed data from his 2008 survey that finds 51% (Figure 1) of print manufacturers have embraced the concepts of Lean and are actively participating in Lean functions (Dodd, 2008a).
Figure 1. Printing Companies Involved in Lean Manufacturing Tools/Techniques
The positive effect is that Lean has produced visible improvements for the printing industry in recent years, and Dodd (2008b) states that because of market competition, increases in manufacturing costs, and pressures in profit
51%
12%
37% Currently Using Lean 51%
Have Used Lean 12%
24
maximization (shorter lead times and lesser quantities) printers have embraced Lean manufacturing in order to create opportunities for improvements
(Koltzenburg, 2004, ¶2; Dodd, 2008b, ¶9; McIntosh et al, 1996, p. 5). Since 1998, 7,500 printing facilities were forced to close their doors from those
contributing factors (Cooper, Keif, & Macro, 2007, p. 16). Dodd (2008a, ¶9) in his article The “Leaning” of Print recognizes that printing company leaders are
developing a greater interest in improving productivity for their companies. Printers are realizing that Lean, as demonstrated in other industries, improves productivity and creates the opportunity for greater manufacturing achievements and that it can be applied to their company.
Challenges are many and printing company managers are under
enormous pressure with shorter runs, rush jobs, and cost reductions, which have become common requirements of print-buyers (Whalen, 2001; O’Brien, 1999; Cross, 2000; Cross, 2001). Print manufacturing companies that are advancing in Lean have focused on eliminating costs permanently, increasing throughput efficiently, and developing more sustainable and predictable processes that achieve the operational goals with continuous improvement methodologies (Cross, 2001, ¶1-3).
Process Improvement
25
improvement (Summers, 1997/2006, p. 25).The function of a makeready is commonly included in the selling price of a job that the customer is willing to pay for. Print manufacturers might ask the question, why improve the process if the customer is paying for the makeready time? In response, one needs to realize that the makeready does not add value to the product. Cooper, Keif, and Macro (2007, p. 45) state that if competitors are able to reduce their makeready time, then the cost of manufacturing can also be reduced, thus improving those firms’ competitive advantage.
Maximizing sellable production and minimizing downtime is the focus in makeready improvements (Womack and Jones, 1996/2003, p. 69; Ynostroza, 2000, ¶9). The print industry average percentage of a machine’s chargeable time to total available time is about 75%, among the most efficient plants 85%, and top performers’ percentage as high as 90% which leaves only 10% for downtime and breakdown, as illustrated in Figure 2.
Figure 2. Analysis of Total Time Chargeable on a Given Machine
75%
85%
90%
65% 70% 75% 80% 85% 90% 95%
Low EfBiciency Medium EfBiciency High EfBiciency
26
Makeready Improvements for Platen Die Cutting Operation
In 2001, Process Graphics Services, Inc. (PGS), in Grand Prairie, Texas, a printed sheets finishing/ converting manufacturer, was receiving increased pressure from customers for just-in-time (JIT) manufacturing in platen die cutting. Initial reaction was to hire skilled personnel for immediate improvement, but a lack of skilled personnel did not allow that option to emerge. PGS researched their operation and analysis verified an increase in job-turnaround would occur from optimizing the current working process with faster makereadies and greater productive efficiencies (Whalen, 2001, ¶13, 16). The company contacted the Bobst Group for a process performance solution called Total Optimization Project (TOP), which uses Single-Minute Exchange of Die (SMED) principles with
mechanical improvement suggestions as a method to reduce makeready time for a platen die cutting operation. The SMED principle used during the analysis identified that time was being lost due to inefficient processes and that
27
be comprehended prior to any activity. Three vital elements before conducting the improvement initiative should be considered:
• What level of improvement can be expected?
• How will the business benefit from this improvement?
• What structure should a successful improvement initiative have?
(McIntosh, Culley, Gest, Mileham, & Owen, 1996, p. 8)
SMED for Platen Die Cutting Operation.
SMED is described as a dynamic application used to develop process improvements that reduce work-in-process inventory and to develop operation efficiencies to diversify production to better meet customer specifications.
During the TOP program, one of the recommendations to PGS was to finish tooling for the platen press for the next job while the machine was finishing a current job. Pfaff (2002, ¶5-7) and Witzig (2006, ¶7) affirm that significant productivity loss, due to necessary and unnecessary downtime, reduces a company’s profitability and is commonly a result of poor preparation and communication from upstream processes. Whalen (2001, ¶28, 29) estimates time-savings of up to 50% for an operation can be achieved within the
28
Mark Smith, the technology editor for Printing Impressions, states that short-run manufacturing is a growing trend and the opportunity to sell more press time will assist in balancing the print manufacturer’s loss from the lack of long-run jobs. Printers must utilize efficiencies within their entire operation in order to sell more makereadies, which essentially will maximize revenues (Smith, 2008, ¶2).
Long-Term Implementation Difficulties for SMED.
Amid these issues of excessive downtime, Shigeo Shingo (1985, p. 13) recognizes makeready as a necessary downtime, and he suggests
improvements to makeready can be achieved with the SMED concept.
Once an analysis of an operation is done and the SMED methodology is implemented, an area of great concern for companies should be the
sustainability factor for the makeready improvements.
Process improvement initiatives routinely have the capability to
demonstrate degrees of improvement, but considerations for potential obstacles that reduce improvement sustainability efforts must be addressed. The first obstacle of measuring and reporting changeover (Shingo, 1985, p. 11) mentions the importance of monitoring the makeready performance accuracy. The
29
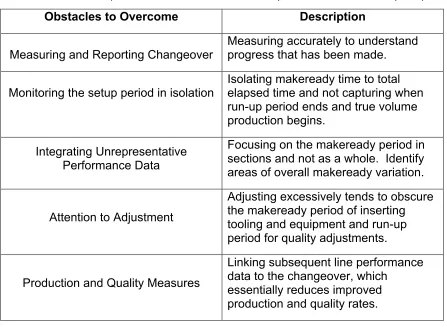
[image:44.612.102.549.259.586.2]performance dates hinder process improvement initiatives. During process improvements, it becomes important to narrow attention to adjustments where changes are made in order to positively affect the manufacturing outcome. The production and quality measures help determine when quality defects arise during production. A summary of obstacles is listed in Table 3.
Table 3. Post-Improvement Initiative Difficulties (McIntosh et al, 1996, p. 10)
Obstacles to Overcome Description
Measuring and Reporting Changeover
Measuring accurately to understand progress that has been made.
Monitoring the setup period in isolation Isolating makeready time to total elapsed time and not capturing when run-up period ends and true volume production begins.
Integrating Unrepresentative Performance Data
Focusing on the makeready period in sections and not as a whole. Identify areas of overall makeready variation.
Attention to Adjustment
Adjusting excessively tends to obscure the makeready period of inserting tooling and equipment and run-up period for quality adjustments.
Production and Quality Measures
Linking subsequent line performance data to the changeover, which
essentially reduces improved production and quality rates.
30
Improving Equipment Performance with Reliability.
Total Productive Maintenance (TPM) is essential for continuous efficient manufacturing (Smalley, 2005, ¶1, 13). Rizzo (2008, p. 22) and Nakajima (1989, p. 39) state that the loss that affects equipment efficiency can be described as either sporadic loss (sudden and infrequent loss of time) or chronic loss
(recurring defect from equipment, operators or materials). The goals of improving machine uptime with TPM can assist by making certain machines operate with minimal time loss (Cooper, Keif, Macro, 2007, p. 57). Rizzo (2008, p. 21) and Dodd (2008, ¶6) describe TPM as a rigorous program that is
developed by the workforce to realize the optimal condition for equipment with process reliability. Sporadic and chronic losses that do occur will hinder production efficiency, but TPM is a capable technique of resolving those equipment problems.
31
of total equipment effectiveness by improving all related factors of availability, performance, and quality (Smalley, 2005, ¶17; Nakajima, 1989, p. 34). Process improvement focuses on removing the waste that exists in the manufacturing environment.
Growth and development of process improvement are not established with only tools and techniques but with a philosophical paradigm shift in the way business is conducted. If managers do not embrace the true vision of process improvement, Lean programs lack focus and become limited. Print
manufacturers are under pressure to meet customers’ increasing demands and reduce manufacturing costs. For these reasons, process improvement
32
Chapter 4
Research Statement
The researcher was to determine whether process improvements (Lean, SMED, and TPM) that are performed in a Kaizen event would increase the Overall Equipment Effectiveness (OEE) metric within a platen die cutting operation. Increase to OEE was facilitated by reducing the overall makeready time and reducing the number of steps within the makeready procedure.
Limitation of the Study
The company that sponsored the research for makeready reduction did experience a lack in process improvement leadership. The Kaizen event was not executed with the full involvement of administrative personnel. Customer Service representatives and Human Resources associates were not included in the evaluation of the die cutting operation in order to gain an administrative perspective (Liker & Meier, 2006, pp. 456-457).
33
cutting makeready procedure. Essentially the limitation to the makeready
reduction would be that improvements would only be realized for one project but would not be transferable to another due to significant project variation.
Another limitation applies to SMED, which utilizes parallel activities during the makeready and requires a full-time individual in order to achieve reductions. It is important to mention that the platen die cutting operation that was analyzed used an assistant to conduct the makeready process, but in some instances the assistant was not available because a full-time makeready assistant had not been assigned to the operation.
The equipment that was used in the makeready analysis was a Bobst SP-102E, which was manufactured in 1989. The Bobst SP-102E does not meet the capabilities of newer Bobst platen die cutting machines that are currently
available for purchase which offer greater automation, speed, and other
34
Chapter 5
Description of Equipment and Process
The research experiment was conducted at a packaging company in Rochester, New York. The company will be referred to as Company DP. The company worked directly with Rochester Institute of Technology Center for Excellence in Lean Enterprise (CELE). From this relationship an opportunity arose to work with Company DP on their platen die cutting operation.
35
Chapter 6
Methodology
The research methodology clarifies the steps and procedures used to analyze platen die cutting makeready procedures data. The data collected is then used to identifying reductions in makeready time used to identify process
improvement methodologies.
Initially, production sheets for the platen die cutting operation from two shifts per day were collected and analyzed over a 2-week production period. The data was used to calculate the Overall Equipment Effectiveness (OEE) metric as a baseline for the operation, to graph a pareto chart to identify the proportion of time spent on the various operational functions, and to analyze the variation of makeready through the use of an Individual X Chart.
36
makeready process. Analysis of the research will describe the before and after of the Kaizen results, and upon determination by management, improvements were to be implemented, standardized, and trained upon. In continuation with
monitoring results of the Kaizen event and with management approval,
quantitative analyses of makeready improvements were captured by collecting information from production and comparing the new information to the original productivity baseline of Overall Equipment Effectiveness.
The researcher presented to management potential improvements to the process and the additional requirements to implement improvements, but due to the current economic situation and other unforeseen circumstances, Company DP was not able to proceed with implementation of the suggested improvements.
Machine Effectiveness Analysis
Various tools were utilized to capture relevant information concerning the platen die cutting makeready process. Identifying each step within the
makeready process was elaborated with the use of a production data form. Once the information was cataloged, a pareto chart was developed to determine the production time breakdown for the operation, an Overall Equipment Effectiveness (OEE) metric was calculated as a measure of operation efficiency, and an
37
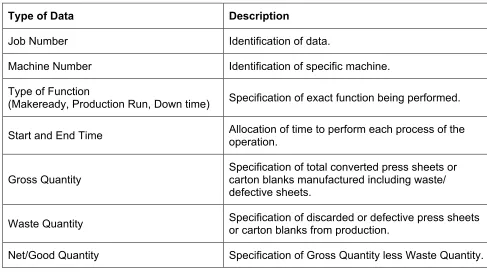
Table 4. Production Data Form Analysis
Type of Data Description
Job Number Identification of data.
Machine Number Identification of specific machine.
Type of Function
(Makeready, Production Run, Down time) Specification of exact function being performed.
Start and End Time Allocation of time to perform each process of the operation.
Gross Quantity
Specification of total converted press sheets or carton blanks manufactured including waste/ defective sheets.
Waste Quantity Specification of discarded or defective press sheets or carton blanks from production.
Net/Good Quantity Specification of Gross Quantity less Waste Quantity.
Table 4 shows the operation characteristics analyzed in the research. The production data form captured specific criteria for each production run. The platen die cutting operator was using this specific form in order to identify each function being conducted. The production form was used throughout the
production week, capturing start and stop times, and totaling net production for the platen die cutting press.
38
Essentially this information identified what functions make-up the majority of production time and which downtime area should be focused on for significant improvement to production uptime (Gryna, Chua, & Defeo, 1904/2007, p. 69).
Calculating the Overall Equipment Effectiveness (OEE) metric also assisted in verifying sources of productivity loss in the platen die cutting operation. With the OEE, productivity was assessed from three indicators:
availability, performance, and quality. Information to calculate the OEE equation (OEE = Availability x Performance x Quality) was compiled from the two-week production period (November 21, 2008 – December 4, 2008). The information was entered into an Excel spreadsheet to calculate the OEE (see Appendix C).
The sample of 23 individual makereadies (during 11/21 – 12/04) was statistically analyzed with an Individual X chart. The chart was appropriate because of the small sample size of 23 data points and was used to assess whether the makeready procedure was within the control limits of a normal distribution at a 99.73 percent confidence level, which the measured values fall within plus or minus three standard deviations of the mean for the 23 data points. Calculation and description for the Individual X Chart mean and control limits are described in Table 5.
39
Table 5. Calculation for Individual (X) Chart
X-Chart
Centerline: Estimated long-term
mean of a process in a control chart X-Bar: Average time of 23 data points
Upper Control Limit: Top limit in
control chart, above the centerline X-Bar + z (MR-Bar/d2)
Lower Control Limit: Bottom limit in
control chart, below the centerline X-Bar – z (MR-Bar/d2)
Another opportunity statistical analysis provided was to identify whether the process variation was common or whether variation was assignable for the makeready process. In cases of assignable causes of variation, usually the operation requires a single action to correct variation, while common variation can be treated with process improvement methodologies.
Kaizen Event
The Kaizen event focused on uncovering ways to reduce makeready time for the platen die cutting operation. Time reduction, standardization, and best practices for the makeready procedure were the focus for the Kaizen event.
40
during the Kaizen event in order to keep data organized for successful analyses (see Appendices B and C):
• Kaizen Event Schedule Form
• Kaizen Event Area Profile Form
• Kaizen Newspaper Form
• Set-up Observation Analysis Form • Platen Die Cutting 5S Audit Form
Kaizen Group
The researcher developed a Kaizen group by selecting from a subgroup of available individuals who possessed diverse experiences and perspectives – upstream and downstream – from the operation, as well as individuals from within the platen die cutting department. According to Lean methodologies, it was essential that the workforce group contribute their expertise in order to extract best practices.
Kaizen Event Schedule
The researcher, work crew, supervisors, and company owners
41
were asked to be mentally and physically prepared as if they were attending a normal day of operation (see Appendix B).
Kaizen Event Area Profile
The Event Area Profile was constructed to summarize the important aspects of the Kaizen event and was documented in an Excel spreadsheet. These data provided a qualitative analysis for the Kaizen event by documenting information about the Kaizen team and Kaizen event schedule. The Event Area Profile form described the initial difficulties within the operation and listed the primary objectives for improving the platen die cutting makeready process. The Kaizen Event Area Profile (see Appendix B) form was constantly revised and developed with the latest version being exhibited to the Kaizen team, as the difficulties within the process were increasingly better understood.
Kaizen Newspaper
42
and individuals responsible for the countermeasures. The Kaizen newspaper also gave the anticipated due dates for completing the necessary
countermeasure tasks before the Kaizen event ended. Keeping track of a task’s progress was monitored within the team and the responsible personnel would confer a percentage of the task complete for each countermeasure (see partial of Kazien Newspaper in Appendix B).
Kaizen Blitz3
To ensure that the makeready analysis would be effective, the researcher and the Kaizen group assessed the needs of the production area by conducting a systematic 5S blitz and then the researcher performed a Makeready Blitz which included the development of a spaghetti-mapping diagram and the use of a video recording of the makeready process. Once all information of the makeready process was collected, the Kaizen group and the researcher conducted post-analyses to develop improvements for the makeready process utilizing Single-Minute Exchange of Die (SMED) techniques.
5SBlitz
The researcher initially analyzed the organization of the operation by utilizing the 5S concept of sort, straighten, shine, standardize and sustain. The researcher walked around the production area and conducted a 5S audit,
3 Blitz is short for Blitzkrieg – German word for a sudden overpowering attack. In
43
relying on immediate perception and photographs of the production area to determine proper organization based on the following criteria: Sort, to distinguish between needed and not needed; Straighten/ Set, to organize for easy access, straighten up and put things away; Shine, to sweep, wipe-down, clean, and fix the equipment and production area; Standardize, to implement a standard procedure for sort, straighten, and shine; Sustain, to establish a leader or group of leaders for the program.
The 5S audit checklist (see Appendix C) was used to initially classify the production area with a zero to five basis scorecard (zero indicated “no activity had occurred” and five indicated “no sustained violations” within the area). Essentially, the researcher’s 5S analysis addressed the elements listed on the 5S audit checklist. Once the 5S audit was completed, a 5S total score was
assigned by the Kaizen team, to the production area and was noted in the Kaizen Newspaper and Area Profile Event form.
Makeready Blitz
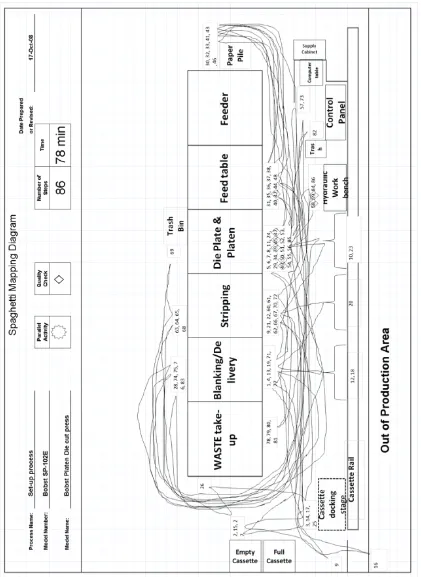
44
observing the actual makeready, conducting a spaghetti-mapping diagram to distinguish the operator’s path, and evaluate potential opportunities for makeready improvement. This information was to be used to increase
manufacturing flexibility by reducing long makeready times (DTI-Manufacturing Advisory Service, n.d.).
Spaghetti-Mapping Diagram. The current state map of the makeready process was captured through the use of a spaghetti-mapping diagram. During a live-makeready the diagram was populated by identifying steps used by the operator and then marking them, from the beginning to the end of the makeready process and the diagram exactly at the locations at which the operator performed them.
45
46
Video Recording. Video recording provided another method that captured data on the makeready process. The advantage to video recording was the built-in timer in the camera that provided accuracy in capturing the time that each step took. The Kaizen benefited during the analysis session with the operator who conducted the makeready because he was also a part of the Kaizen group and provided excellent post-analysis commentary. The operator worked concurrently with an assistant during the process, and the researcher recorded the parallel activities with a separate video recording device in order to have extensive data to scrutinize.
Set-up Observation Analysis Form. From the Spaghetti Diagram and Video Recording, the researcher used a Set-up Observation Analysis form to analyze the Makeready Blitz (see Appendix B).
The form was used to catalog the tasks and describe the actions for each step, while documenting the time to complete each step during the makeready. The Kaizen group, along with the researcher, collectively analyzed and
developed various suggestions for improvement of the makeready process. The entire Kaizen group was responsible for implementing the improvements.
47
[image:62.612.119.527.173.398.2]was defined under the acronym (F.A.S.T) developed by CELE to categorize each step within a process as seen in Table 6.
Table 6. F.A.S.T. Categorical Analysis
F – Foresight Preparation of equipment, information, and other tools while machine is operating.
A – Attachment Attaching necessary parts that the equipment
requires to function properly.
S – Setting Condition Setting and tuning of equipment to prepare the current project.
T – Trial Runs and Adjustments Run-up of equipment to finalize makeready activities
Data Analysis
The data gathered during the Kaizen blitz was analyzed using Lean, SMED, and TPM tools and techniques to evaluate the makeready procedure for process improvements.
Analysis of Machine and Process Effectiveness
48
significant element to focus on, and statistical analysis, the Individual X Chart, was important in determining process stability. The researcher focused on improving the makeready process with improvements that could be measured indirectly through the OEE metric, which emphasized improving machine availability, performance, and quality output with process improvement methodologies.
5S Analysis
The initial assessment with the 5S audit created a starting point for the Kaizen event. The 5S carefully identified every shelf, cabinet, wall/shadow boards, sign, floor marking, equipment, tool, and visuals based on the 5S audit form. Continued effort to maintain 5S in the production area was essential even after the Kaizen event was completed. A Platen Die Cutting 5S audit was formulated to sustain the 5S initiative (see Appendix C).
Makeready Analysis
The objective of the makeready analysis was to assess inefficient tasks within the makeready process during a real-time analysis. Opportunities to collect specific data pertaining to the makeready process were achieved during the spaghetti-mapping and video recording. Information about the process was analyzed in greater detail with the use of Setup Observation Analysis form.
49
Analysis form. The Makeready Checklist form was used to describe each process task, in numerical sequence (first task to last task), from the initial makeready observation. The list noted the standard time to execute each task, labeled as either an internal or external (I/E) activity, and indicated who was responsible for accomplishing the task during the makeready process (O – Operator; BT – Back tender/ Assistant; Both – Operator and/ or Backtender/ Assistant). The Kaizen group analyzed the procedures within the makeready and focused on the removal of excessive motion and the conversion of internal activities (IED) to external activities (OED).
Once the improvements had been confirmed and documented, a second checklist was developed to revise the original checklist for the platen die cutting makeready process. The Makeready Checklist form became a template for standard operating procedures for the makeready process. The form would also assist workers in determining whether they are ahead or behind in the
makeready process by providing specific time duration points of reference when conducting makeready procedures (see Appendix C).
50
Chapter 7
Results and Discussion
This section discusses the research results from the pareto chart, the Individual X Chart statistical analysis, and the OEE for the die cutting operation. The results also consider the improvements to the makeready process from the Kaizen event with the use of the 5S audit (Sort, Straighten, Shine, Standardize, and Sustain), the spaghetti-mapping diagram, and the video recording.
Overall the Kaizen event was successful in providing a better
understanding of the makeready process, while also demonstrating opportunities for time reduction and simplification to the makeready process.
Machine and Process Effectiveness Analysis
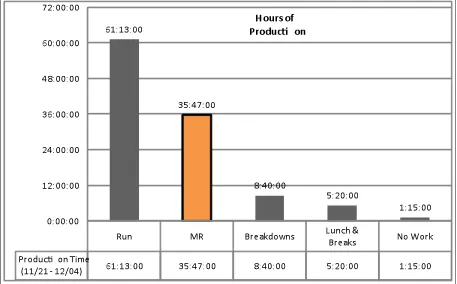
From the data that was gathered during the November 21, 2008 to December 4, 2008 production period, a pareto chart was constructed to reveal the overall production time breakdown.
Pareto Chart
51
[image:66.612.108.565.158.442.2]platen die cutting operation and approximately 32 percent of overall production time was spent in the makeready (MR) procedure (Figure 4).
Figure 4. Production for Platen Die Cutting (11/21 - 12/04)
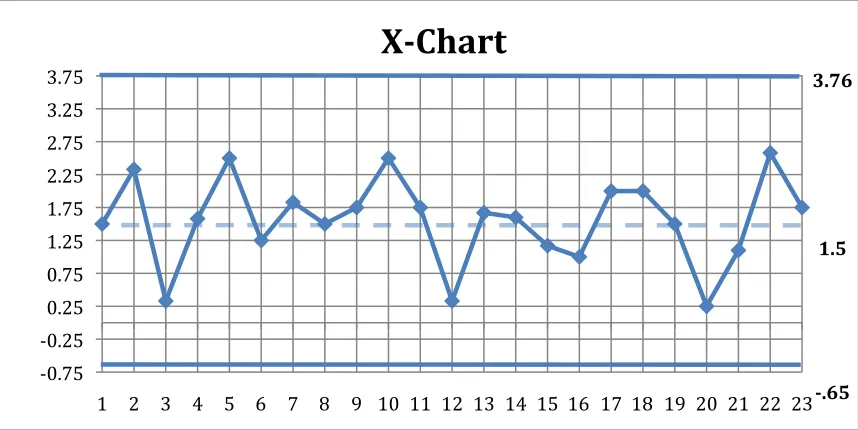
Individual X Chart
52
Figure 5. X-Chart Makeready Analysis
Figure 5 shows the X Chart makeready analysis of 23 data points. The Upper Control Limit (UCL, 3.76) and Lower Control Limit (LCL, -.65) were set at +/- 3 standard deviations from the Centerline (Mean, 1.50). The researcher used these control limits to determine whether the makeready process was within the standard normal curve. The makeready data points are shown in Table 7.
Table 7. Data Collection of 23 Makereadies (MR)
MR 1 2 3 4 5 6 7 8 9 10 11 12
Data 1.5 2.33 .33 1.58 2.5 1.25 1.83 1.5 1.75 2.5 1.75 .33
MR 13 14 15 16 17 18 19 20 21 22 23
Data 1.67 1.6 1.17 1 2 2 1.5 .25 1.1 2.58 1.75 ‐0.75 ‐0.25 0.25 0.75 1.25 1.75 2.25 2.75 3.25 3.75
1 2 3 4 5 6 7 8 9 10 11 12 13 14 15 16 17 18 19 20 21 22 23
3.76
1.5
.65
53 Discussion of OEE
The OEE metric was calculated for the production period November 24, 2008 to December 13, 2008 (see Appendix C). The OEE calculation multiplied three factors: Availability, Performance, and Quality. The initial OEE data set contained twenty-three makeready time samples and the OEE results are as follows:
• Availability = 57.9 percent • Performance = 40.8 percent • Quality = 99.9 percent
• Total OEE = 23.6% (which was significantly below industry average).
Theoretical Results. Results from the Kaizen event indicated that makeready directly affected the availability of time production time during the platen die cutting operation, an increase to availability could directly increase the makeready for the platen die cutting operation.
A comparison was made between the initial Availability and the Theoretical Results of an improved OEE as seen in Table 8.
Table 8. Comparison Results of Availability and OEE to Makeready Improvements
Availability OEE
Initial Result 57.9 % 23.6 %
54
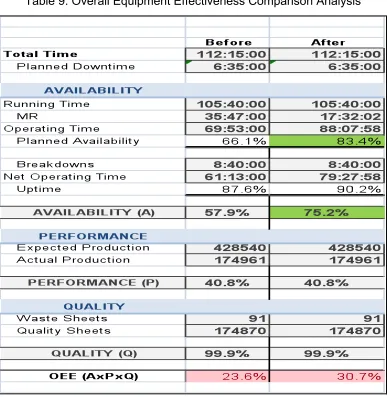
The overall makeready time during the two-week production period was 35 hours 47 minutes. With the use of SMED techniques, a possible 18 hours (or 51 percent) of makeready time could be isolated and improved in order to
increase machine Availability.
[image:69.612.131.518.290.687.2]Table 9 shows a completed Theoretical Analysis of OEE with Availability, Performance, and Quality affected by the changes.
55
With a 51 percent reduction to makeready time, OEE is still below ideal industrial average ranges of 40 percent. Quality is at an optimal rate of 99 percent but with the increase to Availability improvement to OEE is realized. Performance is an area that was not directly impacted by the platen die cutting makeready
improvements. Further investigation would be needed to determine the improvements necessary to increase equipment productivity.
Platen Die Cutting 5S Results
From the initial 5S Audit, the researcher and Kaizen group distinguished what was needed and not needed in the production area for the platen die cutting operation. Results from the 5S blitz significantly optimized the production flow in the platen die cutting production area by removing the unnecessary items and keeping only the required tools, equipment, supplies, and information that are essential during platen die cutting production.
Figure 6 illustrates the before and after condition of a supply cabinet illustrating the need to keep on hand only necessary supplies. The cabinet was completely emptied and only the necessary items for the platen die cutting operation were retained and then organized in the cabinet.
56
Figure 6. 5S Process, Before (left) and After (right) of Supply Cabinet
The cabinet items were replenished by an individual in purchasing; consequently, the responsibility for sustaining the cabinet inventory was placed within the purchasing department. Information on replenishing supply items would be communicated to the purchasing department as directed in the policy for Company DP.
The researcher along with the Kaizen group developed an idea to place machine tools (allen wrenches, knives, mallets, etc) on the platen die cutting machine itself; tools were labeled and color-coded orange, in order to increase visual identification. Figure 7 illustrates a before and after result of the
57
Figure 7. 5S Process, Before (right) and After (left) of Machine Tools Operator Side
The orange-colored tooling clearly showed that the tools belong in the platen die cutting area, thus serving as a visual stimulus to keep the tools in that production area. Previously, tools were often borrowed and never returned to their proper location.
58
name and size were listed on the Platen Die Cutting 5S Audit list in order to standardize the location of the tools.
[image:73.612.115.537.276.490.2]The platen die cutting workbench was another area of concern during the 5S. During the Kaizen event, the researcher and Kaizen group identified that the die cutting workbench was very cluttered and disorganized. The application of the 5S methodology was applied to the workbench, as seen in Figure 8.
Figure 8. 5S Process, Before (left) and After (right) of Workbench