http://strathprints.strath.ac.uk/26479/
Strathprints is designed to allow users to access the research output of the University of Strathclyde. Copyright © and Moral Rights for the papers on this site are retained by the individual authors and/or other copyright owners. You may not engage in further
distribution of the material for any profitmaking activities or any commercial gain. You may freely distribute both the url (http://strathprints.strath.ac.uk) and the content of this paper for research or study, educational, or not-for-profit purposes without prior
permission or charge. You may freely distribute the url (http://strathprints.strath.ac.uk) of the Strathprints website.
Assessing the effects of power quality on partial discharge behaviour
through machine learning
V. M. Catterson, S. E. Rudd and S. D. J. McArthur Institute for Energy and Environment
University of Strathclyde Glasgow, G1 1XW, United Kingdom
S. Bahadoorsingh and S. M. Rowland School of Electronic and Electrical Engineering
The University of Manchester
P. O. Box 88, Manchester, M60 1QD, United Kingdom
Abstract
Partial discharge (PD) is commonly used as an indicator of insulation health in high voltage equipment, but research has indicated that power quality, particularly harmonics, can strongly influence the discharge behaviour and the corresponding pattern observed. Unacknowledged variation in harmonics of the excitation voltage waveform can influence the insulation’s degradation, leading to possible misinterpretation of diagnostic data and erroneous estimates of the insulation’s ageing state, thus resulting in inappropriate asset management decisions. This paper reports on a suite of classifiers for identifying pertinent harmonic attributes from PD data, and presents results of techniques for improving their accuracy. Aspects of PD field monitoring are used to design a practical system for on-line monitoring of voltage harmonics. This system yields a report on the harmonics experienced during the monitoring period.
1. Introduction
The lifetime of high voltage electrical equipment is often determined by the health and dielectric strength of the insulation system. These insulation systems may be primarily solid, solid and liquid, or gaseous, as in the cases of underground cables, power transformers, and gas-insulated switchgear, respectively(1). Insulation condition
monitoring is key for detecting potential problems, with the aim of prolonging equipment life.
Degradation of insulation can be signalled by partial discharge (PD), a localised phenomenon where charge partially bridges the insulation. The changes to PD behaviour are traditionally used to determine the progression of insulation breakdown, and thus the deteriorating health of the equipment. However, it has been shown that power quality, particularly harmonics, can also affect the pattern of PD observed(2),
This paper presents a suite of classifiers for identifying particular attributes of the harmonics that can pollute the excitation voltage waveform. Practical aspects of how and when PD monitoring is performed drive the design of improvements to these classifiers. This is a novel use of PD data, which is generally used for fault diagnosis and health assessment. The paper presents the design and rationale for a software system for on-line monitoring of power quality using PD data.
2. Related work
A partial discharge occurs within electrical insulation when the dielectric strength of the insulation diminishes sufficiently that electrical discharges can partially bridge the insulation gap. PD is a sign of deteriorating insulation, but also causes further insulation damage. The initial defect may occur due to manufacturing error, contamination during commissioning, or contamination and shocks over the life of the plant item.
When PD is detected, the pattern of discharge behaviour should be analysed to determine the appropriate course of action. Occasional bursts of PD are of far less concern than continuous PD activity. Deterioration of the insulation can be signalled by increases to the regularity and severity of PD. It is therefore advisable to monitor plant under suspicion to determine a baseline level of PD activity, for future comparison.
Secondly, the pattern of PD occurrence relative to the voltage phase holds information about the source defect causing the PD activity. The phase-resolved plot shows significant features that differ depending on whether, say, PD activity is caused by a metallic protrusion from the conductor, or discharges across the surface of the insulation(1). This knowledge has resulted in research into machine learning techniques
for classifying the defect causing PD, using data-driven techniques such as neural networks(3), k-means, and rule induction(4); and knowledge-based expert systems(5).
However, all this work is predicated on the assumption that the excitation voltage is a pure power frequency (50 Hz or 60 Hz) sinusoidal waveform. Under this assumption, any changes to the PD activity can be assumed to be due to changes in the insulation: more frequent or larger discharges indicating increased weakening of the insulation, and changes to the phase distribution of discharges indicating a secondary defect.
At the increased voltage levels of the transmission networks, harmonic content is of diminished importance, compared to the distribution networks where harmonic content can be relatively high. Within a distribution network, the source of harmonics can be traced to non-linear loads injecting current at their point of connection(6)(7), such as
switched-mode power supplies in computers, and arcing devices like fluorescent lights. It has been established that harmonics present in the source voltage can have an influence on the pattern of PD activity observed in weakened insulation(2).
3. Classifier training
While a link has been established between harmonic content of the excitation voltage waveform and PD behaviour, the specific effects of different harmonic attributes have not been identified. Previous work began investigating the link by training classifiers to identify specific harmonic attributes from PD data, and in particular, the harmonics present in the voltage waveform(8), and the level of harmonic pollution as identified by the total harmonic distortion(9).
This section summarises this previous work, indicating the key decisions taken, and the open questions that remained in the area.
3.1 Harmonics present
Harmonic content interacting with the fundamental can result in a composite waveform with a peak voltage that is larger than the fundamental only(10). This makes PD
inception more likely, which will damage insulation further. Of particular concern to distribution networks are the prevalent 5th and 7th harmonic orders.
As a result, three classification tasks were investigated: identification of the presence of the 5th harmonic, identification of the presence of the 7th harmonic, and classification of
the set of harmonic orders present.
3.1.1 Data collection
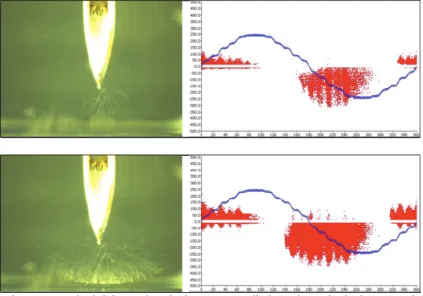
Point-plane epoxy resin samples were used to create electrical trees, a particularly damaging type of defect that affects polymeric insulation (see Figure 1). Eleven such samples progressed to the point of tree initiation under a pure 50 Hz voltage waveform. These samples were subjected to sequential application of the seven composite waveforms listed in Table 1, while the resulting PD data was captured(11).
The acquisition hardware records discharge amplitude and phase position of each PD within an 80 ms acquisition window. This gives phase-resolved data about the variable number of PDs within the window, and hence, a phase-resolved pattern of the burst of PD activity (Figure 1). The total dataset comprises 7091 such PD patterns.
3.1.2 Parameter selection
The research discussed in Section 2 has applied machine learning to PD data analysis, and of necessity feature vectors have been proposed and discussed, but there has been little comparison of features or assessment of appropriate features for the task. The features proposed fall into three main categories:
Table 1: Seven composite waveforms applied to defect samples.
Wave ID Harmonic Orders THD (%)
A 1, 3 40.00
B 1 (fundamental only) 0.00
C 1, 5 5.00
D 1, 7 5.00
E 1, 7 17.80
F 1, 5, 7, 11, 13, 23, 25 7.85
[image:5.595.166.433.504.683.2]G 1, 5, 7, 11, 13, 23, 25 5.00
Figure 1: On the left is an electrical tree at two distinct chronological stages of growth; on the right is the corresponding phase-resolved partial discharge pattern (red), with voltage phase on the x-axis and discharge amplitude on the
2. Statistical features of discharges in smaller phase windows. Brown et al. propose six equal-width phase windows: three for the positive half-cycle and three for the negative half-cycle(12); while Hao et al. suggest 100 phase windows(13). For
these windows, mean, standard deviation, and kurtosis are suggested.
3. Pattern descriptors, based on an expert’s approach to PD data interpretation(14).
These are frequently labelled parameters, rather than continuously valued parameters, and describe the pattern in terms such as phase position (which could be ‘on the zero-crossing points’ or ‘on the peaks’) and shape (with values such as ‘chopped sine’ or ‘knife-blade’). These descriptors are applied to the positive and negative half-cycles (or in the case of the discharges occurring across the zero crossings, to the two distinct areas of PD activity(14)), then the half-cycles compared for symmetry, giving a total of three features for every descriptor (e.g. positive shape, negative shape, and shape symmetry).
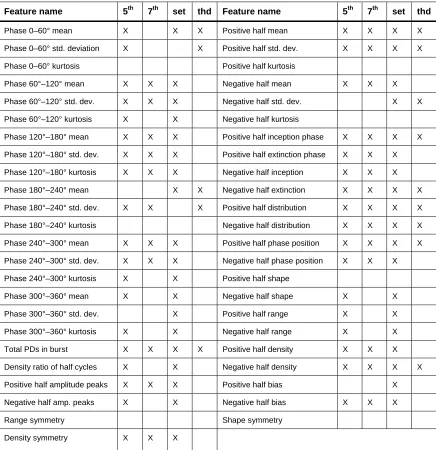
For the task of identifying harmonic components from PD data, a set of 47 features was created, using features of all three types identified above (Table 2). Features were selected for inclusion in the feature vector by the following procedure. For each classification task, the 47 features were ranked in importance using the Information Gain Ratio:
IGR(c, f) = [H(c) – H(c|f)] / H(f) ... (1)
Where c is the classification, f is the feature, and H is entropy. The best subset of features was selected from this ranked list, by training C4.5 decision trees using different sets from the top of the list, and taking the most accurate as being the best feature vector. This had the effect of selecting the features that give most information gain about the classification task, while limiting the “curse of dimensionality”(15) by
keeping the vector limited in size.
The results of this process showed some difference in the number and type of features most tailored for each of the three classification tasks. A summary of each of the three vectors is given in Table 2 (with the fourth vector for total harmonic distortion discussed later).
3.1.3 Technique selection
Identification of the presence of the 5th harmonic and identification of the presence of
the 7th harmonic are both binary classification tasks, while identification of the harmonic grouping has five classes. In all three cases C4.5 decision trees were trained, giving accuracies of 83.8%, 90.9%, and 77.5% respectively.
For comparative purposes, a Support Vector Machine (SVM) using the Radial Basis Function (RBF) kernel was trained to identify the presence of the 7th harmonic, yielding
Table 2: 47 features, and the vectors they appear in. The classifiers are the presence of the 5th harmonic (‘5th’), the presence of the 7th harmonic (‘7th’), the set of harmonic orders (‘set’) and the total harmonic distortion (‘thd’).
Feature name 5th 7th set thd Feature name 5th 7th set thd
Phase 0–60° mean X X X Positive half mean X X X X
Phase 0–60° std. deviation X X Positive half std. dev. X X X X
Phase 0–60° kurtosis Positive half kurtosis
Phase 60°–120° mean X X X Negative half mean X X X
Phase 60°–120° std. dev. X X X Negative half std. dev. X X
Phase 60°–120° kurtosis X X Negative half kurtosis
Phase 120°–180° mean X X X Positive half inception phase X X X X
Phase 120°–180° std. dev. X X X Positive half extinction phase X X X
Phase 120°–180° kurtosis X X X Negative half inception X X X
Phase 180°–240° mean X X Negative half extinction X X X X
Phase 180°–240° std. dev. X X X Positive half distribution X X X X
Phase 180°–240° kurtosis Negative half distribution X X X X
Phase 240°–300° mean X X X Positive half phase position X X X X
Phase 240°–300° std. dev. X X X Negative half phase position X X X
Phase 240°–300° kurtosis X X Positive half shape
Phase 300°–360° mean X X Negative half shape X X
Phase 300°–360° std. dev. X Positive half range X X
Phase 300°–360° kurtosis X X Negative half range X X
Total PDs in burst X X X X Positive half density X X X
Density ratio of half cycles X X Negative half density X X X X
Positive half amplitude peaks X X X Positive half bias X
Negative half amp. peaks X X Negative half bias X X X
Range symmetry Shape symmetry
Density symmetry X X X
3.2 Level of harmonics
In addition to particular harmonic orders, the level of harmonic distortion on the voltage waveform may also influence PD behaviour. A second set of experiments investigated classification of the level of harmonic distortion present from PD data(9).
3.1.1 Data collection
The same experimental technique(11) as described above was taken for creating electrical
varying levels of total harmonic distortion. One sample experienced the fundamental and 5th harmonic only, a second experienced the fundamental and 7th harmonic only, while a third experienced the fundamental, 5th, and 7th harmonics in combination. For all
three samples, the seven waveforms comprised their assigned harmonic orders at 0%, 3%, 5%, 8%, 10%, 15%, and 18% total harmonic distortion (THD), where THD is the ratio of the power in the non-fundamental orders to the power in the fundamental component.
Data was acquired using the same hardware as above, and in total 2148 PD patterns were collected.
3.1.2 Parameter selection
Selection of parameters for inclusion in a feature vector proceeded as described above, with the calculation of IGR to rank features and the use of C4.5 to select a subset. A summary of the best vector is given in Table 2. Interestingly, while there are similarities in the most highly ranked features for the three harmonic order classification tasks, the top ranking features for identifying THD are rather different. Harmonic order classification draws on features from the voltage peak and trough, while THD identification focuses on the phase segment following a zero-crossing point. Also, the best feature vector for THD identification is much smaller than the harmonic order vectors.
3.1.3 Technique selection
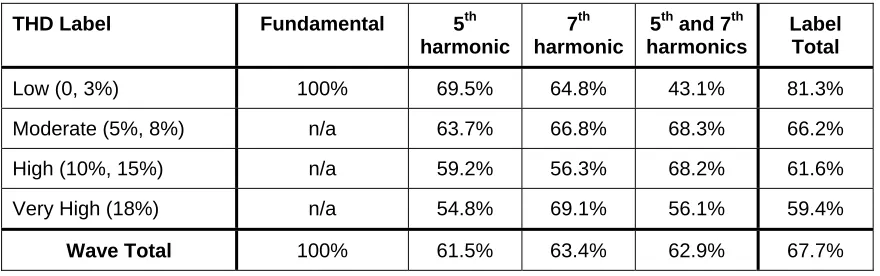
[image:8.595.79.519.593.731.2]After experimentation with regression and classification techniques, the most appropriate approach to THD identification was found to be classification of THD level (results in Table 3). The composite waveforms were given labels, with 0% and 3% THD being “low”, 5% and 8% being “moderate”, 10% and 15% being “high”, and 18% being “very high”. A C4.5 tree was trained to recognise the THD label, giving an accuracy of 67.7%. More detailed assessment of the results is interesting, showing an accuracy of 100% when identifying the fundamental frequency (i.e. 0% THD) as “low”, and accuracies between 61.5% and 63.4% when identifying the patterns captured in the presence of the 5th, 7th, and 5th and 7th harmonic orders.
Table 3: THD level classifier accuracy.
THD Label Fundamental 5th
harmonic
7th harmonic
5th and 7th harmonics
Label Total
Low (0, 3%) 100% 69.5% 64.8% 43.1% 81.3%
Moderate (5%, 8%) n/a 63.7% 66.8% 68.3% 66.2%
High (10%, 15%) n/a 59.2% 56.3% 68.2% 61.6%
Very High (18%) n/a 54.8% 69.1% 56.1% 59.4%
3.3 Discussion
This previous work showed promise, identifying various attributes of the harmonic content of the voltage waveform from PD patterns. Through a detailed feature selection process and the testing of various classification techniques, it appeared that these accuracies are as good as can be achieved for the training datasets described.
However, these classifiers all operate on a single PD pattern representing 80 ms of data. When performing PD monitoring on an item of plant in the field, data will be collected over an extended period of time, ranging from a few minutes at least to hours or days in total. The use of multiple patterns has the potential to improve performance, while more closely matching the diagnostic task presented by on-line field monitoring.
The remainder of this paper presents the approach to combining classifications of multiple PD patterns, along with the improvements achieved for the classifiers reported previously. Given the benefit of this approach, the design of a software system for automated harmonic analysis from PD is presented. This system can be used to assess the harmonic orders and level of harmonic distortion polluting the excitation voltage waveform, based on PD data captured from an item of plant.
4. Classifying multiple patterns
There are two potential routes for identifying harmonic attributes on the basis of multiple PD patterns that were discounted immediately, due to practical concerns. The first potential approach is to increase the size of the feature vector by repeating features for each pattern. This would mean, for example, that the 16-feature vector for identifying THD from one pattern would become 32 features for two patterns, and 48 features for three patterns. This has the distinct disadvantage of significantly increasing the dimensionality of the problem, leading to increased training times and the potential for overfitting on spurious relationships(15). It also means that the new classifiers would require a certain number of PD bursts before any classification could be made, which may not present a problem under conditions of severe insulation deterioration, but could take some minutes in more moderate situations.
Secondly, the same number of features could be calculated from the complete record of PD data captured, or from a rolling window of time such as 15 minutes. This removes the dimensionality problem, and mitigates the problem of waiting for data, but practical network operation suggests it may not always be appropriate. Since the harmonic content on the voltage waveform is caused by the connection and disconnection of certain loads and equipment elsewhere on the network(6), there is no guarantee that the harmonic content will remain constant over a moving window of time. By calculating features from an aggregate of different PD bursts, data could be presented for classification that was generated by two or more different polluted waveforms, thus increasing the classifier’s confusion and reducing the potential accuracy.
hybrid system of classification and aggregation, allowing the certainty of harmonic attribute identification to increase with the number of patterns classified.
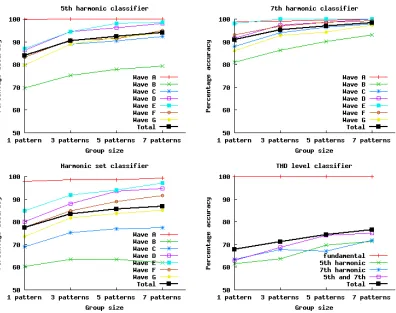
To test the benefit of this approach, PD data was grouped into batches of three sequential patterns, five sequential patterns, and seven sequential patterns. These batches were run through the C4.5 classifier trees described above, and simple majority voting was used to determine the most likely diagnosis. For example, if three PD patterns captured under Wave A conditions were classified as {no 5th harmonic, no 5th
harmonic, 5th harmonic present}, the majority opinion is that the 5th harmonic is not present, and this is the final diagnosis of the aggregation stage.
The results for each of the classifiers indicate that accuracy increases with the number of patterns included in the voting. In the case of identifying the 5th harmonic, accuracy
increases from 83.8% when considering individual patterns to 93.9% for groups of seven (Figure 2, top left). For the presence of the 7th harmonic, accuracy started high at
90.9% for individual patterns, and increases to 98.2% for seven in a row (Figure 2, top right). Identification of the set of harmonic orders goes from 77.5% for individual patterns to 86.7% for groups of seven (Figure 2, bottom left). Classification of the correct THD level increases more moderately, from 67.7% for individual patterns to 76.8% for groups of seven (Figure 2, bottom right).
These results show that the accuracy of each classifier can be increased by considering multiple PD patterns. Simple majority voting can be used to aggregate the results of sequential classifications, with more patterns in the group leading to more accurate diagnoses. In an on-line monitoring situation, the reason for discrepancy between pattern classifications could be due to changing harmonic content of the voltage waveform, therefore it is inappropriate to simply discount the minority votes as inaccurate. The following section describes how these classifiers and aggregators can be combined into an on-line system for harmonic analysis.
5. System design
Once PD monitoring equipment has been installed on an item of plant such as a cable, it is likely to remain there for some period of time to capture a representative set of PD patterns. This time may range from an hour to a few days or even longer, but the aim is to determine whether PD behaviour changes with time of day, load profile, or other factors, which can help identify the source and plan for corrective maintenance.
This coincidentally suits the needs of PD monitoring for harmonic content analysis. The harmonic content of the network voltage is unlikely to remain constant through the monitoring period, as it is driven by connection and disconnection of particular loads elsewhere on the network. As a result, an on-line system should seek to analyse PD patterns throughout the monitoring period, with the aim of producing a report or summary of the dominant harmonic features present during that time.
were recorded under the same harmonic conditions. (The identification of harmonic order grouping is less relevant in on-line situations, as a robust training data set would have to contain many more combinations of harmonics than the five groups employed.) This strikes an appropriate engineering balance between increased certainty in the classifications versus the likelihood that the harmonic content changed multiple times during the seven consecutive periods of data capture.
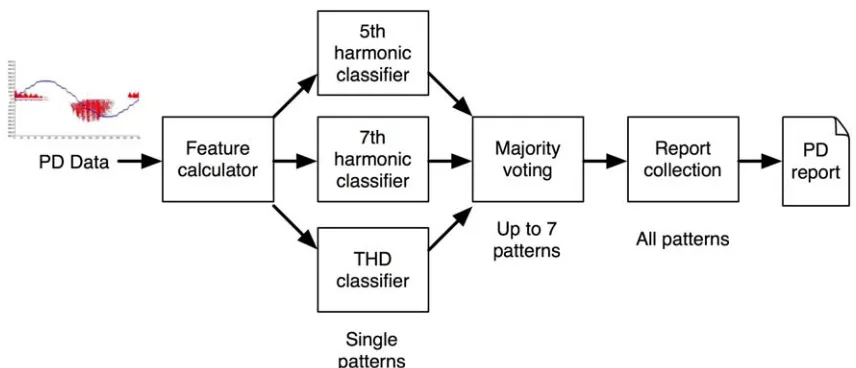
As a result, an on-line harmonic assessment system has four distinct layers or stages (Figure 3). The first is to calculate appropriate features from the raw PD patterns, which are forwarded to the classifiers of the second stage. The third stage aggregates groups of up to seven patterns in a row, and uses majority voting to determine the most likely conclusions. These are forwarded to a fourth stage of processing, which aggregates data over the whole monitoring period to produce a summary report on harmonic behaviour.
[image:11.595.101.497.87.400.2]This system provides a tool to use in parallel to other PD analysis techniques. In addition to diagnosing the type and location of defects causing PD, classification of harmonic content gives another type of analysis for PD data, which can influence the conclusions drawn about the current health and rate of deterioration of insulation.
Figure 2: The accuracy of the four C4.5 classifiers when analysing PD patterns individually, and when using majority voting on groups of three, five, and seven
6. Conclusions
Since recent research shows the influence of harmonic content in the voltage waveform on PD activity within electrical insulation, this paper presents a suite of classifiers that can identify certain harmonic orders and the THD from PD data. Results show that the accuracy of these classifiers can be improved by analysing multiple PD patterns, and using simple majority voting to determine the most likely diagnosis. This paper also presents the design of an on-line software system for harmonic content analysis, using a suite of classifiers and majority voting to produce a report on dominant harmonic attributes during the monitoring period. This system balances the increased accuracy of using multiple patterns against the practical issues of highly changeable harmonic pollution, due to other loads on the network.
Acknowledgements
This work was funded through the EPSRC Supergen V, UK Energy Infrastructure (AMPerES) grant in collaboration with UK electricity network operators working under Ofgem’s Innovation Funding Incentive scheme—details on
<http://www.supergen-amperes.org>.
References
1. CIGRE Working Group D1.11, ‘Knowledge rules for Partial Discharge Diagnosis in Service’, Technical Brochure No. 226, April 2003.
2. B Florkowski, M Florkowski, and P Zydron, ‘The Role of Harmonic Components on Partial Discharge Mechanism and Degradation Processes in Epoxy Resin Insulation’, 2007 Int Conf on Solid Dielectrics, Winchester, UK, July 2007.
[image:12.595.82.510.81.265.2]3. E Gulski and A Krivda, ‘Neural networks as a tool for recognition of partial discharges’, IEEE Trans Electrical Insulation, Vol 28, No 6, pp 984-1001, December 1993.
4. S D J McArthur, S M Strachan, and G Jahn, ‘The Design of a Multi-Agent Transformer Condition Monitoring System’, IEEE Trans Power Systems, Vol 19, No 4, pp 1845-1852, November 2004.
5. S M Strachan, S Rudd, S D J McArthur, M D Judd, S Meijer, and E Gulski, ‘Knowledge-based diagnosis of partial discharges in power transformers’, IEEE Trans Dielectrics and Electrical Insulation, Vol 15, pp 259-268, 2008.
6. A Kusko and M T Thompson, ‘Power quality in electrical systems’, McGraw-Hill, 2007.
7. IEEE, ‘Std 519-1992, IEEE recommended practices and requirements for harmonic control in electrical power systems’, 1992.
8. S Bahadoorsingh, S M Rowland, V M Catterson, S E Rudd, and S D J McArthur, ‘The Role of Circumstance Monitoring on the Diagnostic Interpretation of Condition Monitoring Data’, Int Symp Electrical Insulation (ISEI 2010), San Diego, USA, June 2010.
9. S Bahadoorsingh, S M Rowland, V M Catterson, S E Rudd, and S D J McArthur, ‘Interpretation of Partial Discharge Activity in the Presence of Harmonics’, 10th IEEE Int Conf on Solid Dielectrics (ICSD), Potsdam, Germany, July 2010.
10. F Guastavino, L Centurioni, G Coletti, A Dardano, and E Torello, ‘An experimental study about the treeing phenomena in XLPE subjected to distorted voltages’, IEEE Conf Electrical Insulation and Dielectric Phenomena, Albuquerque, USA, 2003. 11. S Bahadoorsingh and S M Rowland, ‘Investigating the influence of the lubricant
coating on hypodermic needles on electrical tree characteristics in epoxy resin’, IEEE Trans Dielectrics and Electrical Insulation, to appear.
12. A J Brown, V M Catterson, M Fox, D Long, and S D J McArthur, ‘Learning Models of Plant Behaviour for Anomaly Detection and Condition Monitoring’, Int Conf Intelligent Systems Applications to Power Systems (ISAP), 2007.
13. L Hao, P L Lewin, S J Dodd, ‘Comparison of support vector machine based partial discharge identification parameters’, Int Symp Electrical Insulation (ISEI 2006), Toronto, Canada, 2006.
14. S Rudd, S D J McArthur, and M D Judd, ‘A generic knowledge-based approach to the analysis of partial discharge data’, IEEE Trans Dielectrics and Electrical Insulation, Vol 17, No 1, pp 149-156, 2010.